©The Author(s) 2025.
World J Gastroenterol. Jul 14, 2025; 31(26): 105656
Published online Jul 14, 2025. doi: 10.3748/wjg.v31.i26.105656
Published online Jul 14, 2025. doi: 10.3748/wjg.v31.i26.105656
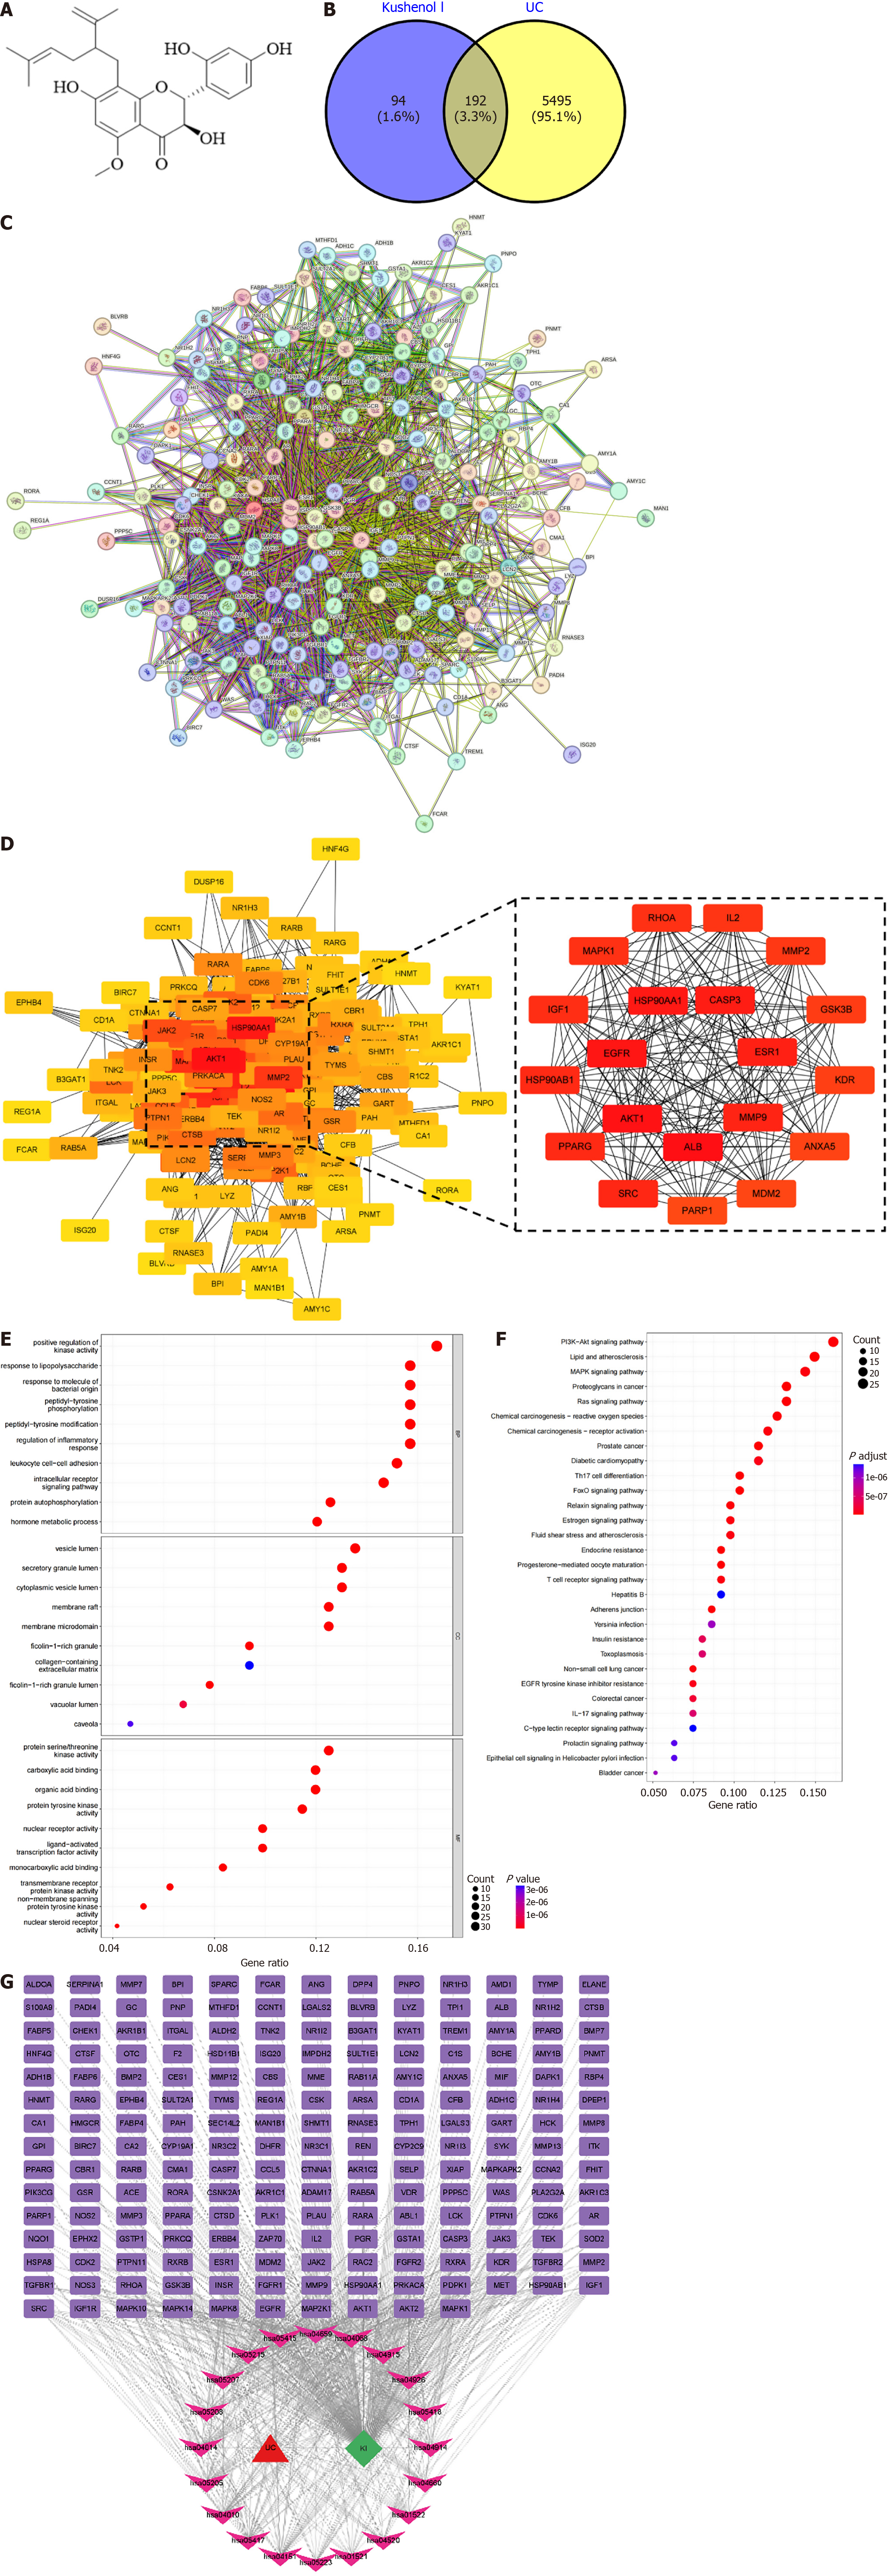
Figure 1 Potential targets and network analysis of kushenol I in the treatment of ulcerative colitis.
A: Structure of kushenol I (KSCI); B: Venn diagram showing potential gene targets; C and D: Protein-protein interaction network of KSCI in treating ulcerative colitis (UC); E: Gene Ontology analysis of KSCI in the treatment of UC; F: Enrichment analysis of KSCI in treating UC using Kyoto Encyclopedia of Genes and Genomes pathways; G: Compound-target-disease-pathway network illustrating the potential mechanisms of action of KSCI in the treatment of UC. AKT: Protein kinase B; IL: Interleukin; MAPK: Mitogen-activated protein kinase; PI3K: Phosphoinositide 3-kinase.
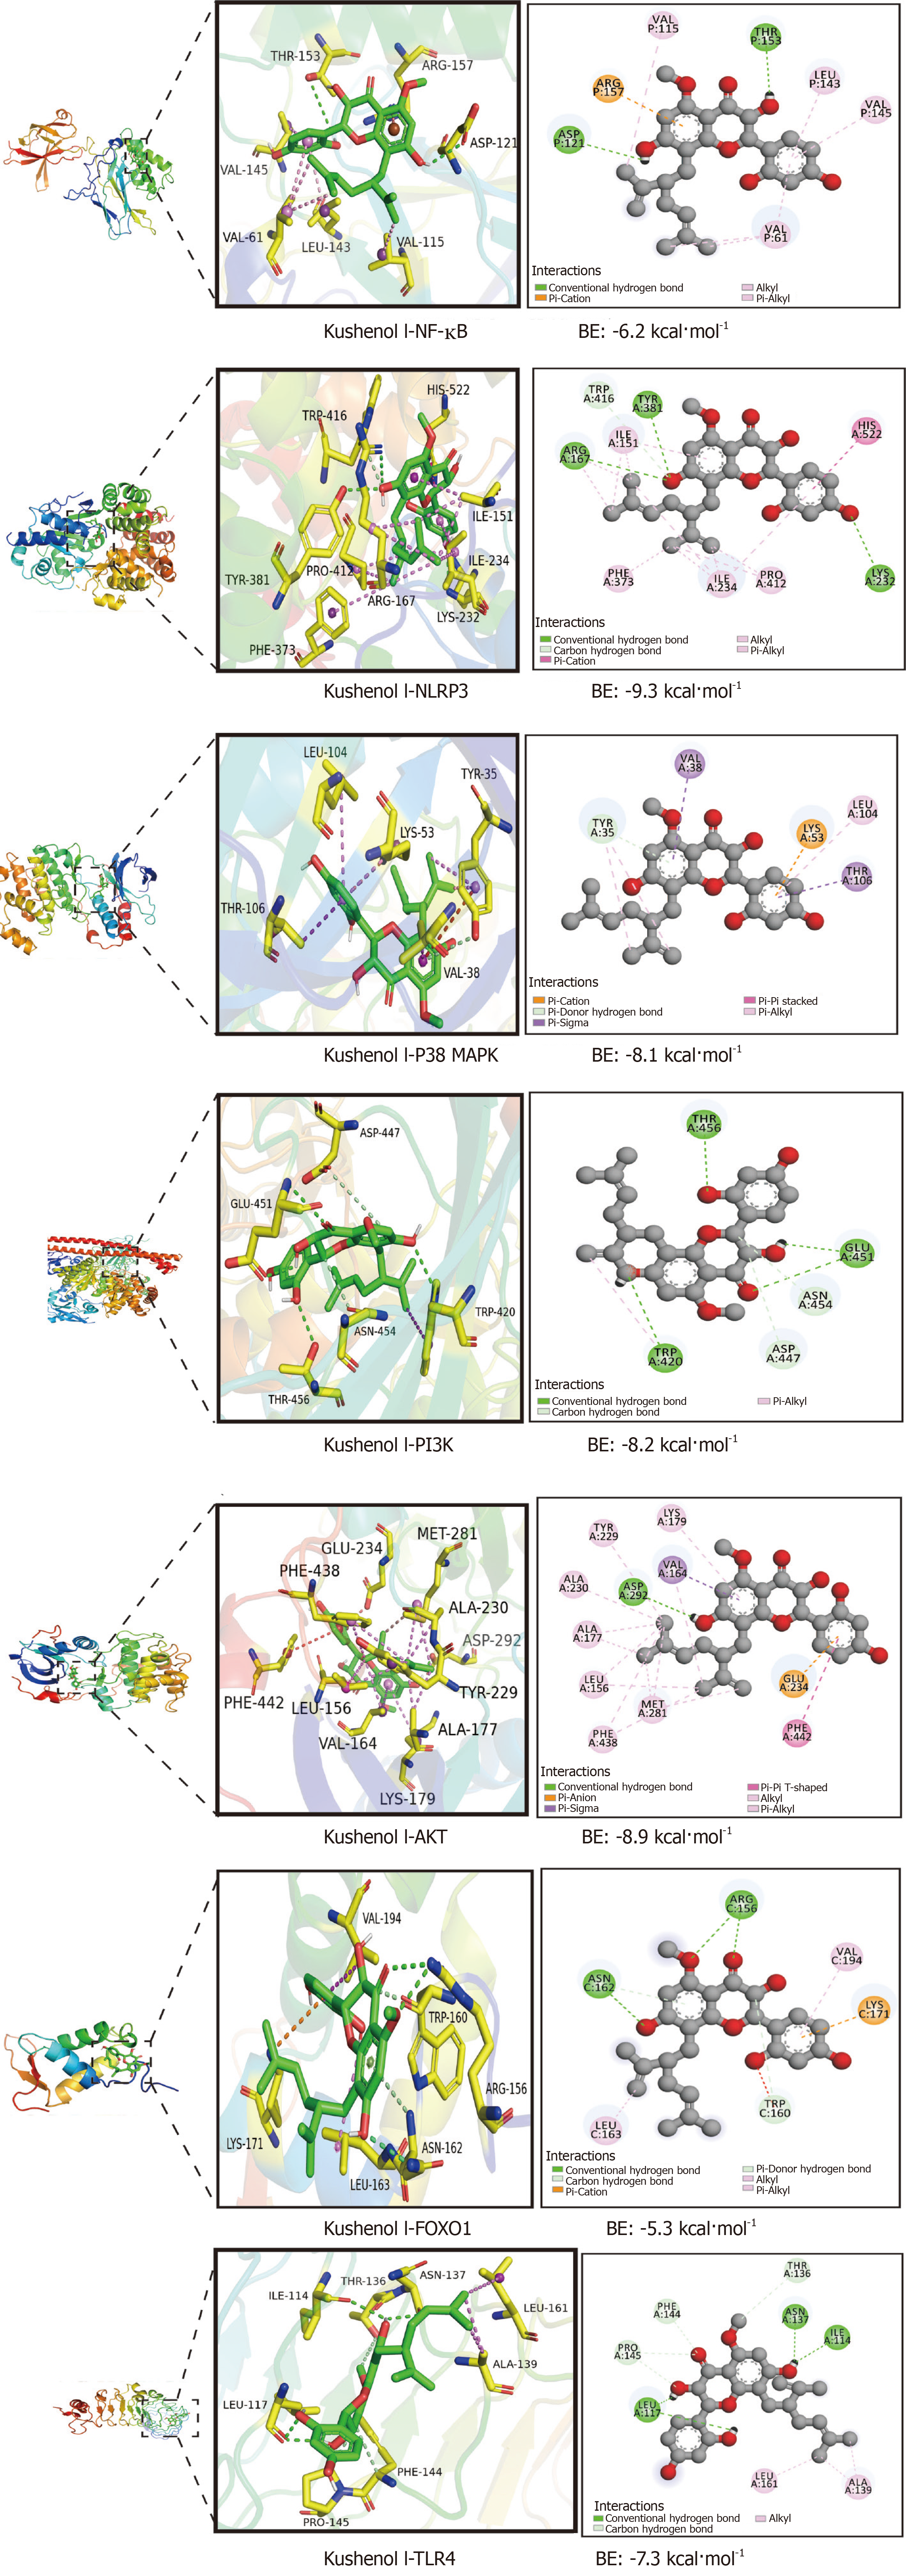
Figure 2 Molecular docking and corresponding scores of kushenol I with key targets protein kinase B, p38 mitogen-activated protein kinase, NOD-like receptor thermal protein domain associated protein 3, phosphoinositide 3-kinase, protein kinase B, forkhead box O1, and Toll-like receptor 4, are presented.
AKT: Protein kinase B; FOXO1: Forkhead box O1; NF-κB: Nuclear factor kappa B; NLRP3: NOD-like receptor thermal protein domain associated protein 3; p38 MAPK: p38 mitogen-activated protein kinase; PI3K: Phosphoinositide 3-kinase; TLR4: Toll-like receptor 4.
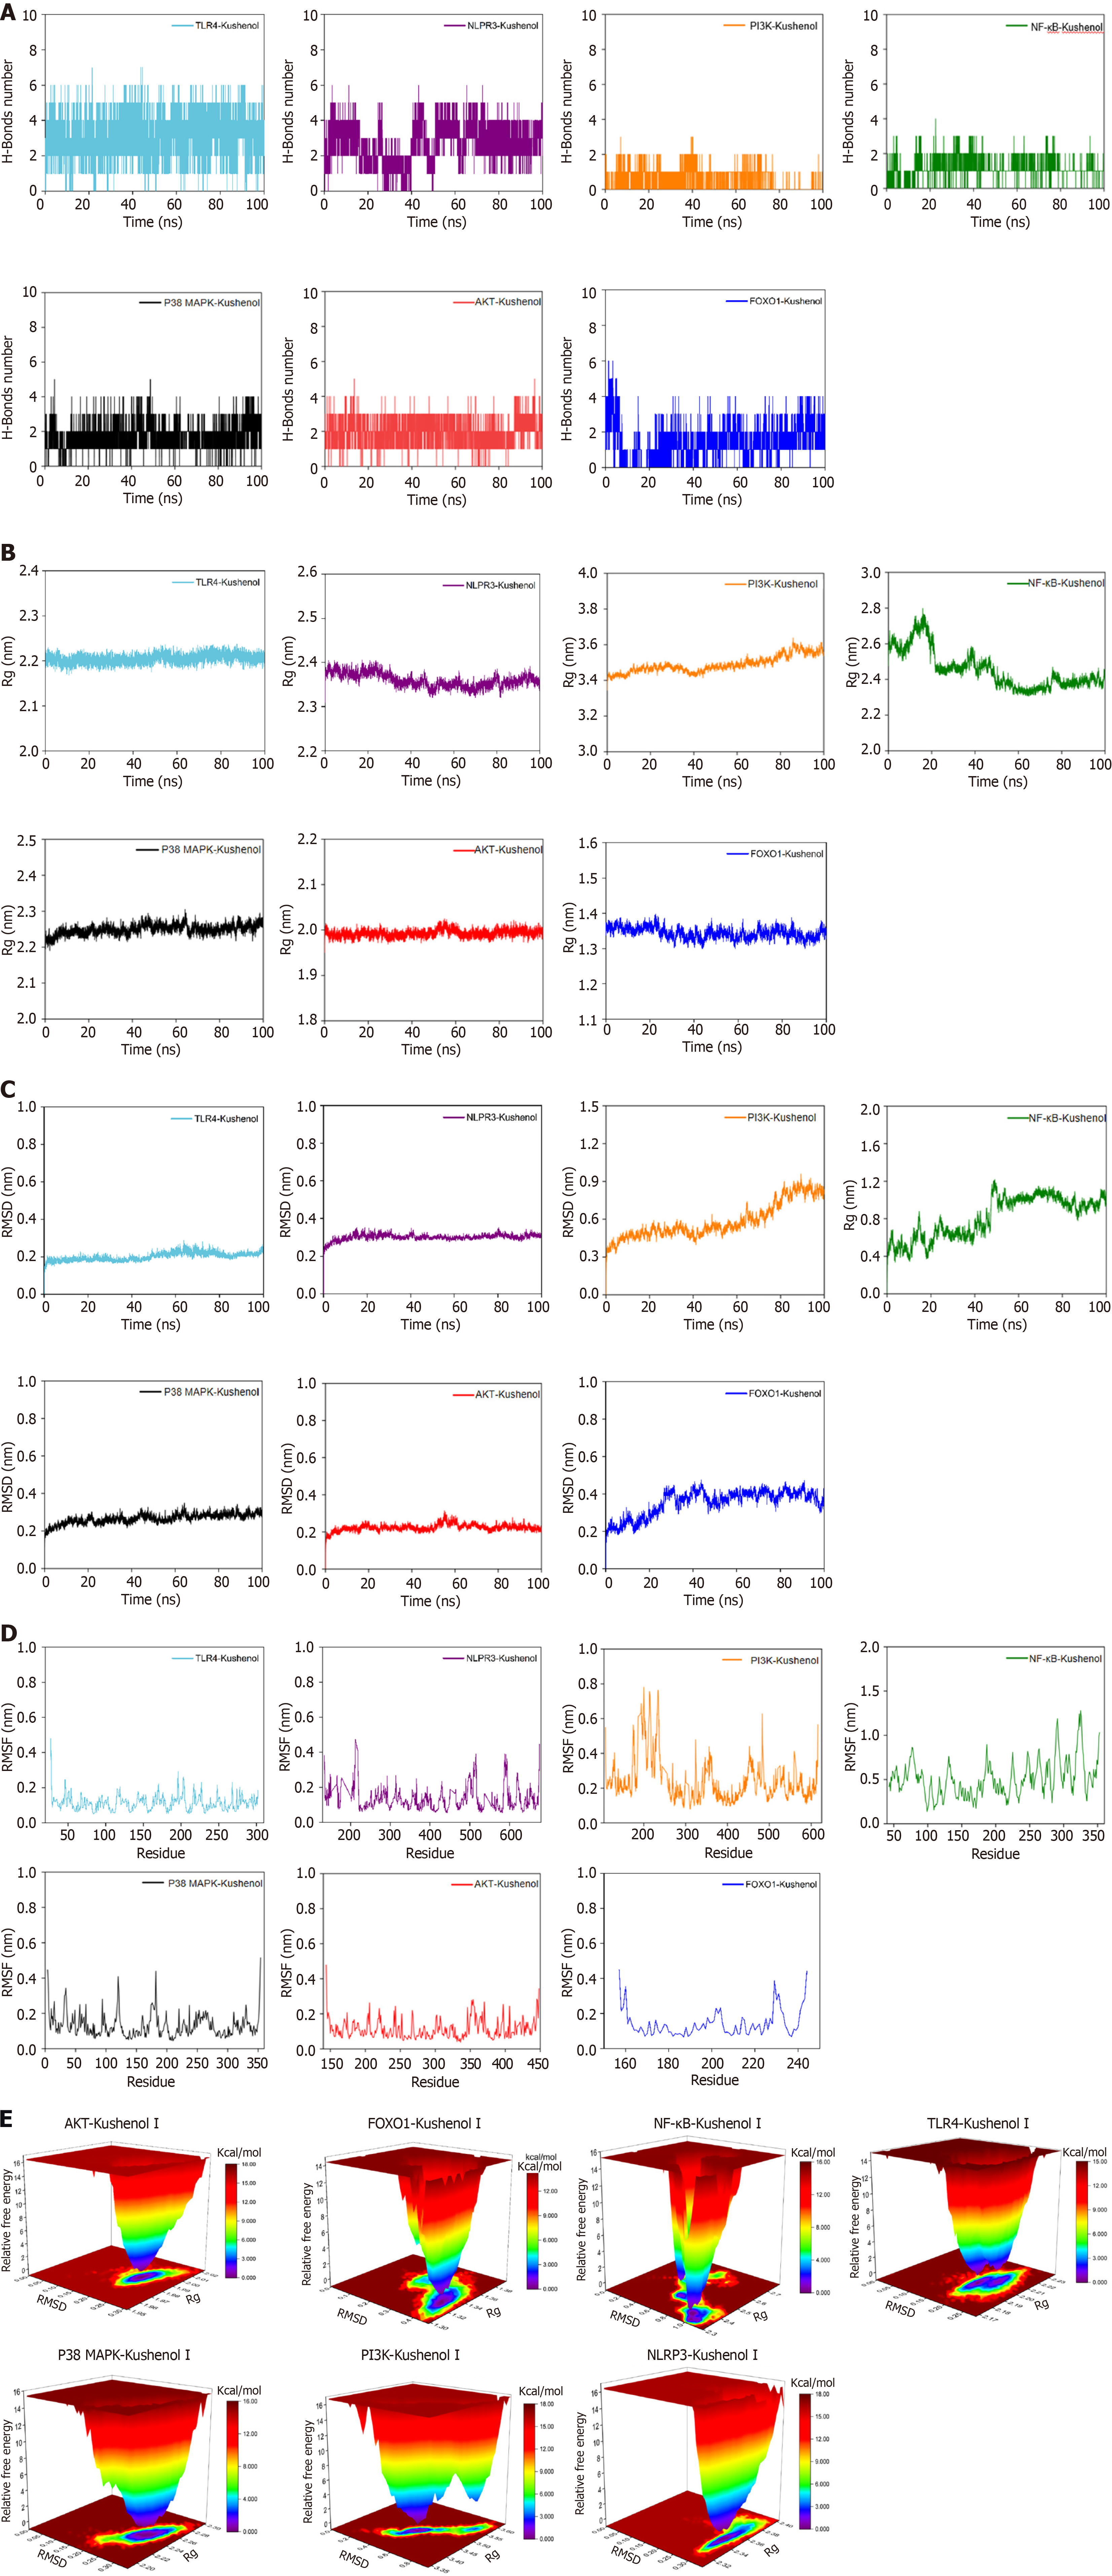
Figure 3 Molecular dynamics simulation results of kushenol I interacting with protein kinase B, forkhead box O1, nuclear factor kappa B, NOD-like receptor thermal protein domain associated protein 3, phosphoinositide 3-kinase, p38 mitogen-activated protein kinase, and Toll-like receptor 4.
A: Fluctuation curves of hydrogen bond numbers; B: Radius of gyration curves; C: Root mean square deviation curves; D: Root mean square fluctuation curves; E: Free energy landscape. AKT: Protein kinase B; FOXO1: Forkhead box O1; NF-κB: Nuclear factor kappa B; NLRP3: NOD-like receptor thermal protein domain associated protein 3; p38 MAPK: p38 mitogen-activated protein kinase; PI3K: Phosphoinositide 3-kinase; Rg: Gyration radius; RMSD: Root mean square deviation; RMSF: Root mean square deviation; TLR4: Toll-like receptor 4.
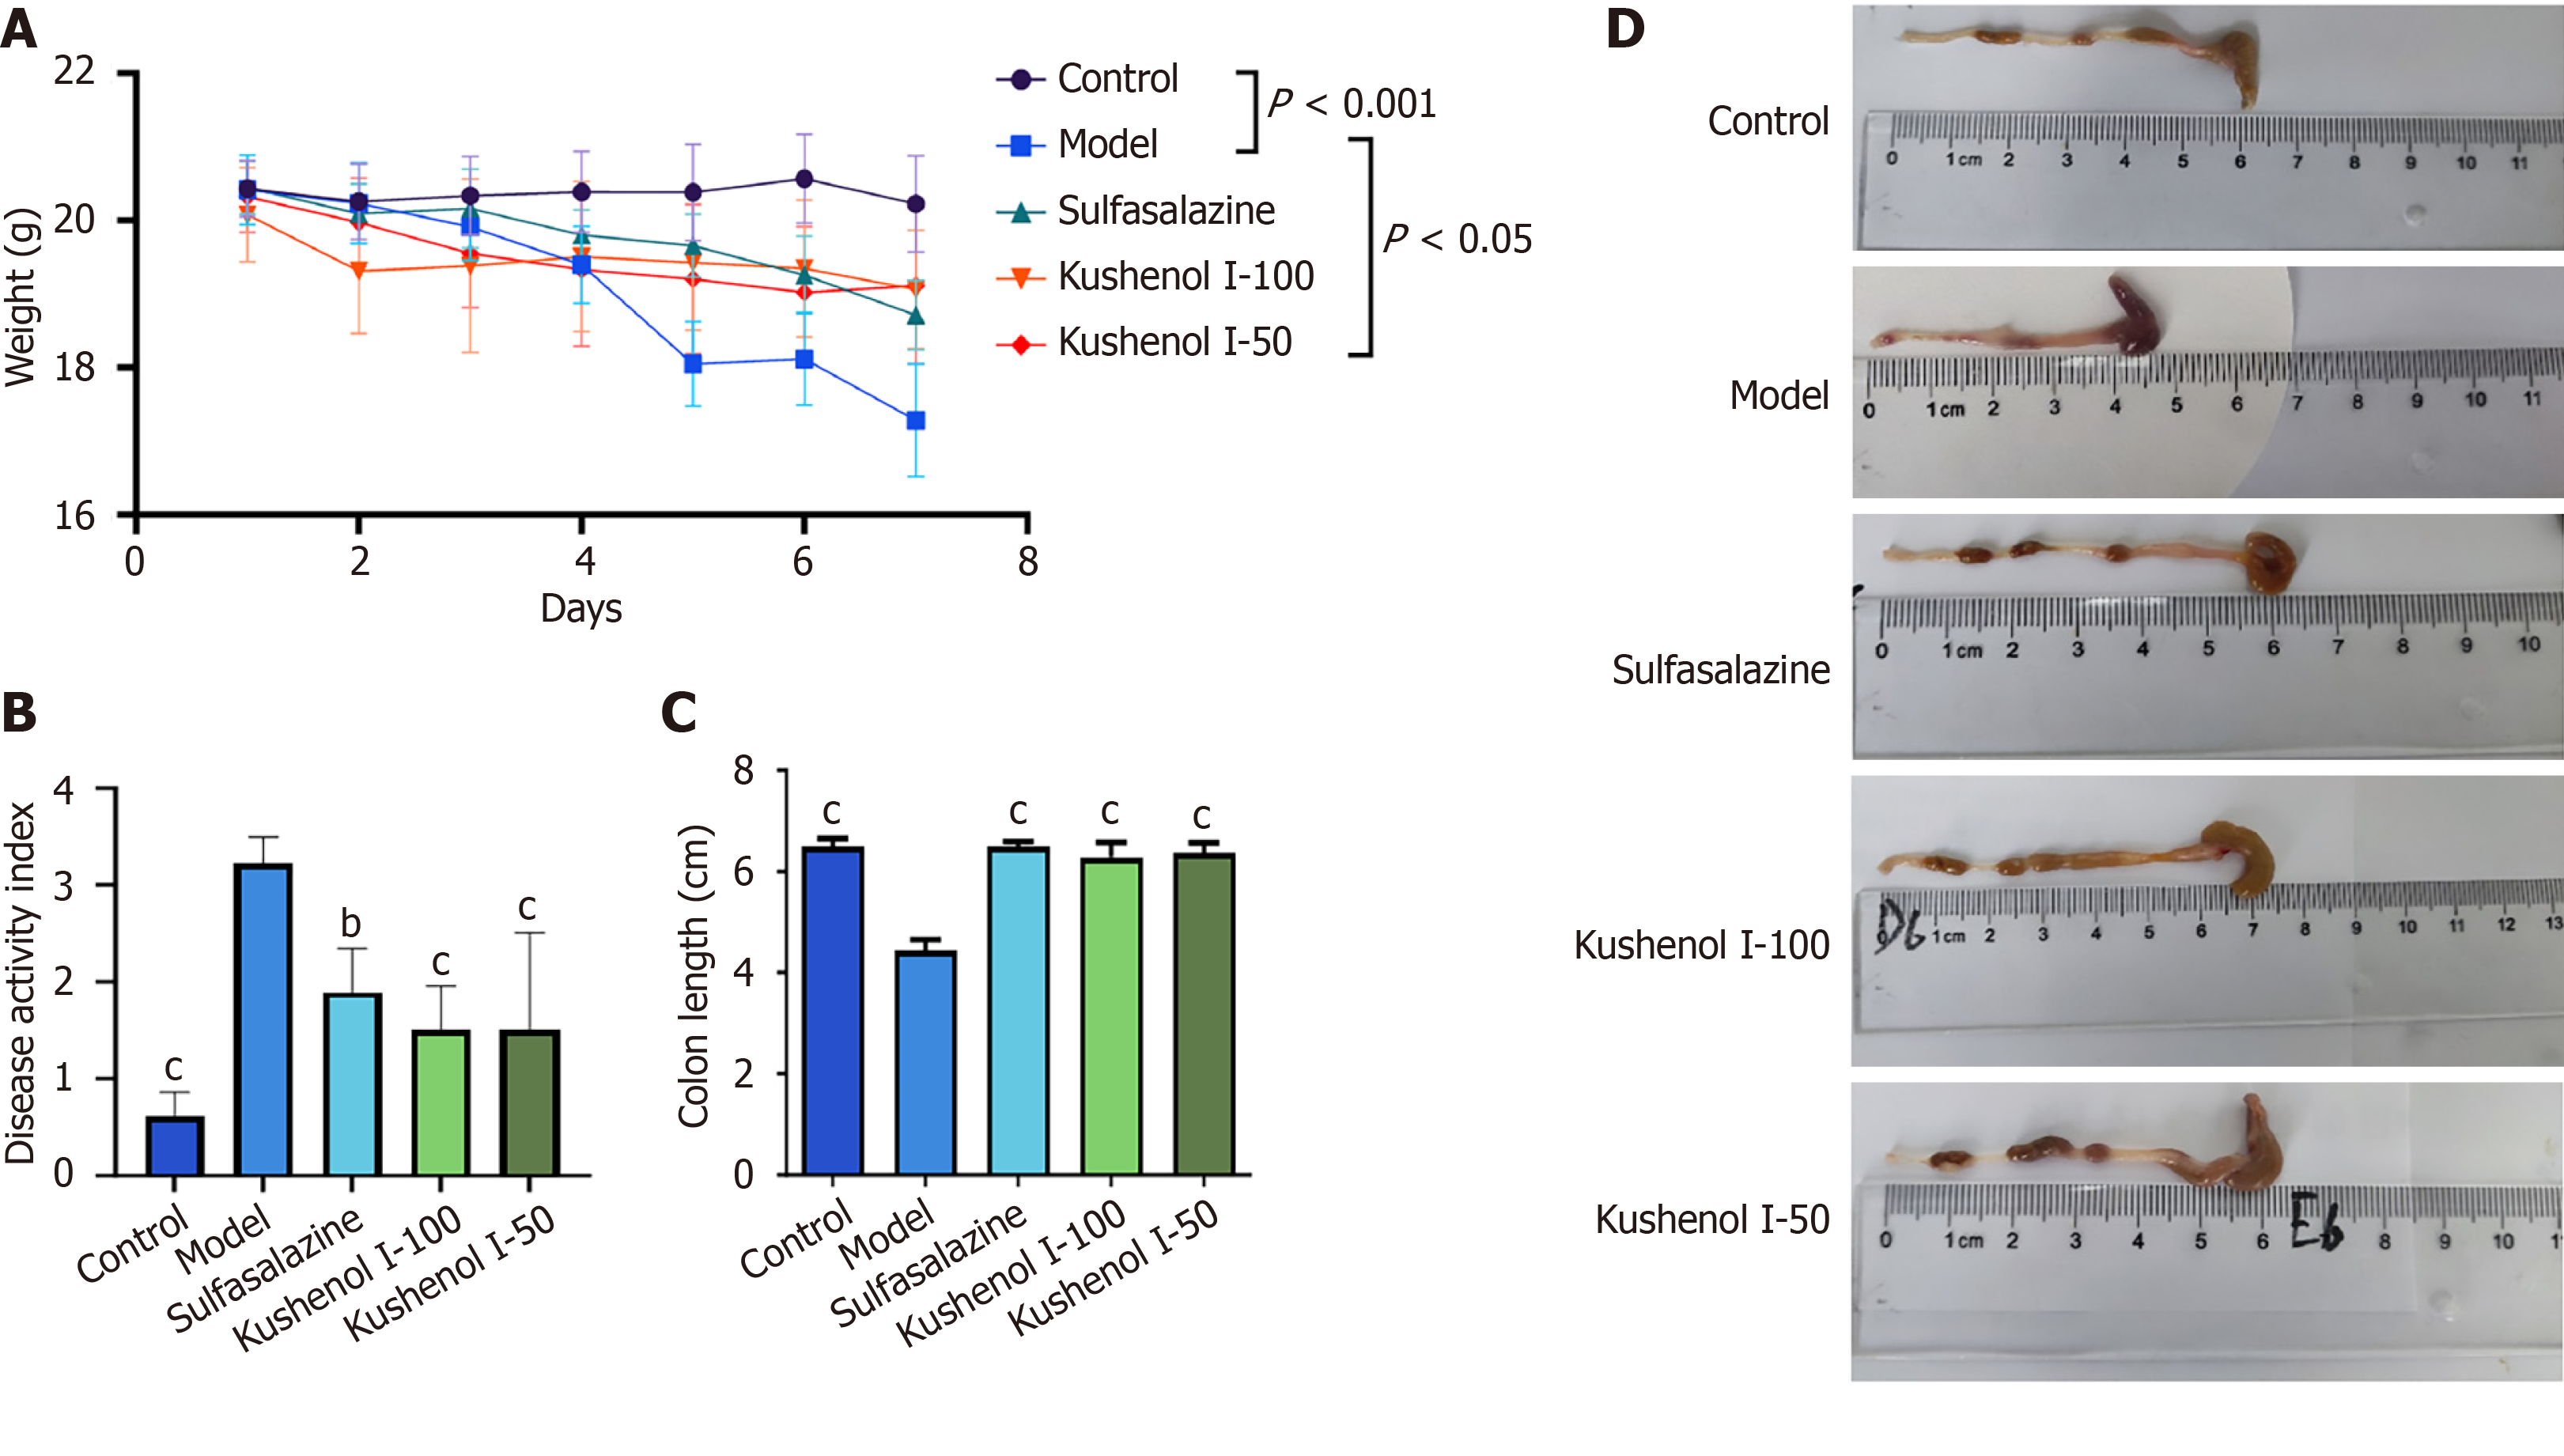
Figure 4 Impact of kushenol I on the clinical symptoms and colonic histopathology in mice with dextran sulfate sodium-induced ulcerative colitis.
A: Changes in body weight during the experiment; B: Disease activity index scores of mice; C: Colon length; D: Representative photographs of mouse colons. Values are presented as the mean ± SD (n = 6). bP < 0.01. cP < 0.001. P compared with the model group.
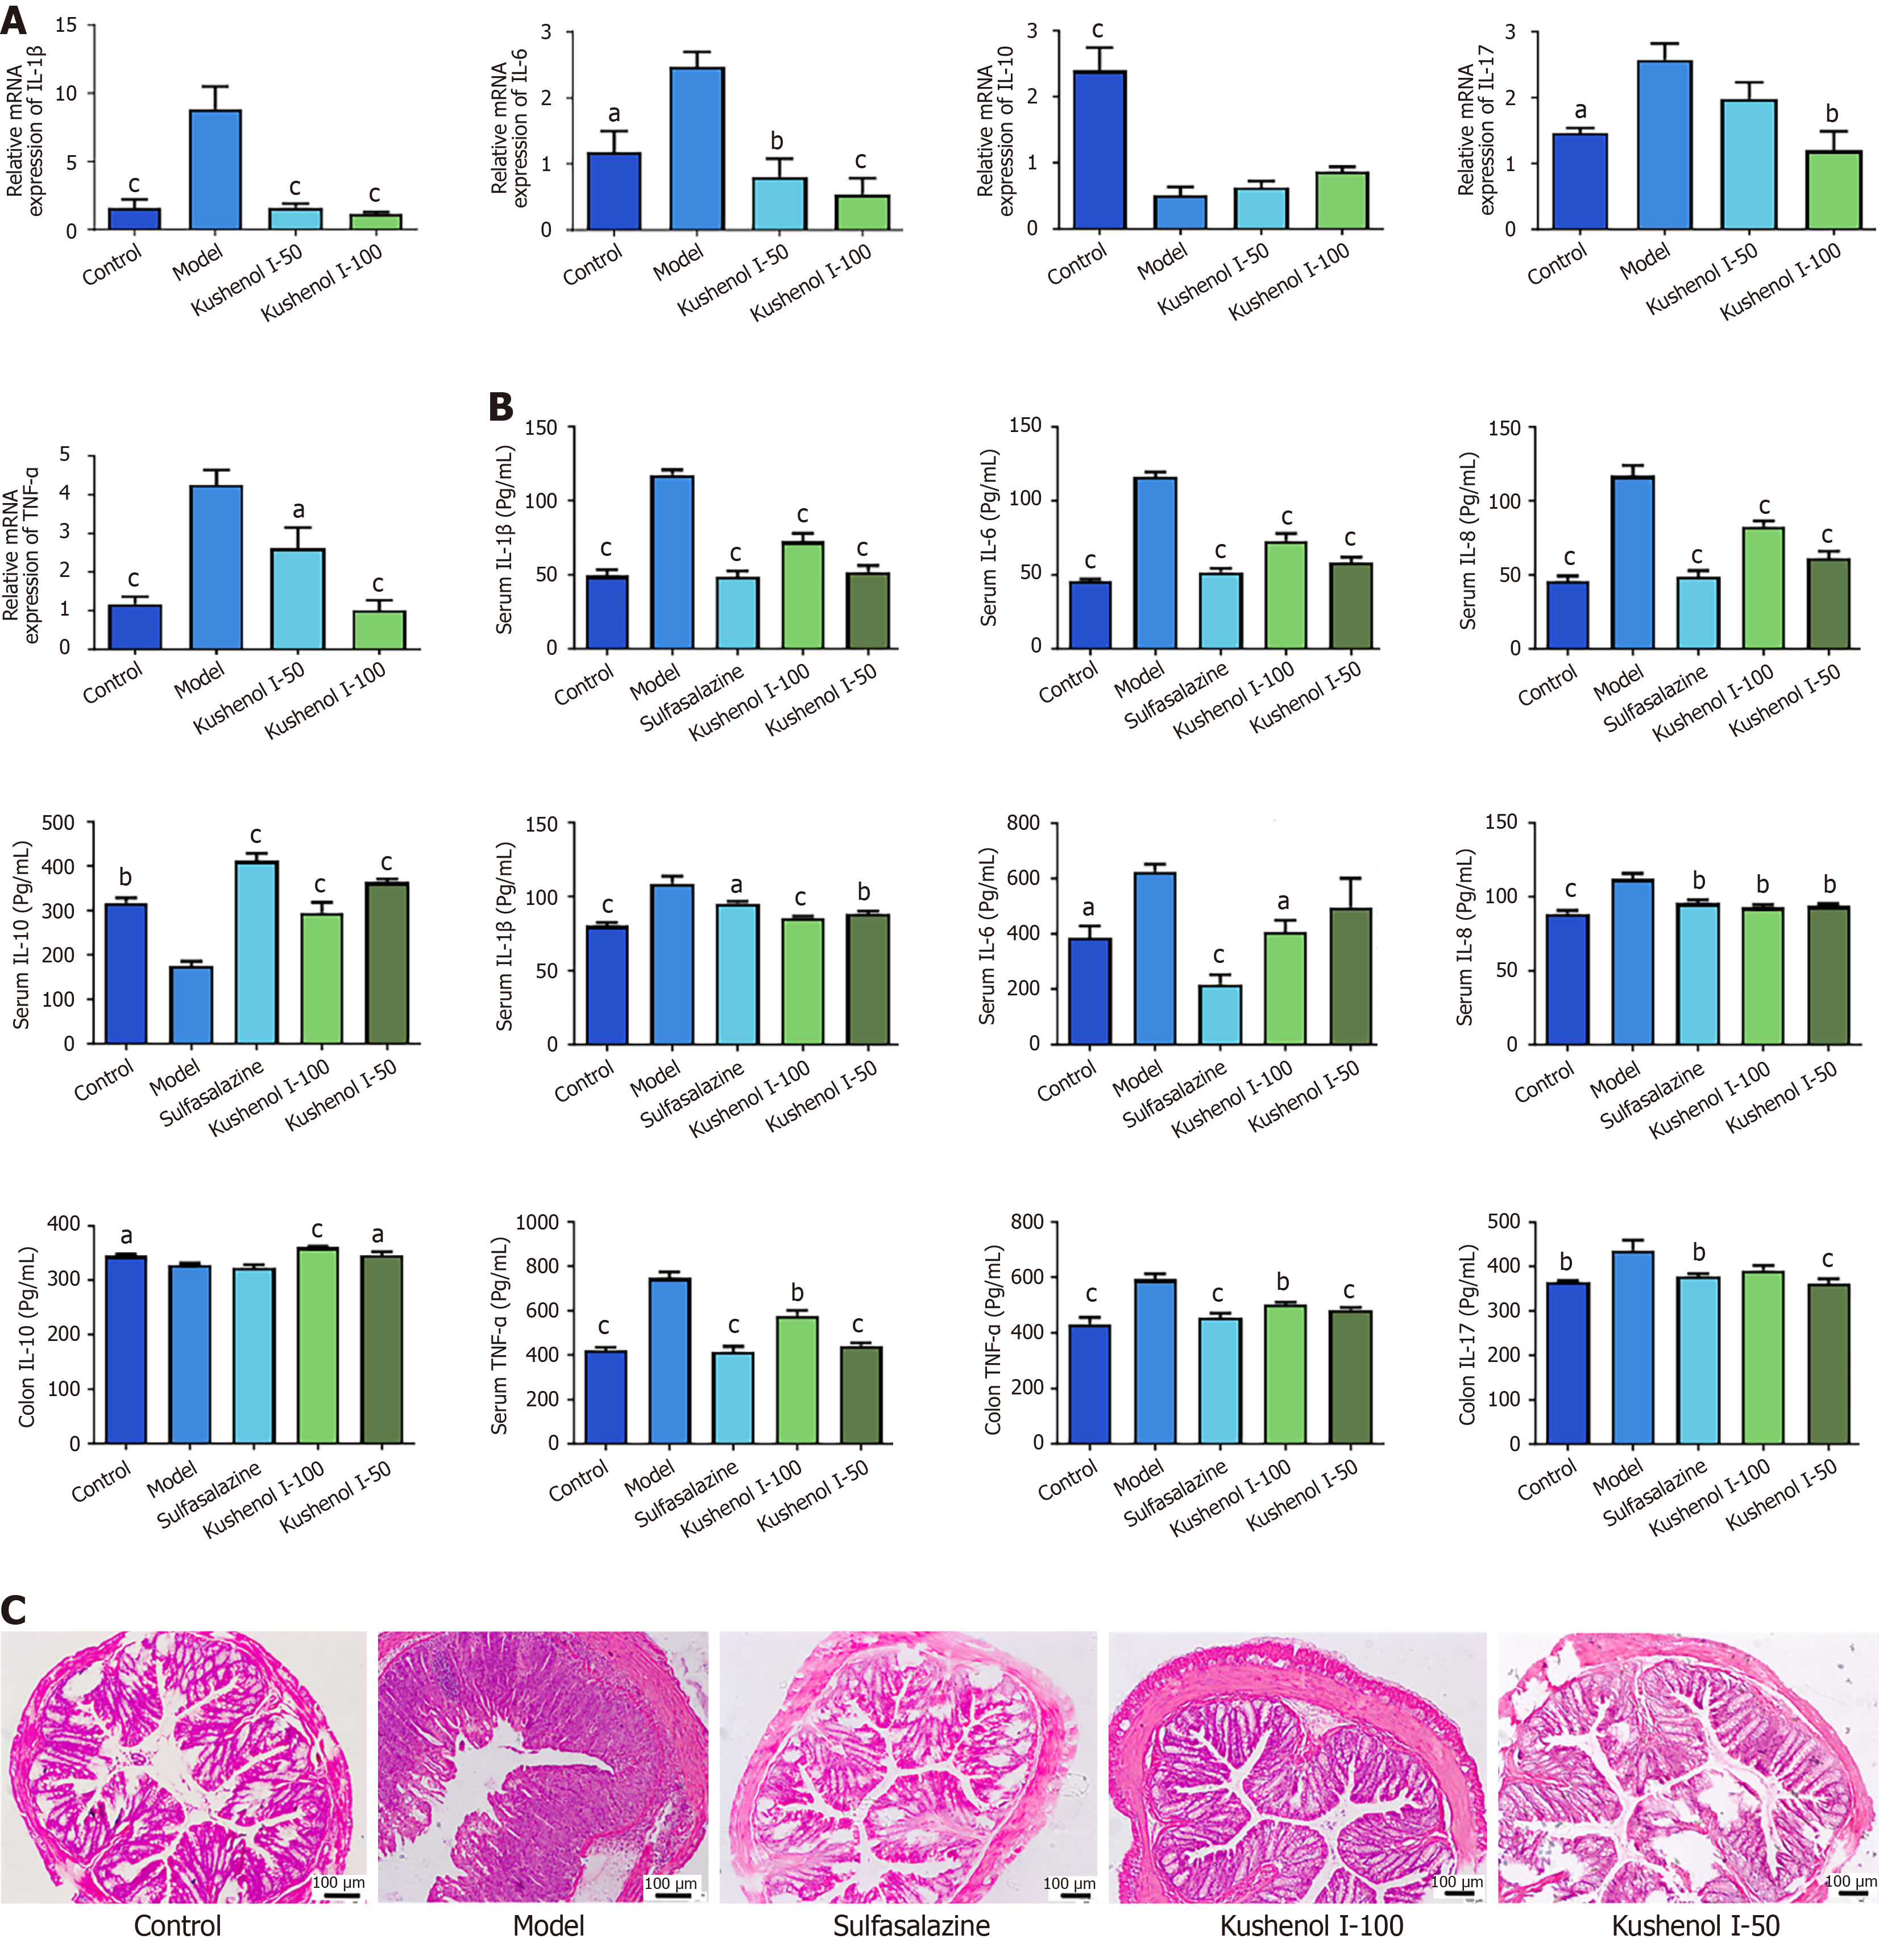
Figure 5 Effects of kushenol I on mRNA levels and the secretion of inflammatory cytokines, and histopathological damage in mice with ulcerative colitis.
A: mRNA levels of tumor necrosis factor alpha (TNF-α), interleukin 6 (IL-6), IL-1β, IL-17, and IL-10; B: Serum and colon levels of TNF-α, IL-6, IL-1β, IL-8, and IL-10, and the colon level of IL-17; C: Histological analysis of colonic tissue (scale bar = 100 μm). Values are expressed as the mean ± SD (n = 6). aP < 0.05. bP < 0.01. cP < 0.001. P compared with the model group.
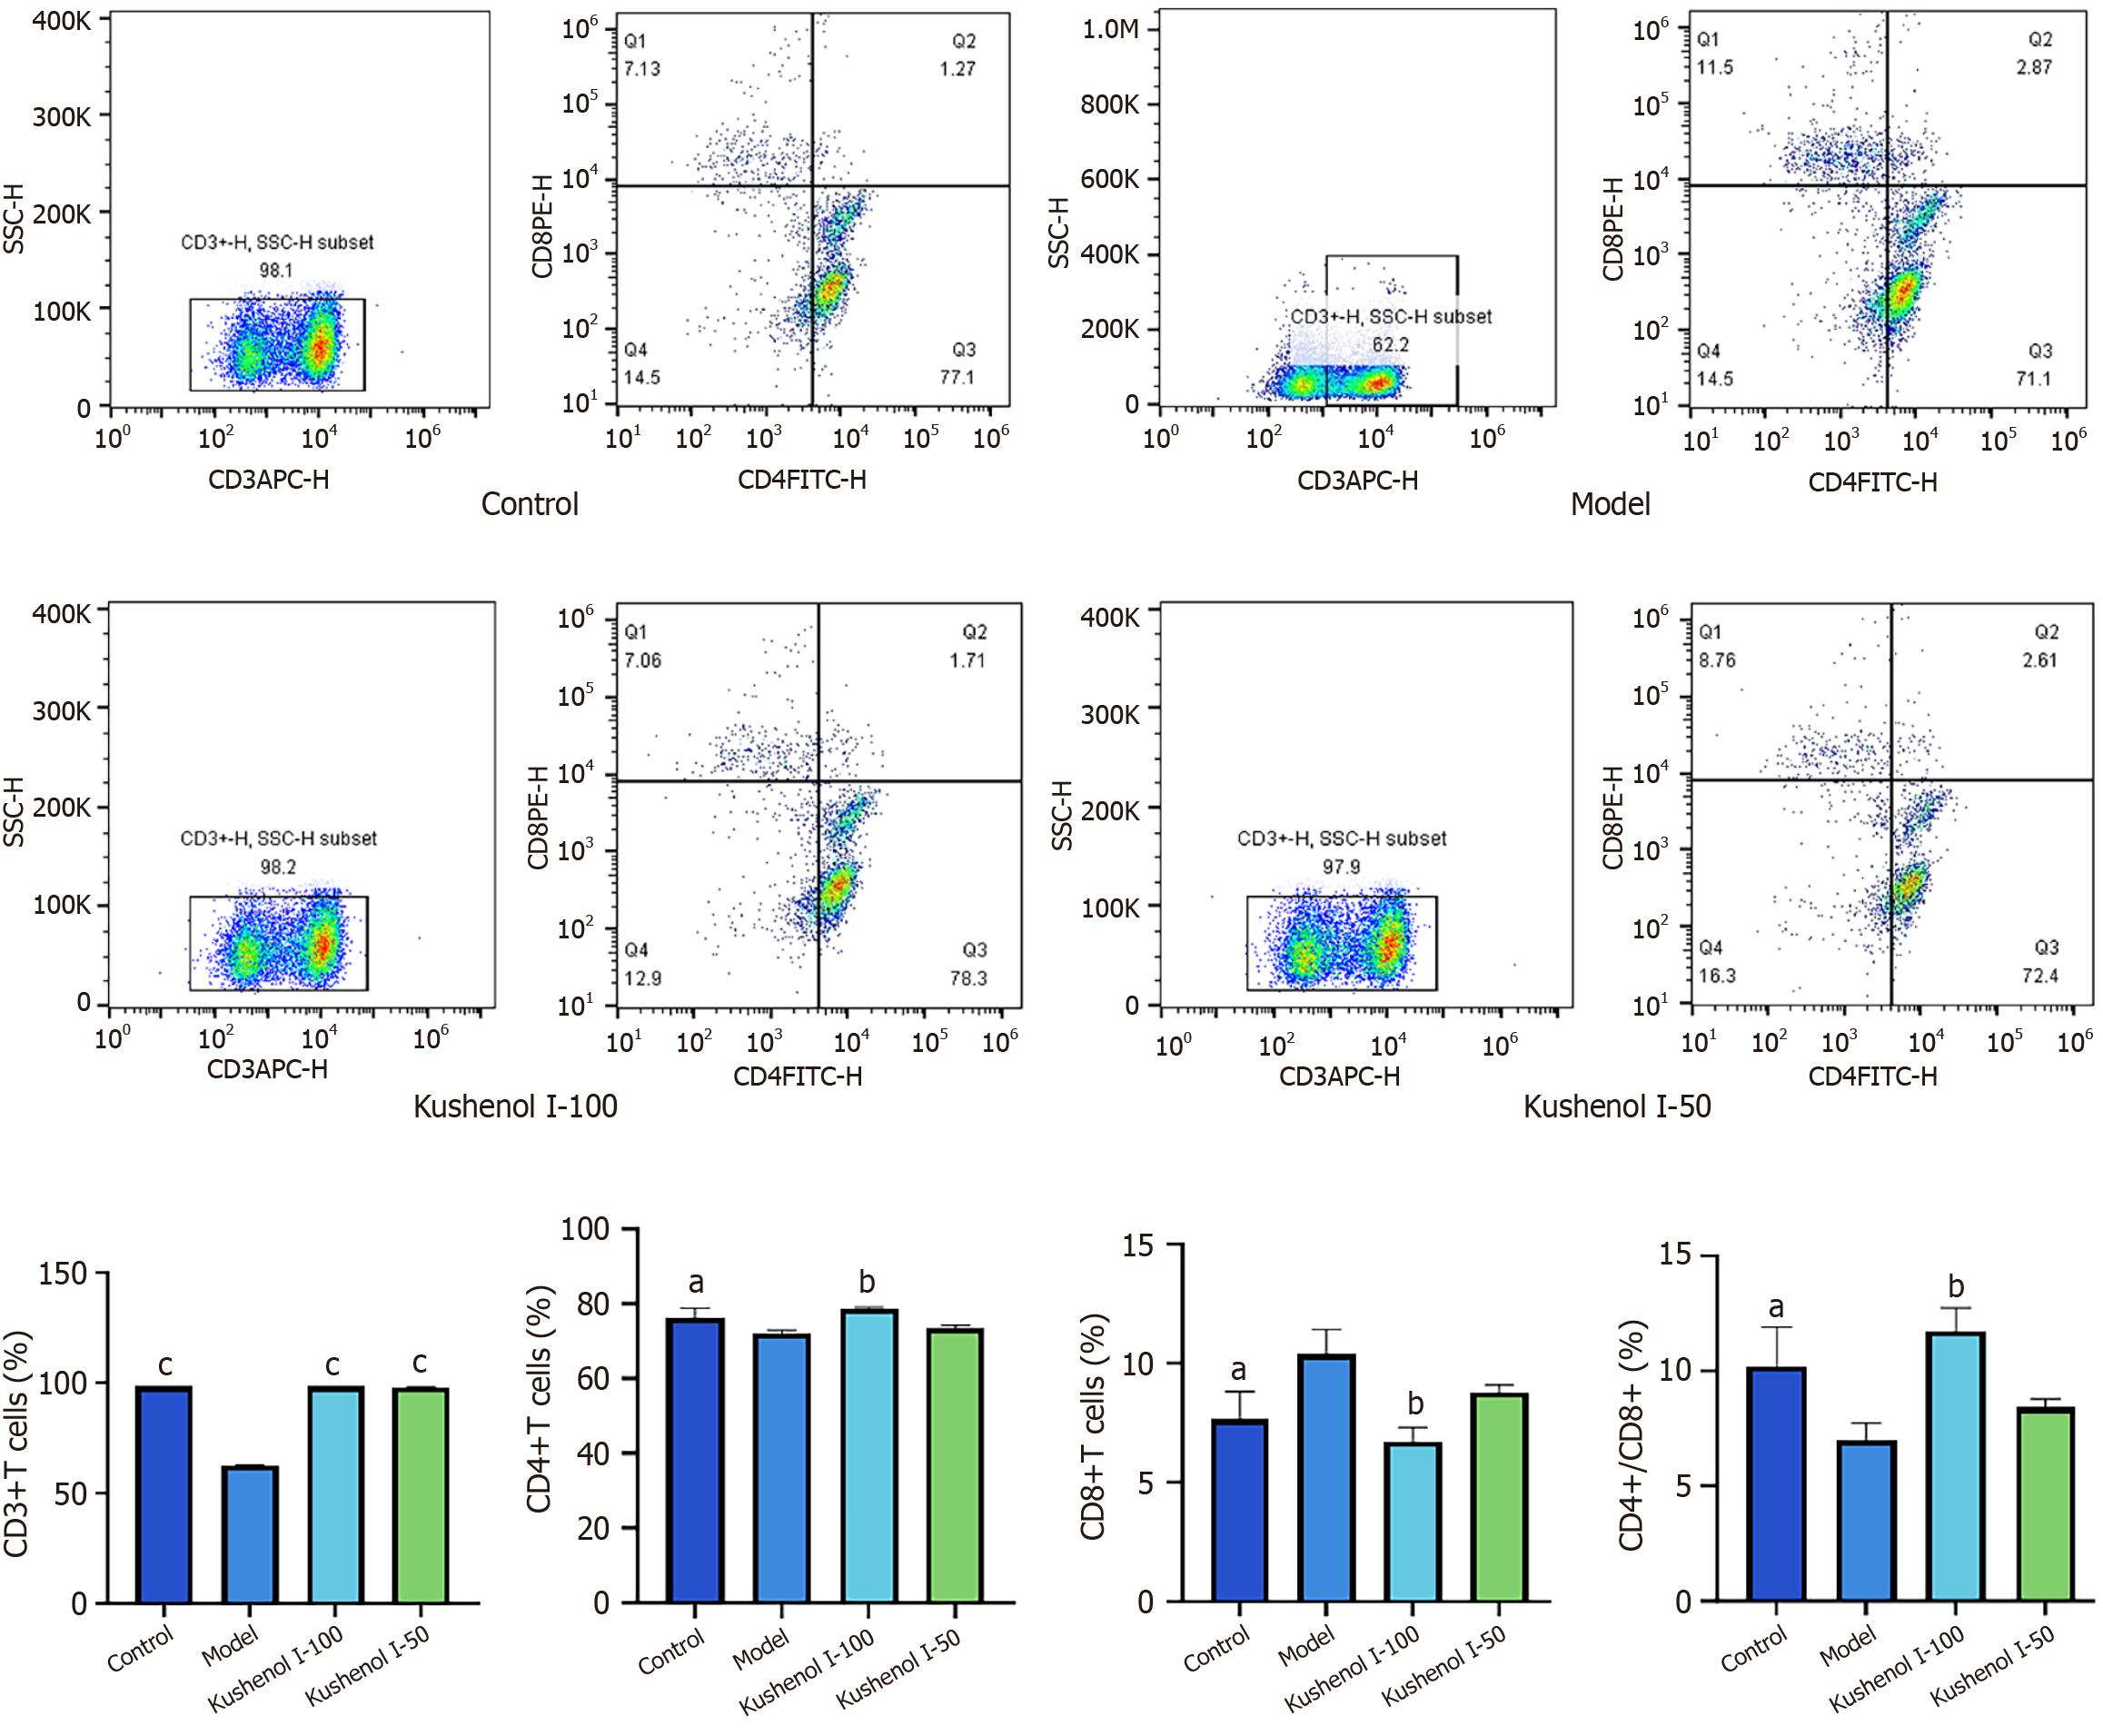
Figure 6 Effects of kushenol I on cluster of differentiation 3-positive (CD3+), cluster of differentiation 4-positive (CD4+), and cluster of differentiation 8-positive (CD8+) T-cell subpopulations, and the CD4+/CD8+ ratio in the spleens of mice with ulcerative colitis.
Values are presented as the mean ± standard error of the mean (n = 3). aP < 0.05. bP < 0.01. cP < 0.001. P compared with the model group. APC-H: Allophycocyanin-height; CD: Cluster of differentiation; FITC-H: Fluorescein isothiocyanate-height; PE-H: Phycoerythrin-height; SSC-H: Side scatter height.
Figure 7 Effects of kushenol I on colonic oxidative stress in mice with ulcerative colitis.
Values are expressed as the mean ± standard error of the mean (n = 6). aP < 0.05. bP < 0.01. cP < 0.001. P compared with the model group. GSH-PX: Glutathione peroxidase; MDA: Malondialdehyde; MPO: Myeloperoxidase; SOD: Superoxide dismutase.
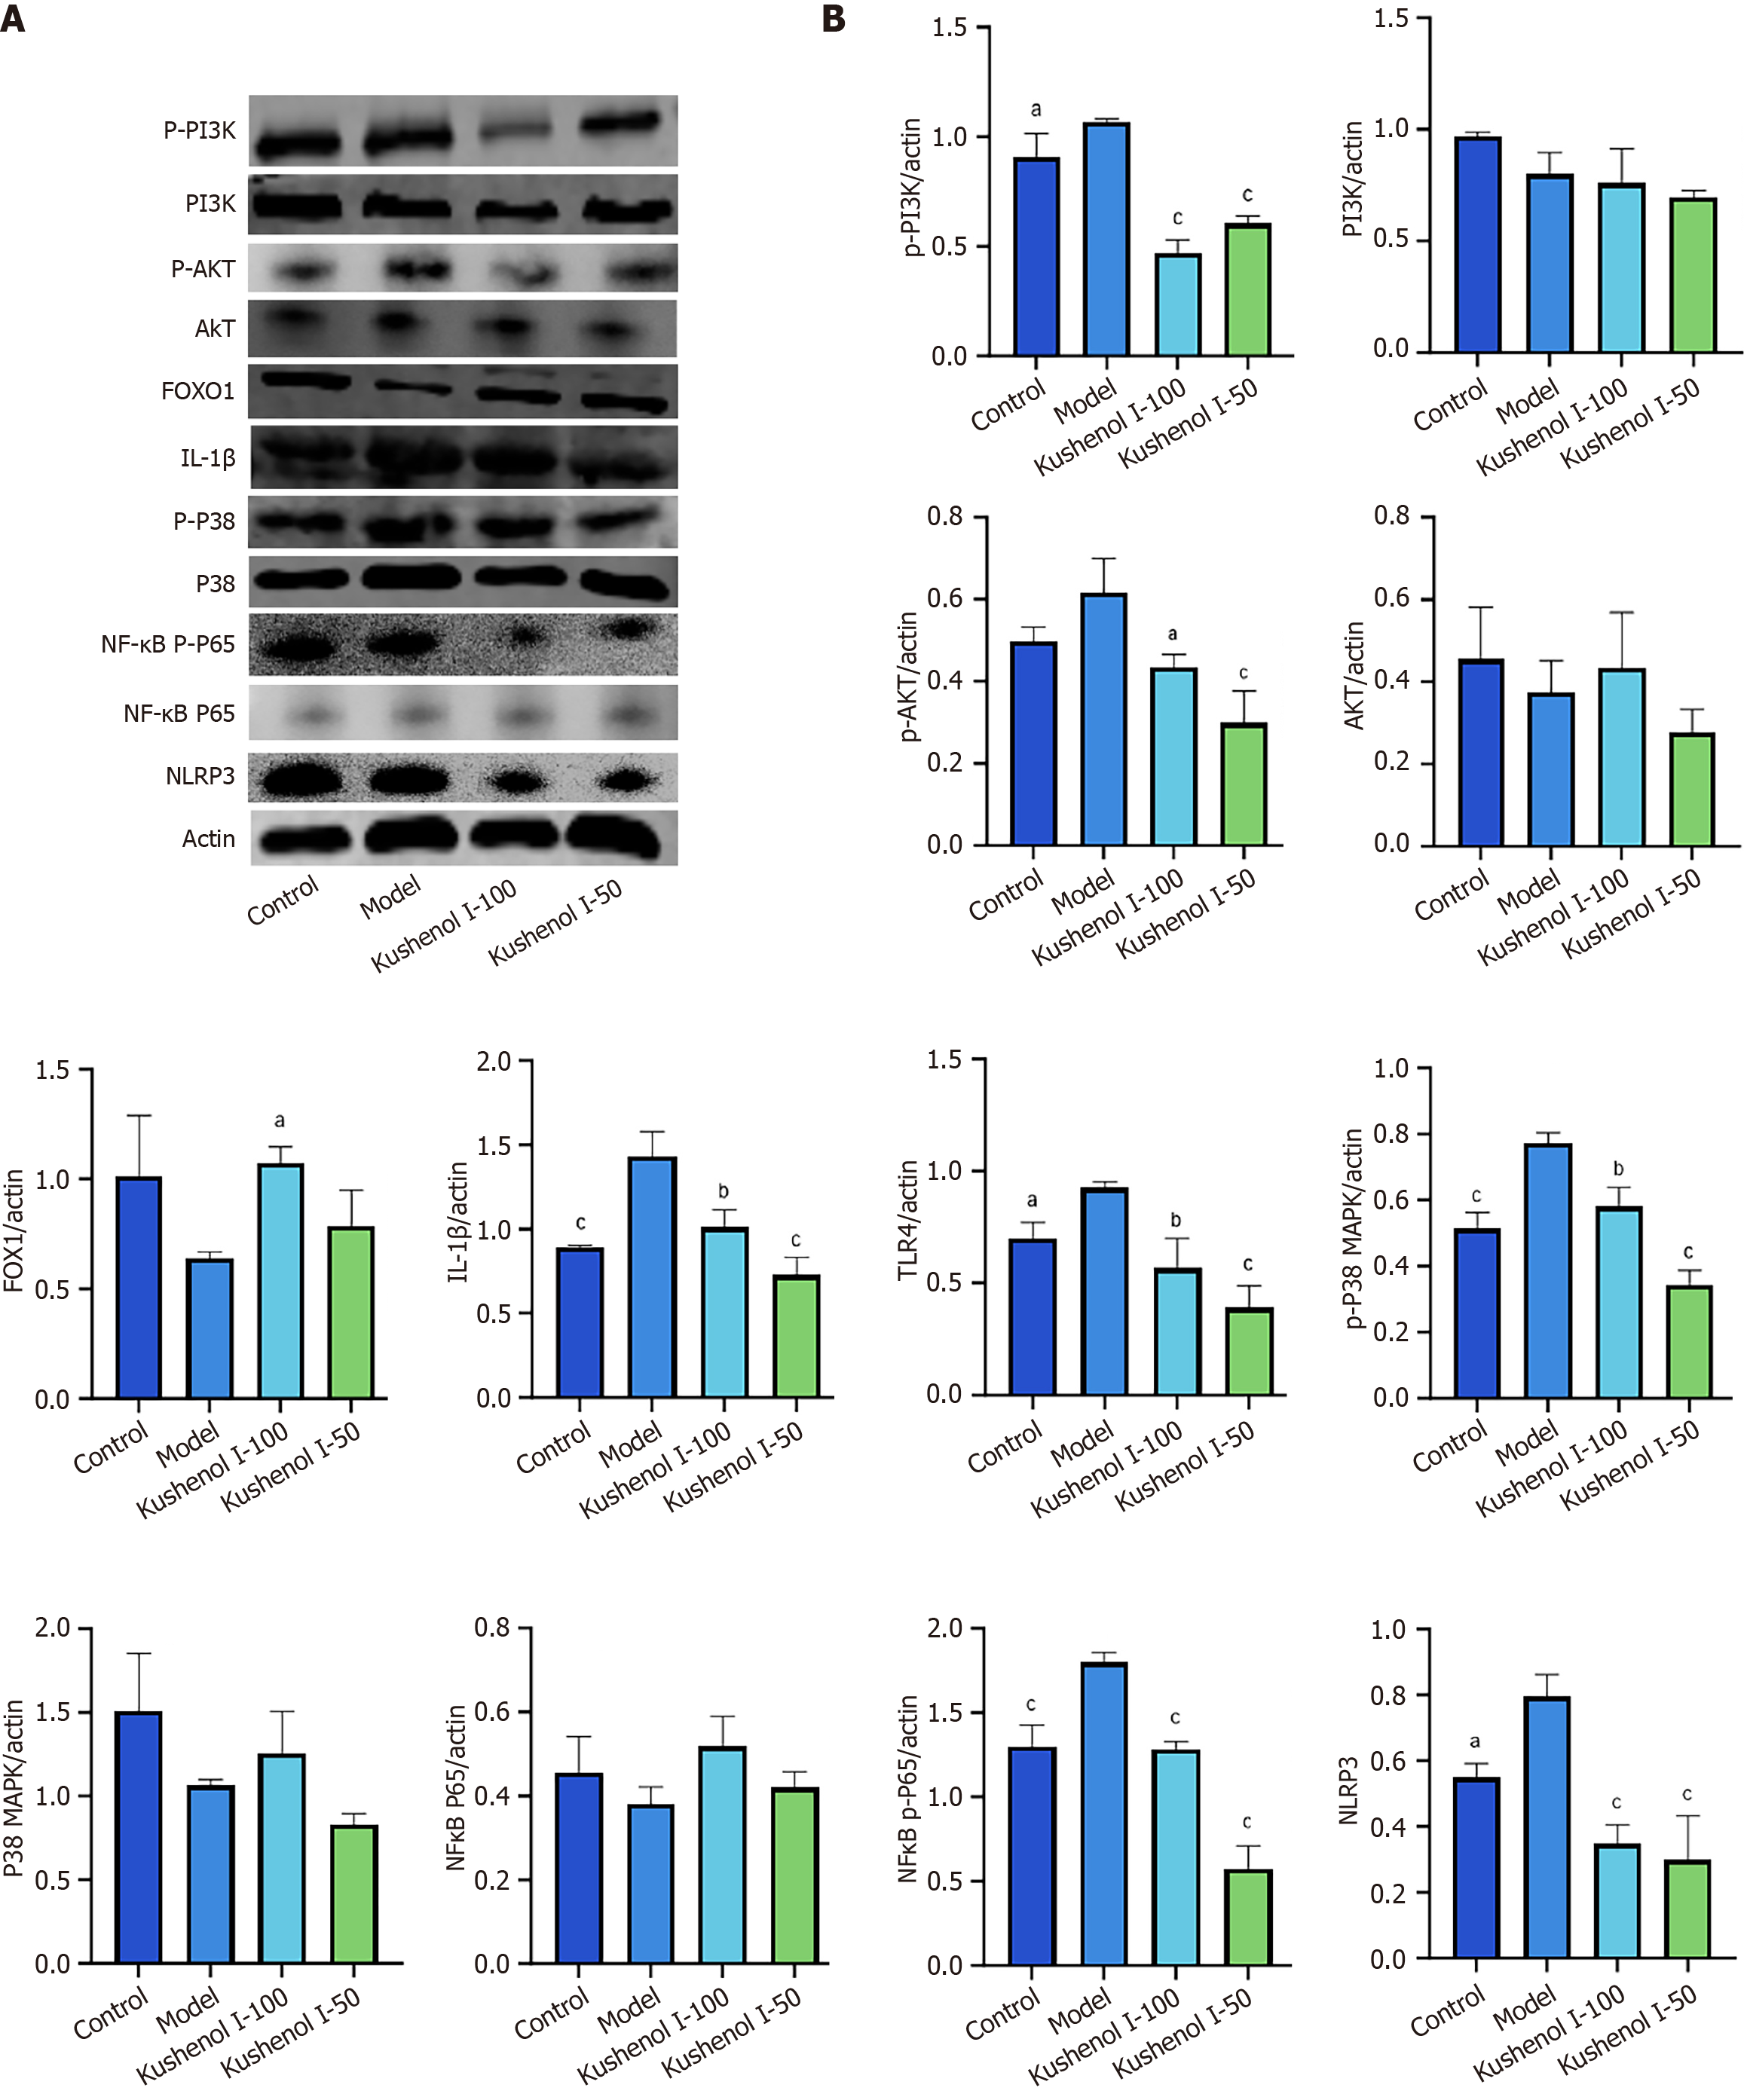
Figure 8 Effects of kushenol I on the expression of inflammation-related proteins phosphorylated phosphoinositide 3-kinase (PI3K), PI3K, phosphorylated protein kinase B (AKT), AKT, forkhead box O1, interleukin 1β, Toll-like receptor 4, phosphorylated p38 mitogen-activated protein kinase (MAPK), p38 MAPK, nuclear factor kappa B phosphorylated p65, nuclear factor kappa B p65, and NOD-like receptor thermal protein domain associated protein 3 in the colonic tissues of mice with ulcerative colitis.
A: Image of a gel showing protein expression; B: Bar graph depicting protein expression. Values are presented as the mean ± standard error of the mean (n = 3). aP < 0.05. bP < 0.01. cP < 0.001. P compared with the model group. AKT: Protein kinase B; FOXO1: Forkhead box O1; IL-1β: Interleukin 1β; PI3K: Phosphoinositide 3-kinase; p-p38: Phosphorylated p38; p38 MAPK: p38 mitogen-activated protein kinase; p-p65: Phosphorylated p65; p-PI3K: Phosphorylated phosphoinositide 3-kinase; p-AKT: Phosphorylated protein kinase B; NF-κB: Nuclear factor kappa B; NLRP3: NOD-like receptor thermal protein domain associated protein 3; TLR4: Toll-like receptor 4.
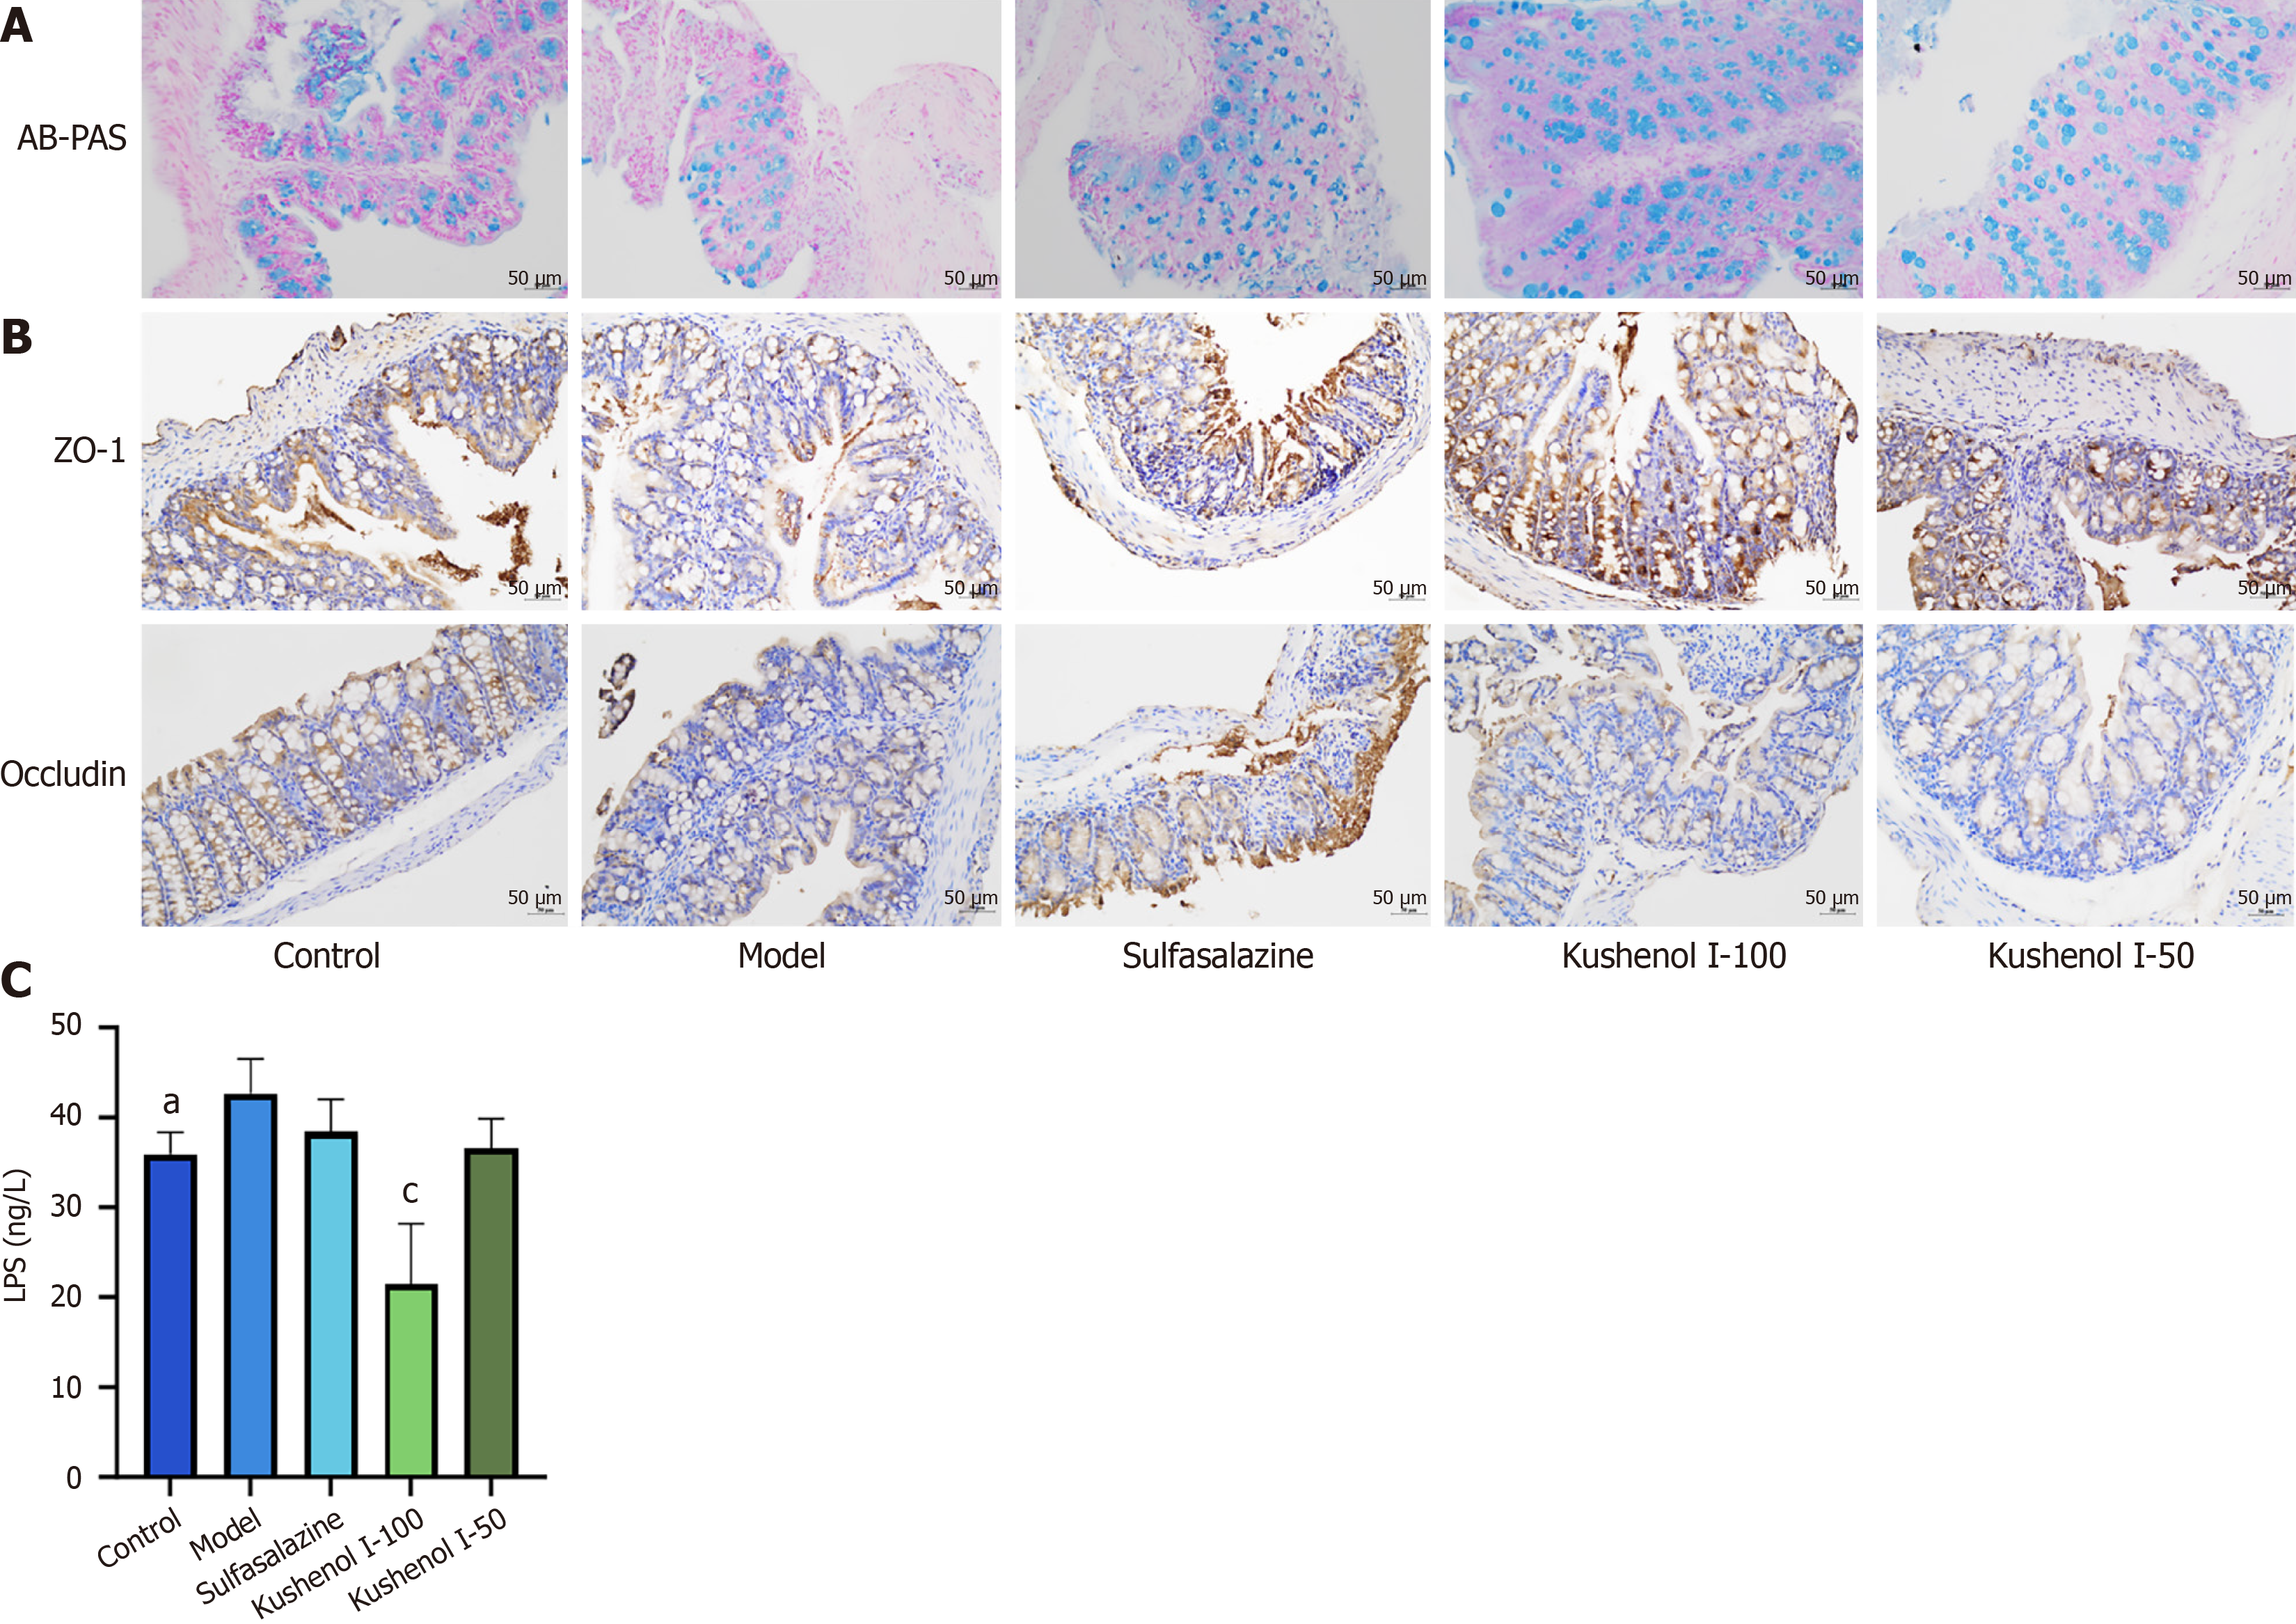
Figure 9 Effects of kushenol I on intestinal barrier integrity and serum lipopolysaccharide levels in mice with ulcerative colitis.
A: Alcian blue and periodic acid-Schiff (AB-PAS) staining were used to evaluate the impact of kushenol I (KSCI) on colonic barrier integrity (scale bar = 50 μm); B: Immunohistochemical analysis to assess the effects of KSCI intervention on the expression of the tight junction proteins occludin and zonula occludens-1 (ZO-1) (scale bar = 50 μm); C: Enzyme-linked immunosorbent assay kits were used to determine the influence of KSCI intervention on serum lipopolysaccharide (LPS) levels. Values are presented as the mean ± standard error of the mean (n = 6). aP < 0.05. cP < 0.001. P compared with the model group.
Figure 10 Effects of kushenol I on gut microbial diversity and structure in the feces of mice with ulcerative colitis.
A: Boxplot illustrating grouped alpha diversity indices; B: Principal component analysis at the operational taxonomic unit (OUT) level; C: Venn diagram illustrating the analysis of sample communities; D: Taxonomic profiles at the phylum level; E: Taxonomic profiles at the genus level; F: Histogram presenting linear discriminant analysis (LDA) scores. Values are presented as the mean ± standard error of the mean (n = 6). NMDS: Non-metric multidimensional scaling.
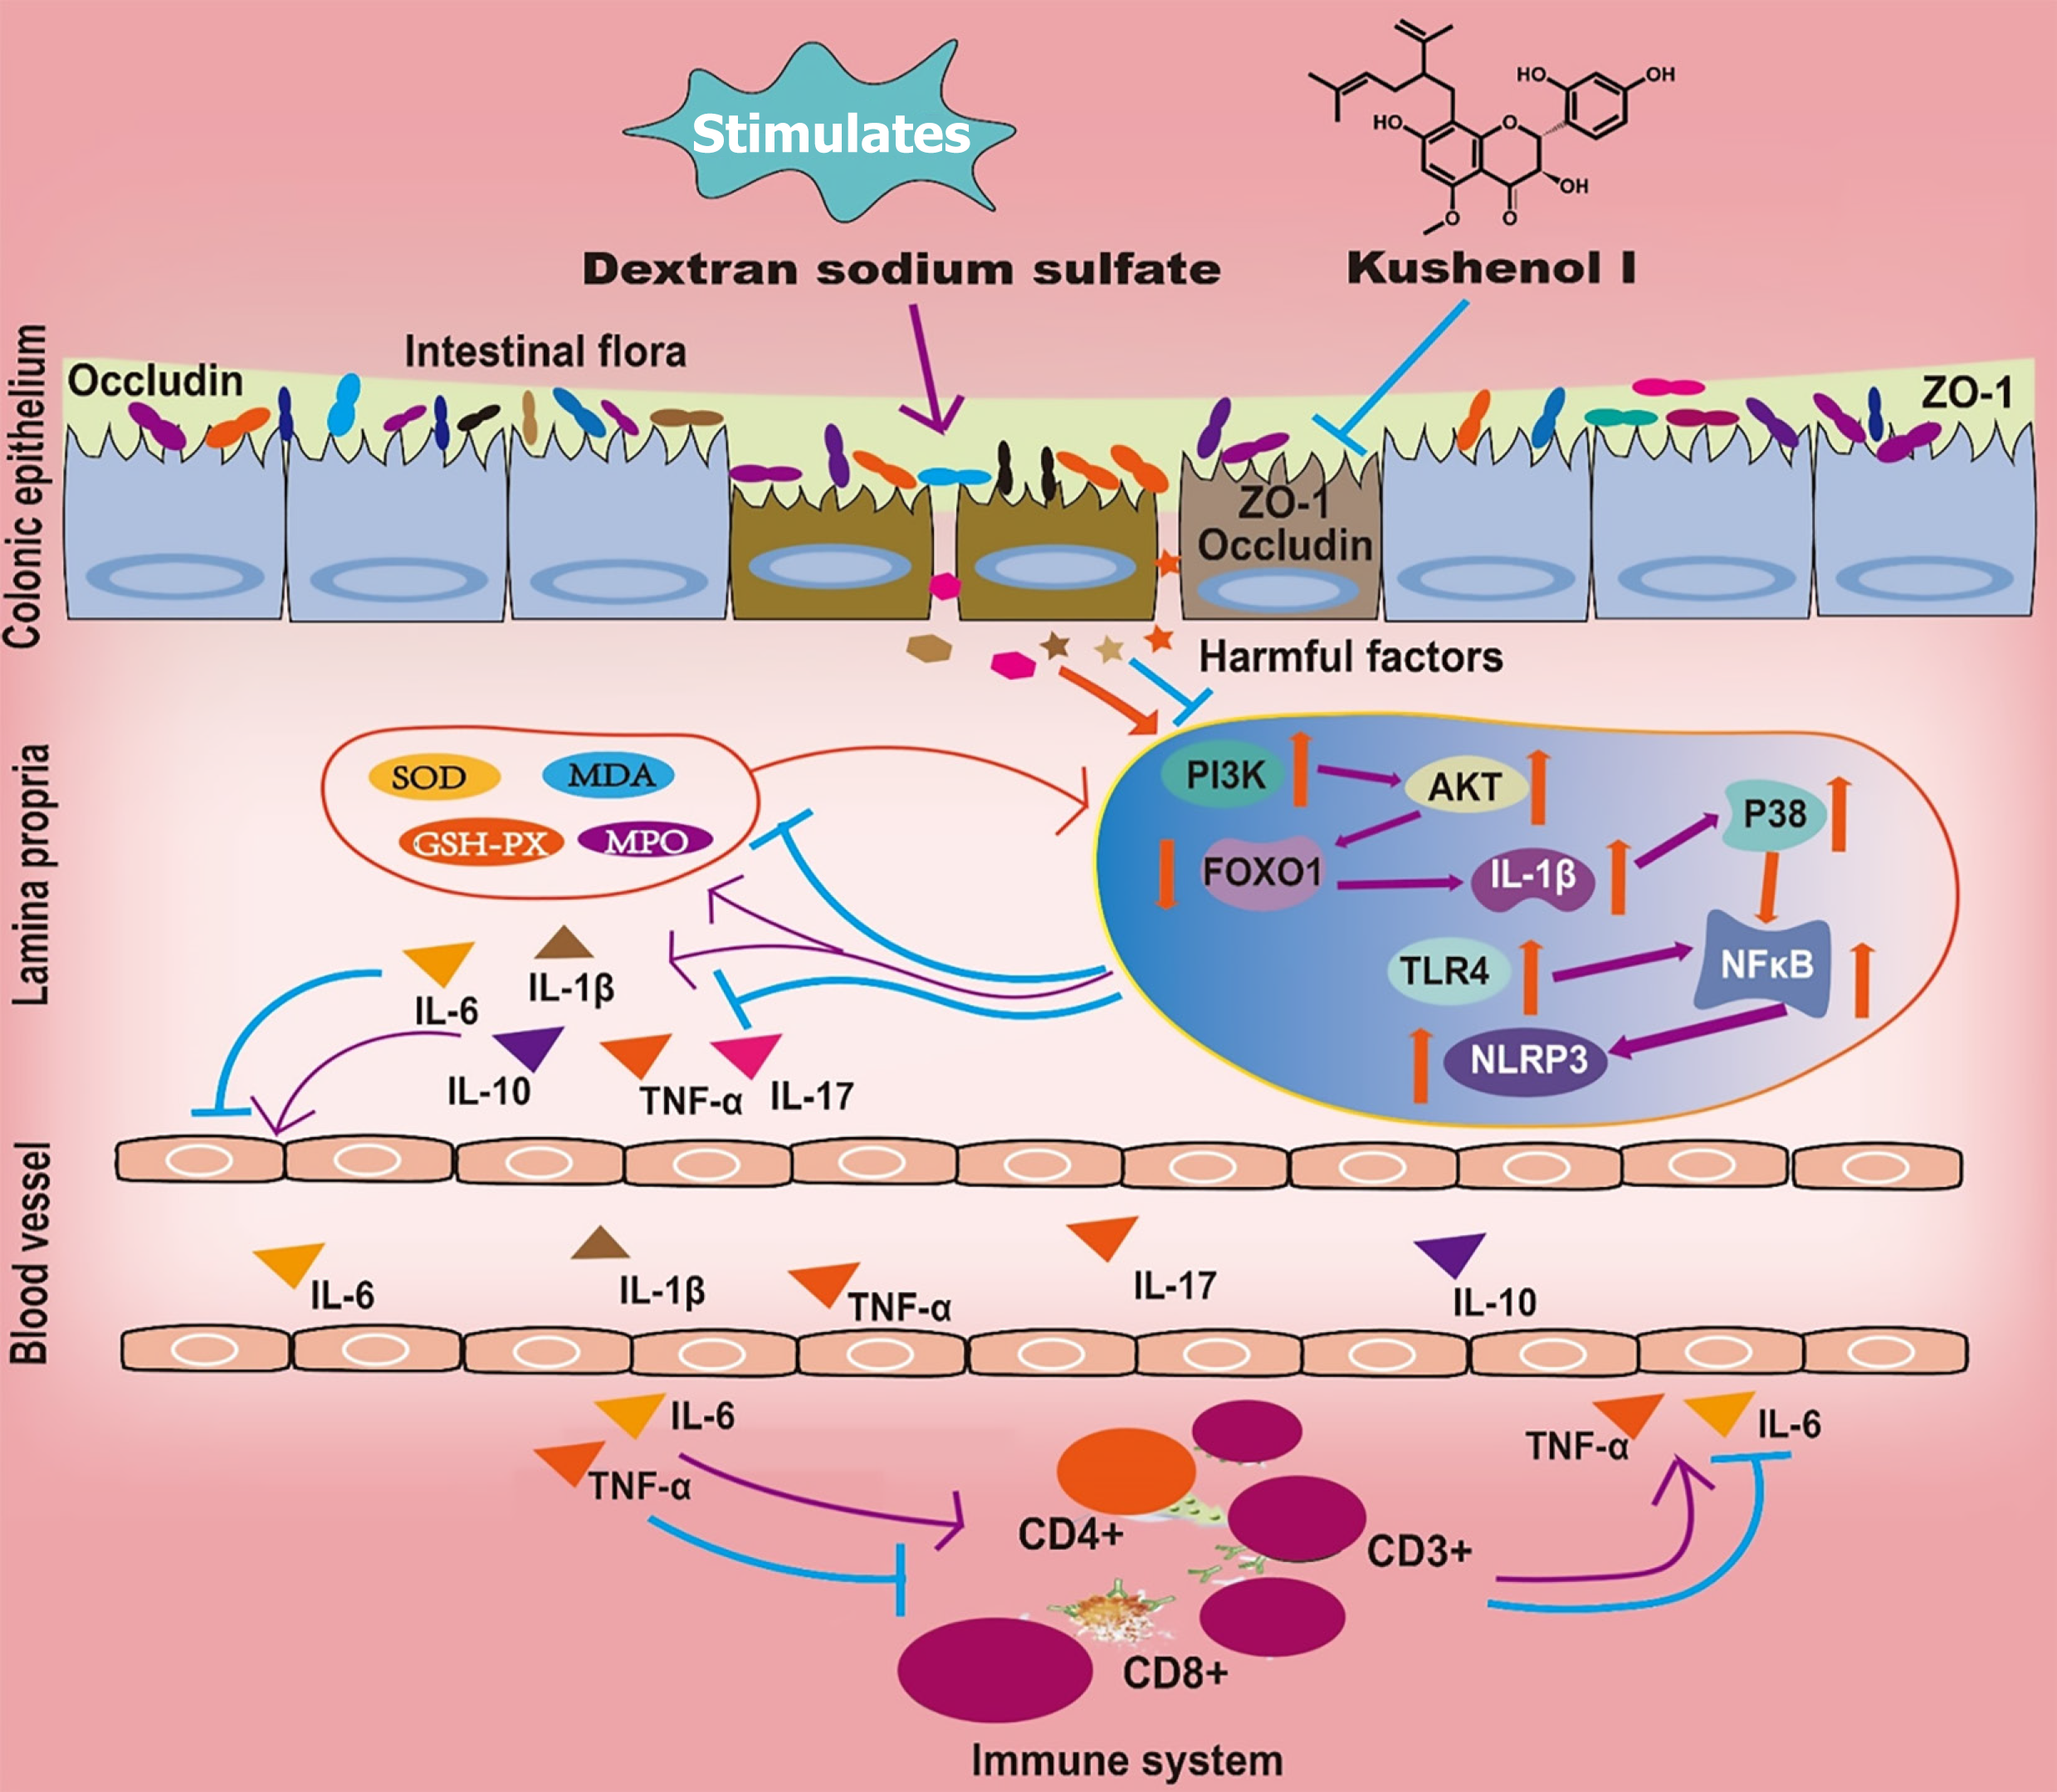
Figure 11 Kushenol I preserves the intestinal barrier and optimizes gut microbiota to combat ulcerative colitis.
AKT: Protein kinase B; CD: Cluster of differentiation; FOXO1: Forkhead box O1; GSH-PX: Glutathione peroxidase; IL: Interleukin; MDA: Malondialdehyde; MPO: Myeloperoxidase; NF-κB: Nuclear factor kappa B; NLRP3: NOD-like receptor thermal protein domain associated protein 3; PI3K: Phosphoinositide 3-kinase; SOD: Superoxide dismutase; TNF: Tumor necrosis factor; TLR4: Toll-like receptor 4; ZO-1: Zonula occludens-1.
- Citation: He XD, Li M, Zuo XD, Ni HY, Han YX, Hu YK, Yu J, Yang XX. Kushenol I combats ulcerative colitis via intestinal barrier preservation and gut microbiota optimization. World J Gastroenterol 2025; 31(26): 105656
- URL: https://www.wjgnet.com/1007-9327/full/v31/i26/105656.htm
- DOI: https://dx.doi.org/10.3748/wjg.v31.i26.105656


