Copyright
©The Author(s) 2025.
World J Gastroenterol. Jul 7, 2025; 31(25): 107893
Published online Jul 7, 2025. doi: 10.3748/wjg.v31.i25.107893
Published online Jul 7, 2025. doi: 10.3748/wjg.v31.i25.107893
Figure 1 Colorectal cancer differentially expressed gene analysis.
A: Sample gene expression heterogeneity (heatmap); B: Genome-wide expression changes (volcano plot); C: Representative differentially expressed gene (DEG) expression distribution (heatmap); D: DEG statistical significance with key genes; E: Common DEGs between GSE41328 and GSE23878; F: Core gene interactions [streamlined protein-protein interaction (PPI)]; G: Leucine-rich repeat-containing 19 (LRRC19) overlap in transmembrane receptors and PPI network; H: Potential microRNAs/long non-coding RNAs regulating LRRC19; I: LRRC19-positively correlated genes; J: LRRC19-negatively correlated genes; K: Positive correlation gene enrichment [Kyoto Encyclopedia of Genes and Genomes (KEGG)/Gene Ontology (GO)]; L: Negative correlation gene enrichment (KEGG/GO). FTR: Functional transmembrane receptor.
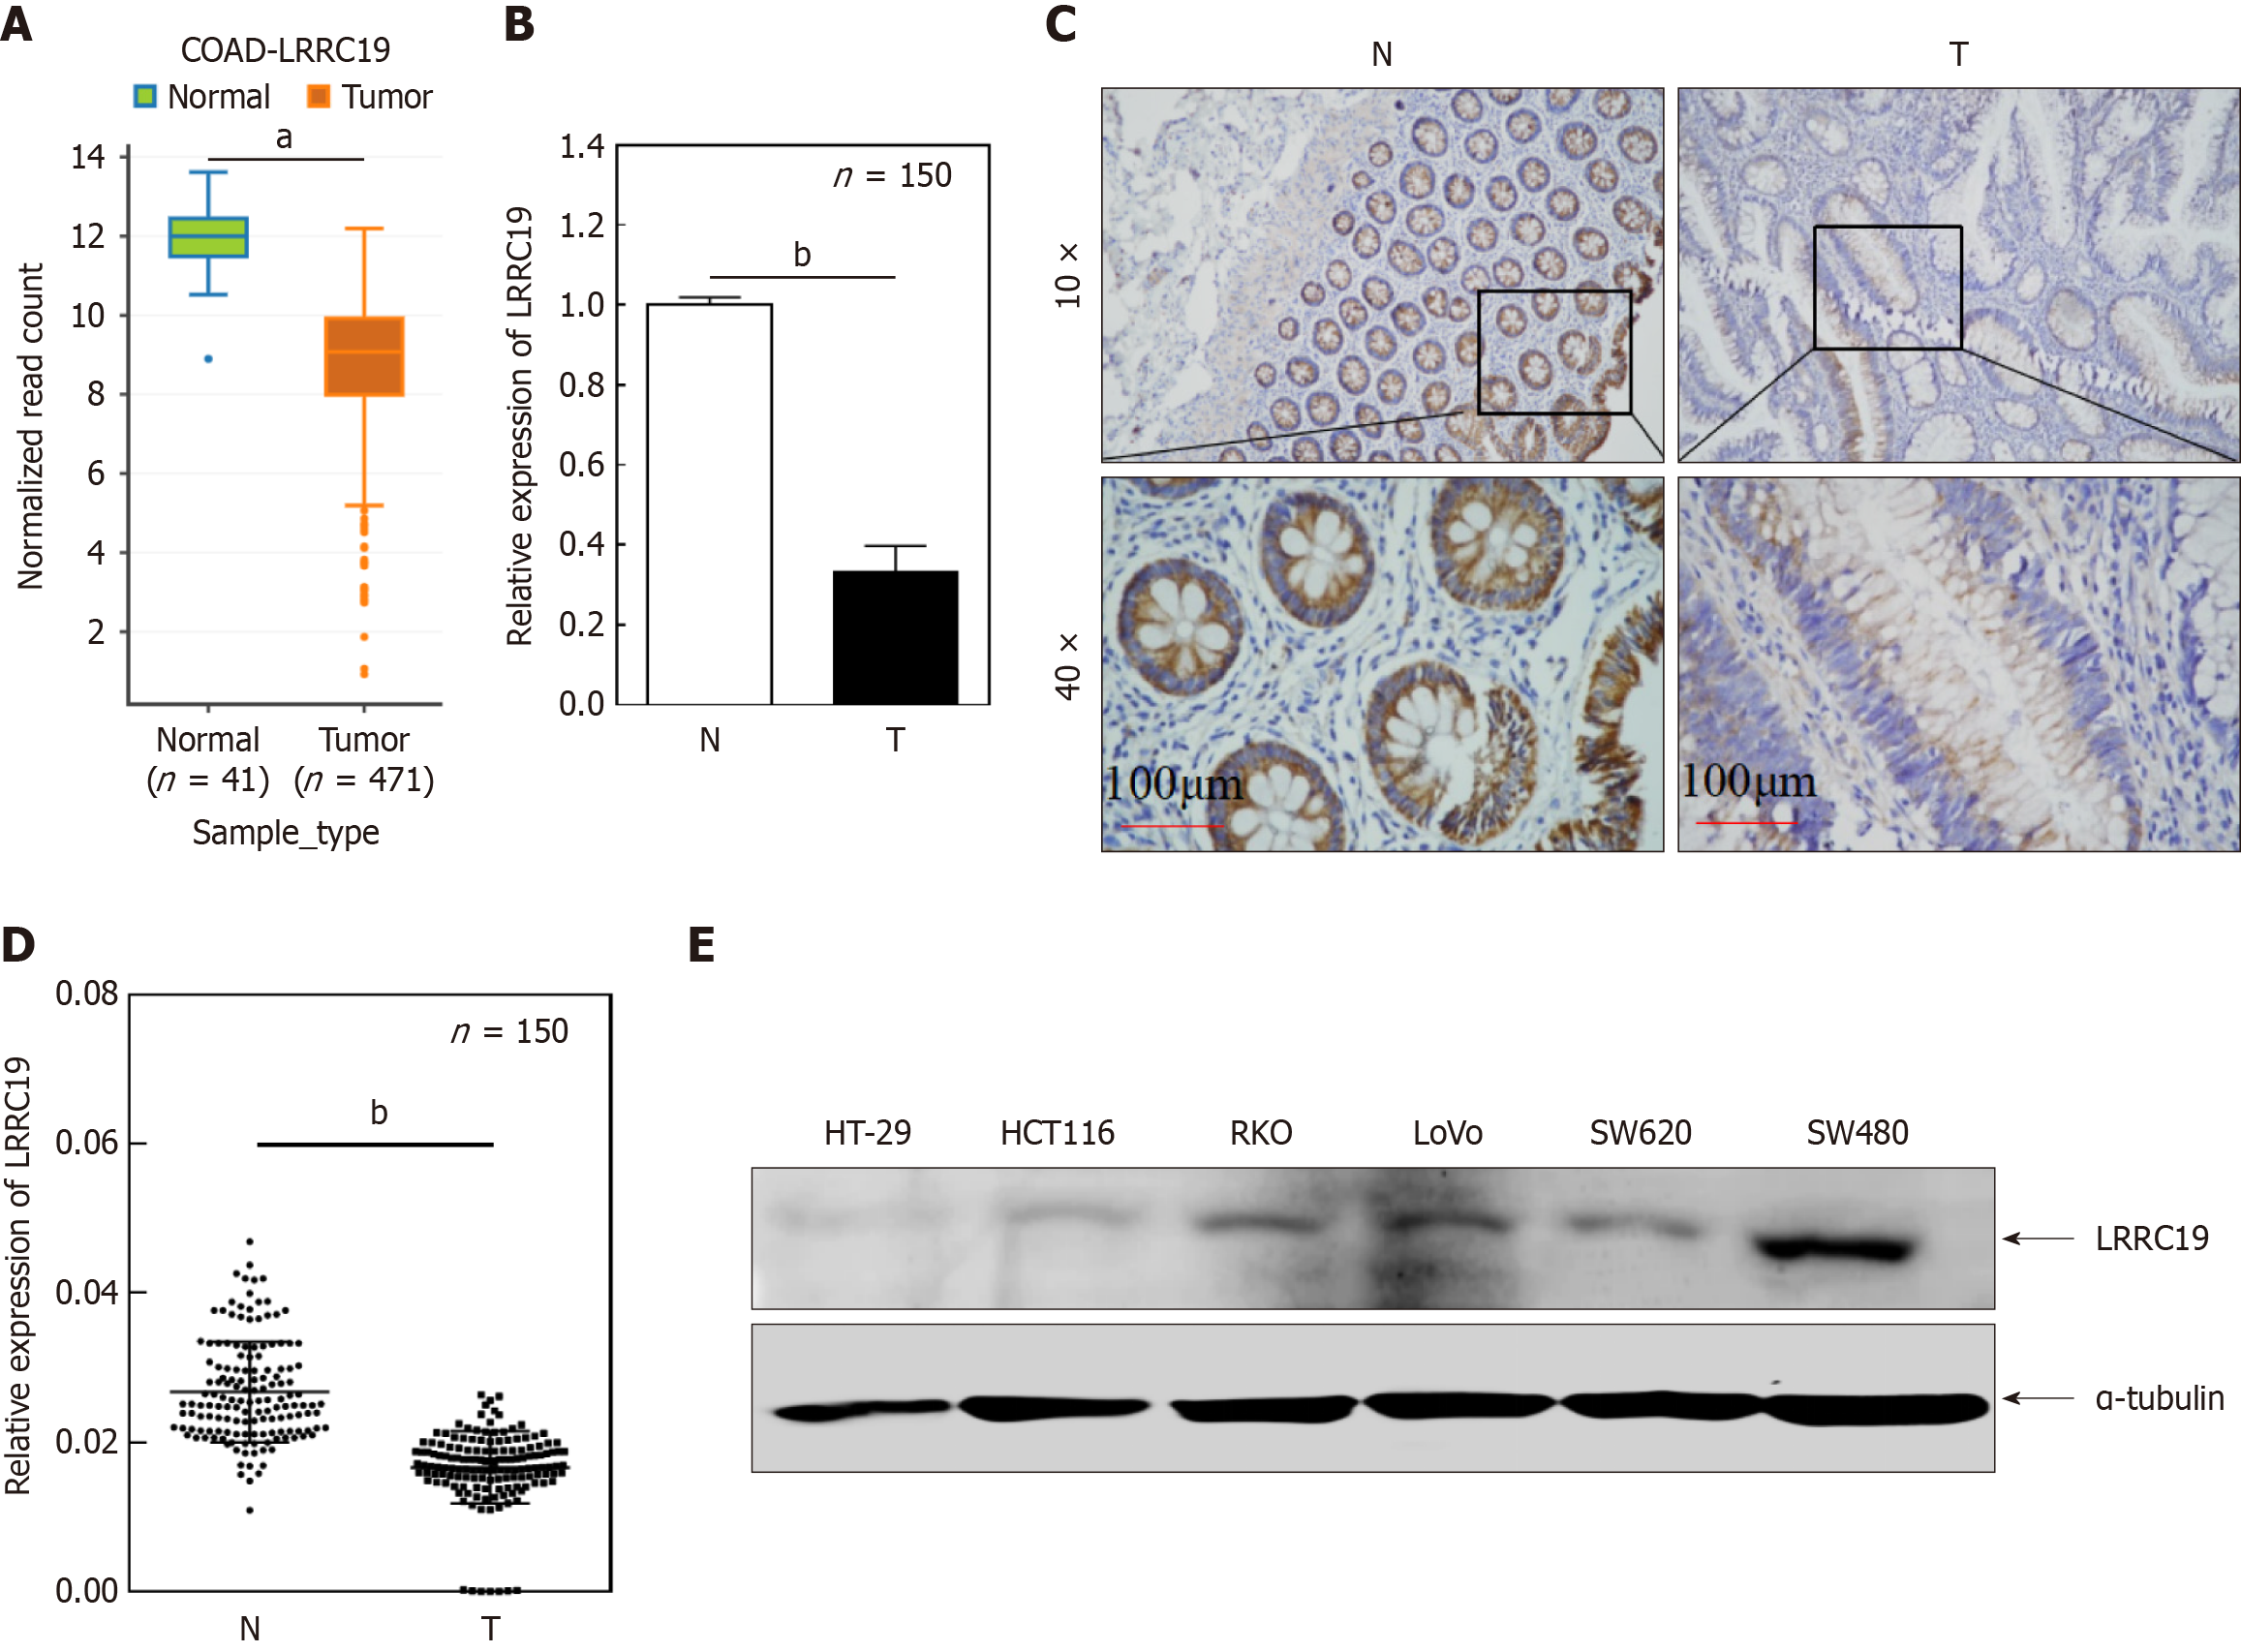
Figure 2 Leucine-rich repeat-containing 19 expression in colorectal cancer tissues and cell lines.
A: Leucine-rich repeat-containing 19 (LRRC19) expression is significantly lower in cancer tissues than in normal tissues (aP < 0.01); B: Validation in an independent clinical cohort (n = 150, bP < 0.05); C and D: Immunohistochemical results showing reduced staining in cancer tissues (bP < 0.05); E: Decreased LRRC19 expression in metastatic colorectal cancer cell lines compared to SW480 (bP < 0.05), with stable α-tubulin expression.
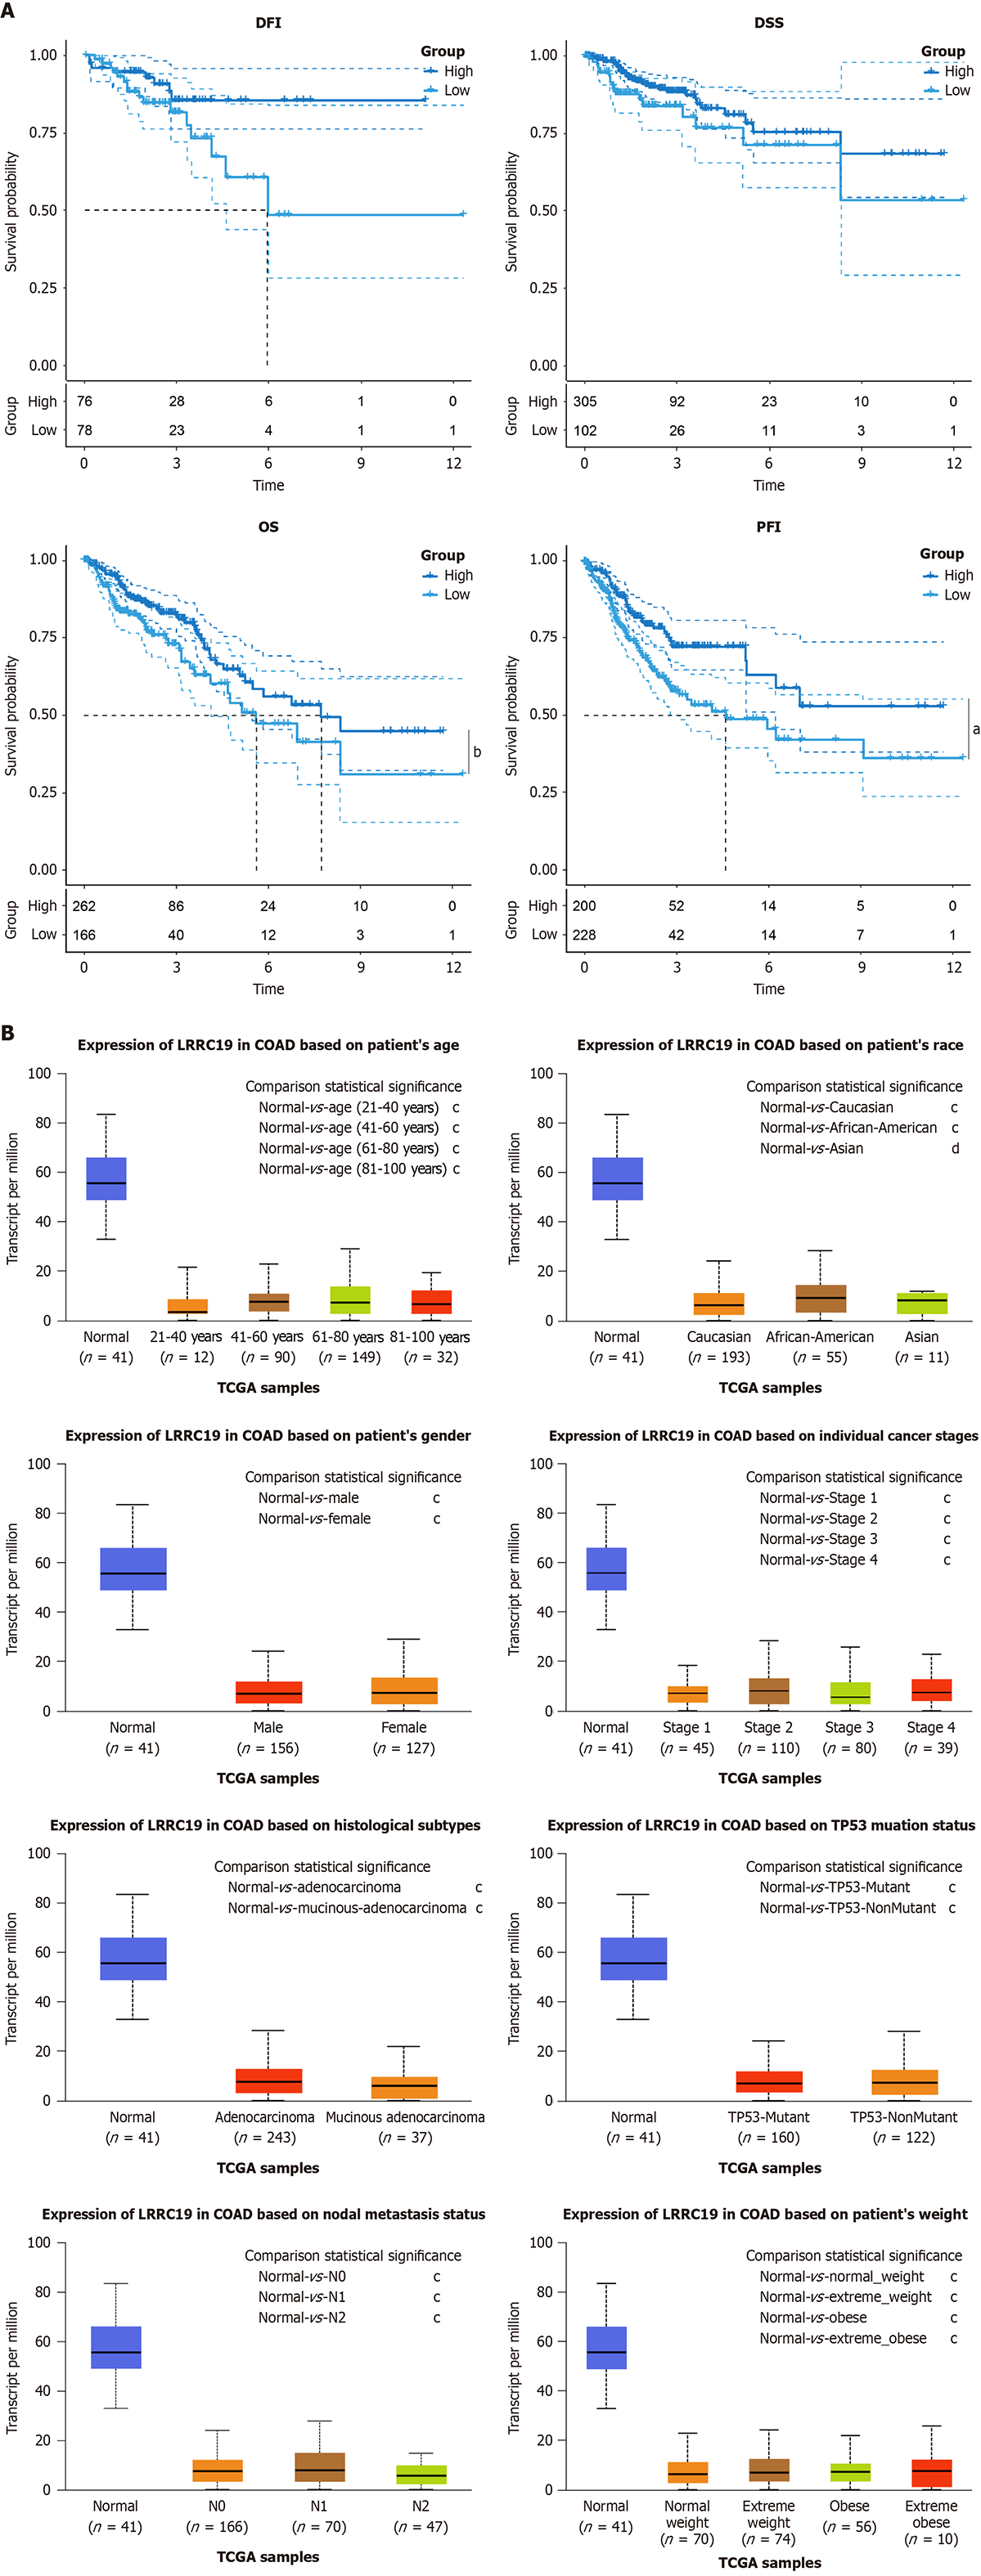
Figure 3 Leucine-rich repeat-containing 19 expression and survival outcomes in colorectal cancer.
A: Survival analysis showing no significant differences in disease-free interval (DFI) (P = 0.082) and disease-specific survival (P = 0.092) between high and low leucine-rich repeat-containing 19 (LRRC19) expression groups, but significantly reduced overall survival (OS) (bP < 0.05) and progression-free interval (aP < 0.01); B: Differential expression of LRRC19 in normal (n = 41) vs tumor tissues, with significant differences across various comparisons, including sex, pathological type, lymph node status, ethnicity, clinical stage, tumor protein p53 (TP53) mutation status, and body mass index categories (all cP < 1 × 10-12, except Asian dP < 1 × 10⁻⁷).
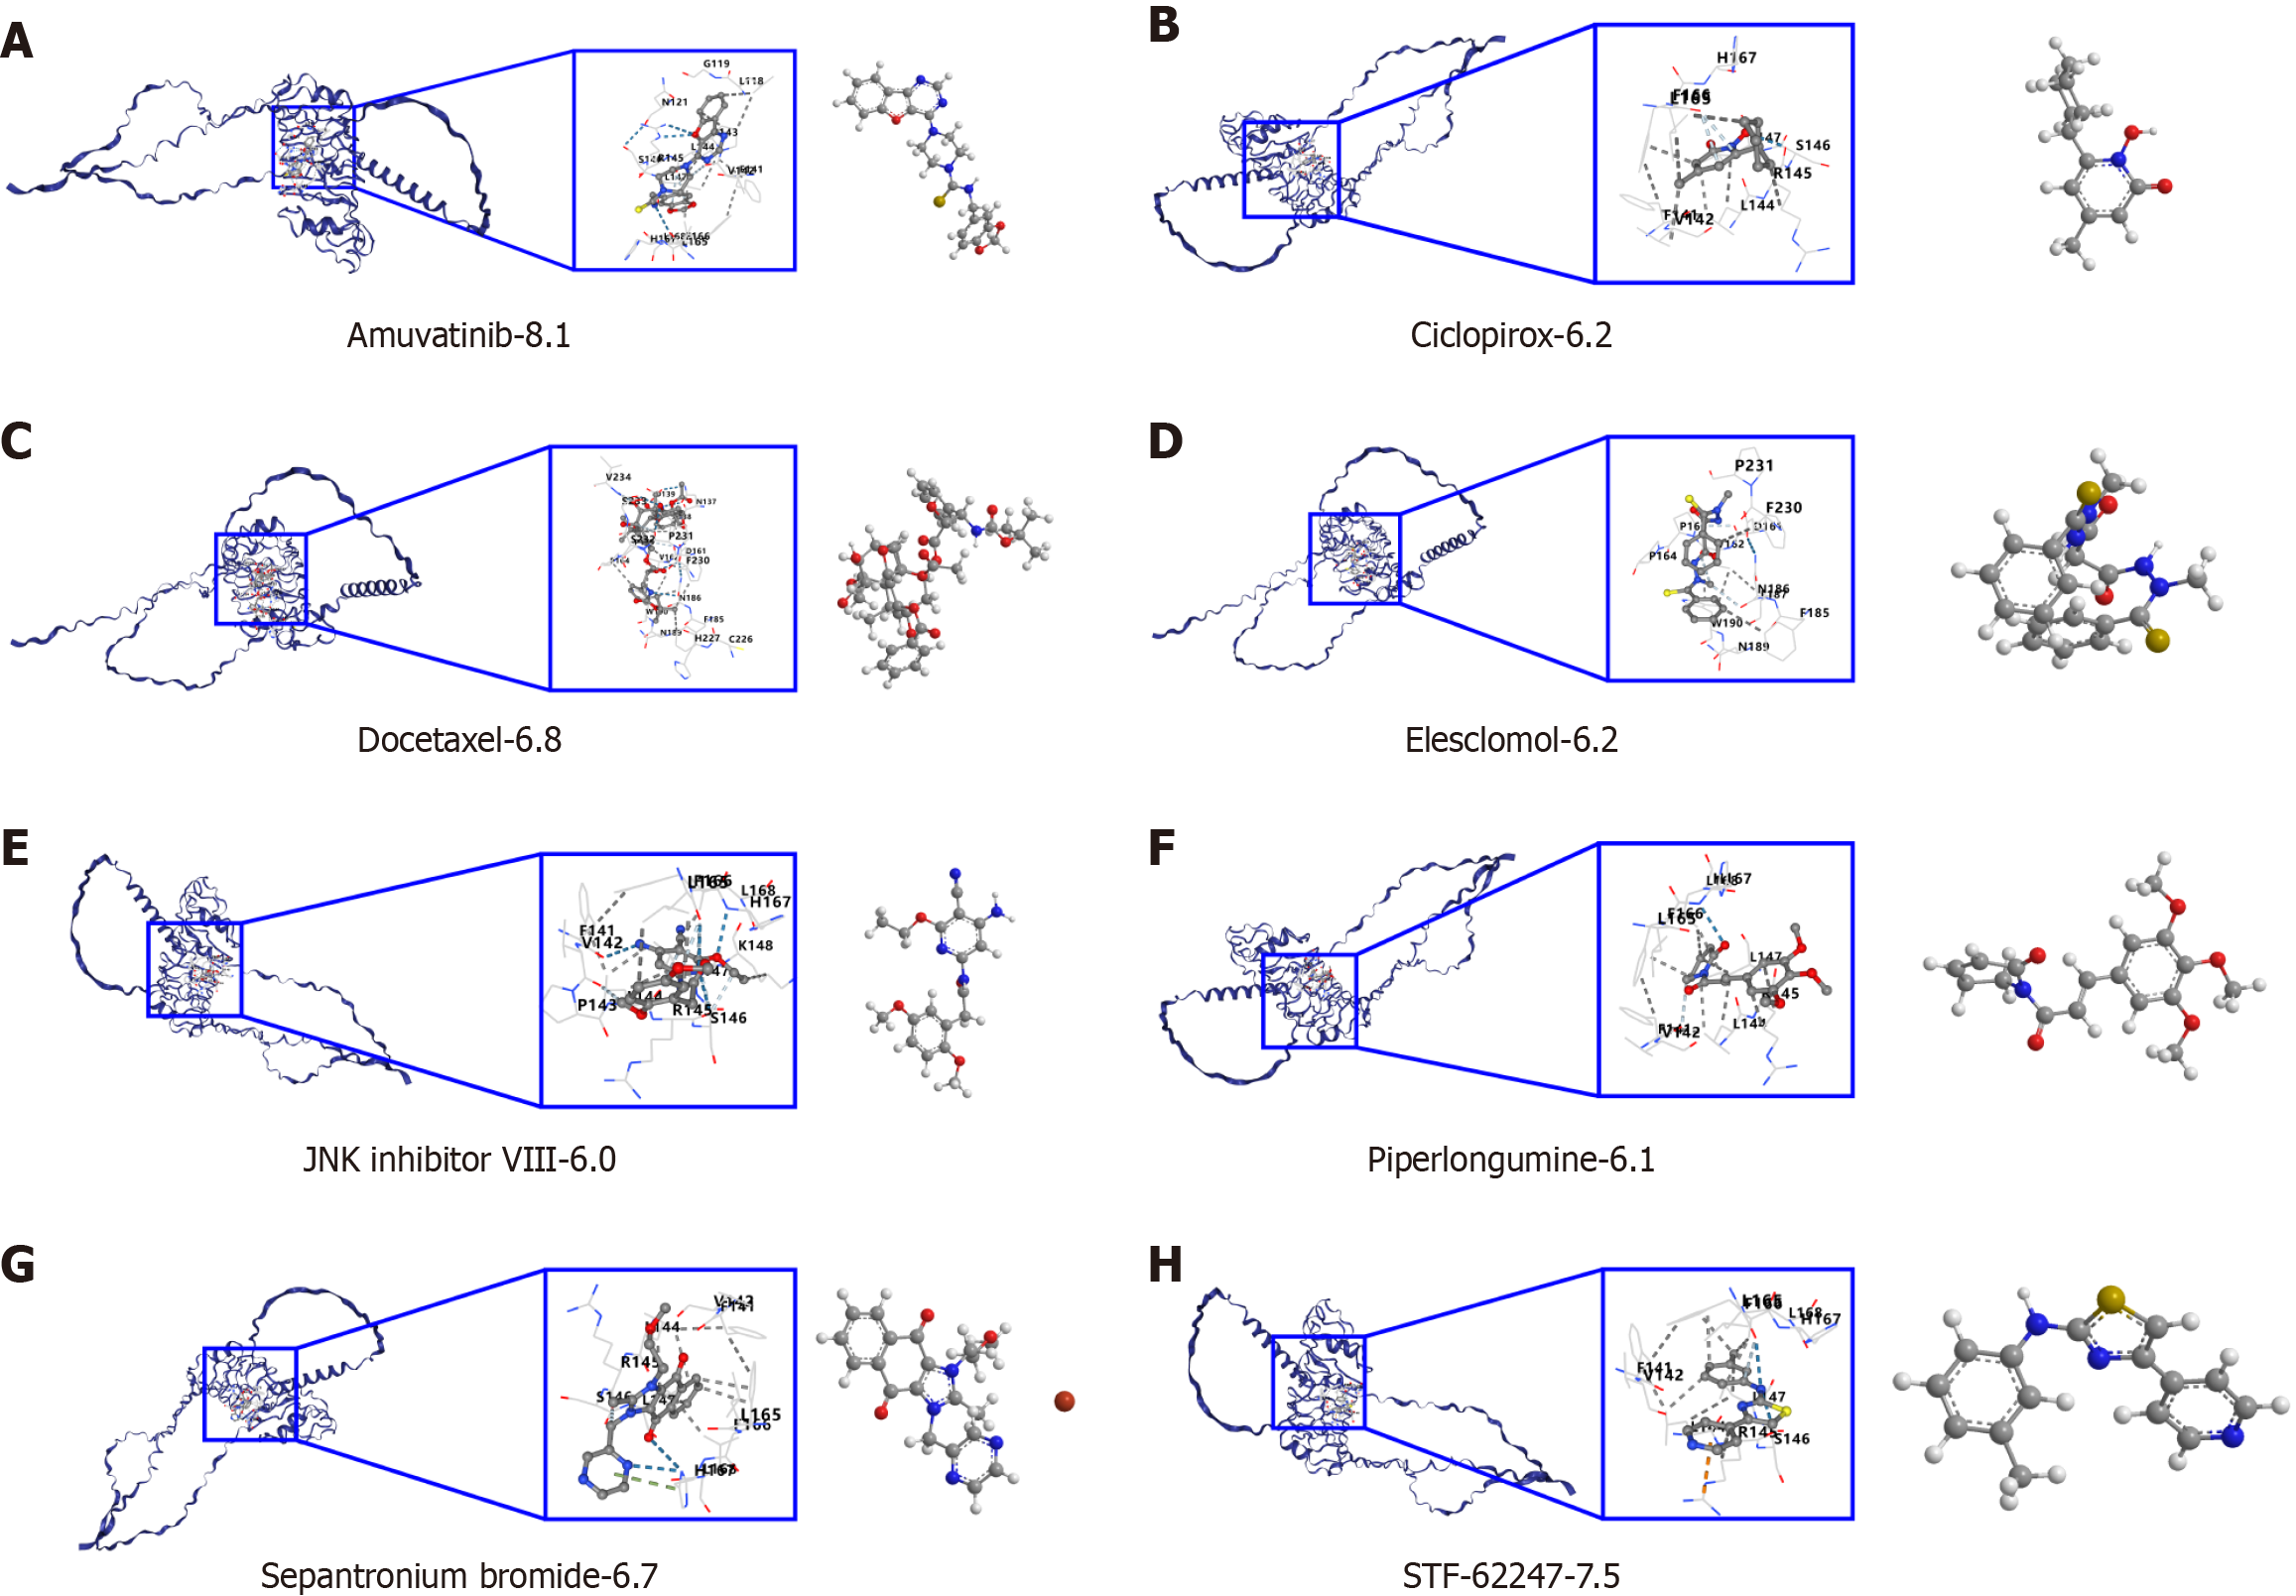
Figure 4 Drug binding affinity to leucine-rich repeat-containing 19 drug and molecular docking.
A: Amuvatinib binding affinity to leucine-rich repeat-containing 19 (LRRC19) drug and molecular docking; B: Ciclopirox binding affinity to LRRC19 drug and molecular docking; C: Docetaxel binding affinity to LRRC19 drug and molecular docking; D: Elesclomol binding affinity to LRRC19 drug and molecular docking; E: JNK Inhibitor VIII binding affinity to LRRC19 drug and molecular docking; F: Piperlongumine binding affinity to LRRC19 drug and molecular docking; G: Sepantronium bromide binding affinity to LRRC19 drug and molecular docking; H: STF-62247 binding affinity to LRRC19 drug and molecular docking.
Figure 5 Leucine-rich repeat-containing 19 expression correlates with immune cell infiltration and immune checkpoint genes in colorectal cancer.
A: Leucine-rich repeat-containing 19 (LRRC19) expression correlates with immune cell infiltration levels, showing positive correlations with B cells, T cells/natural killer (NK) cells, and CD4+ T cells, and negative correlations with macrophages, myeloid dendritic cells, γδ T cells, neutrophils, NK cells, and CD8+ T cells. A weak positive correlation is observed with regulatory T cells (Tregs); B: LRRC19 gene correlates significantly with immune checkpoint genes, particularly in colorectal cancer (CRC), showing significant correlations with cluster of differentiation 40 ligand (CD40 LG), galectin-9 (LGALS9), transmembrane and immunoglobulin domain containing 2 (TMIGD2), CD44, and cytotoxic T-lymphocyte associated protein 4 (CTLA4); C: LRRC19 expression correlates with immune-inflammatory pathways, with significant positive correlations in CRC for pathways like B cell receptor signaling, chemokine signaling, and T cell receptor signaling.
Figure 6 Single-cell RNA analysis in normal and tumor groups.
A: Tumor group shows higher mitochondrial features and metabolic activity; B: Mitochondrial gene proportion vs mRNA count correlation; C: Gene loadings on first principal component (PC1) and PC2; D: Significance of PCs in variation capture; E: Eigenvalues of PCs explaining data structure; F: Gene expression separation (normal vs tumor); G: Normal/tumor clusters on PC1-6; H: Key colon cancer-associated genes; I: MarkerGenes expression across cell types; J: Cell classification and spatial distribution; K: Cell type quantity changes in tumors; L: t-distributed Stochastic Neighbor Embedding (t-SNE) cluster distribution; M: 21 color-coded cell clusters; N: Major identified cell types; O: Leucine-rich repeat-containing 19 expression in specific cell types.
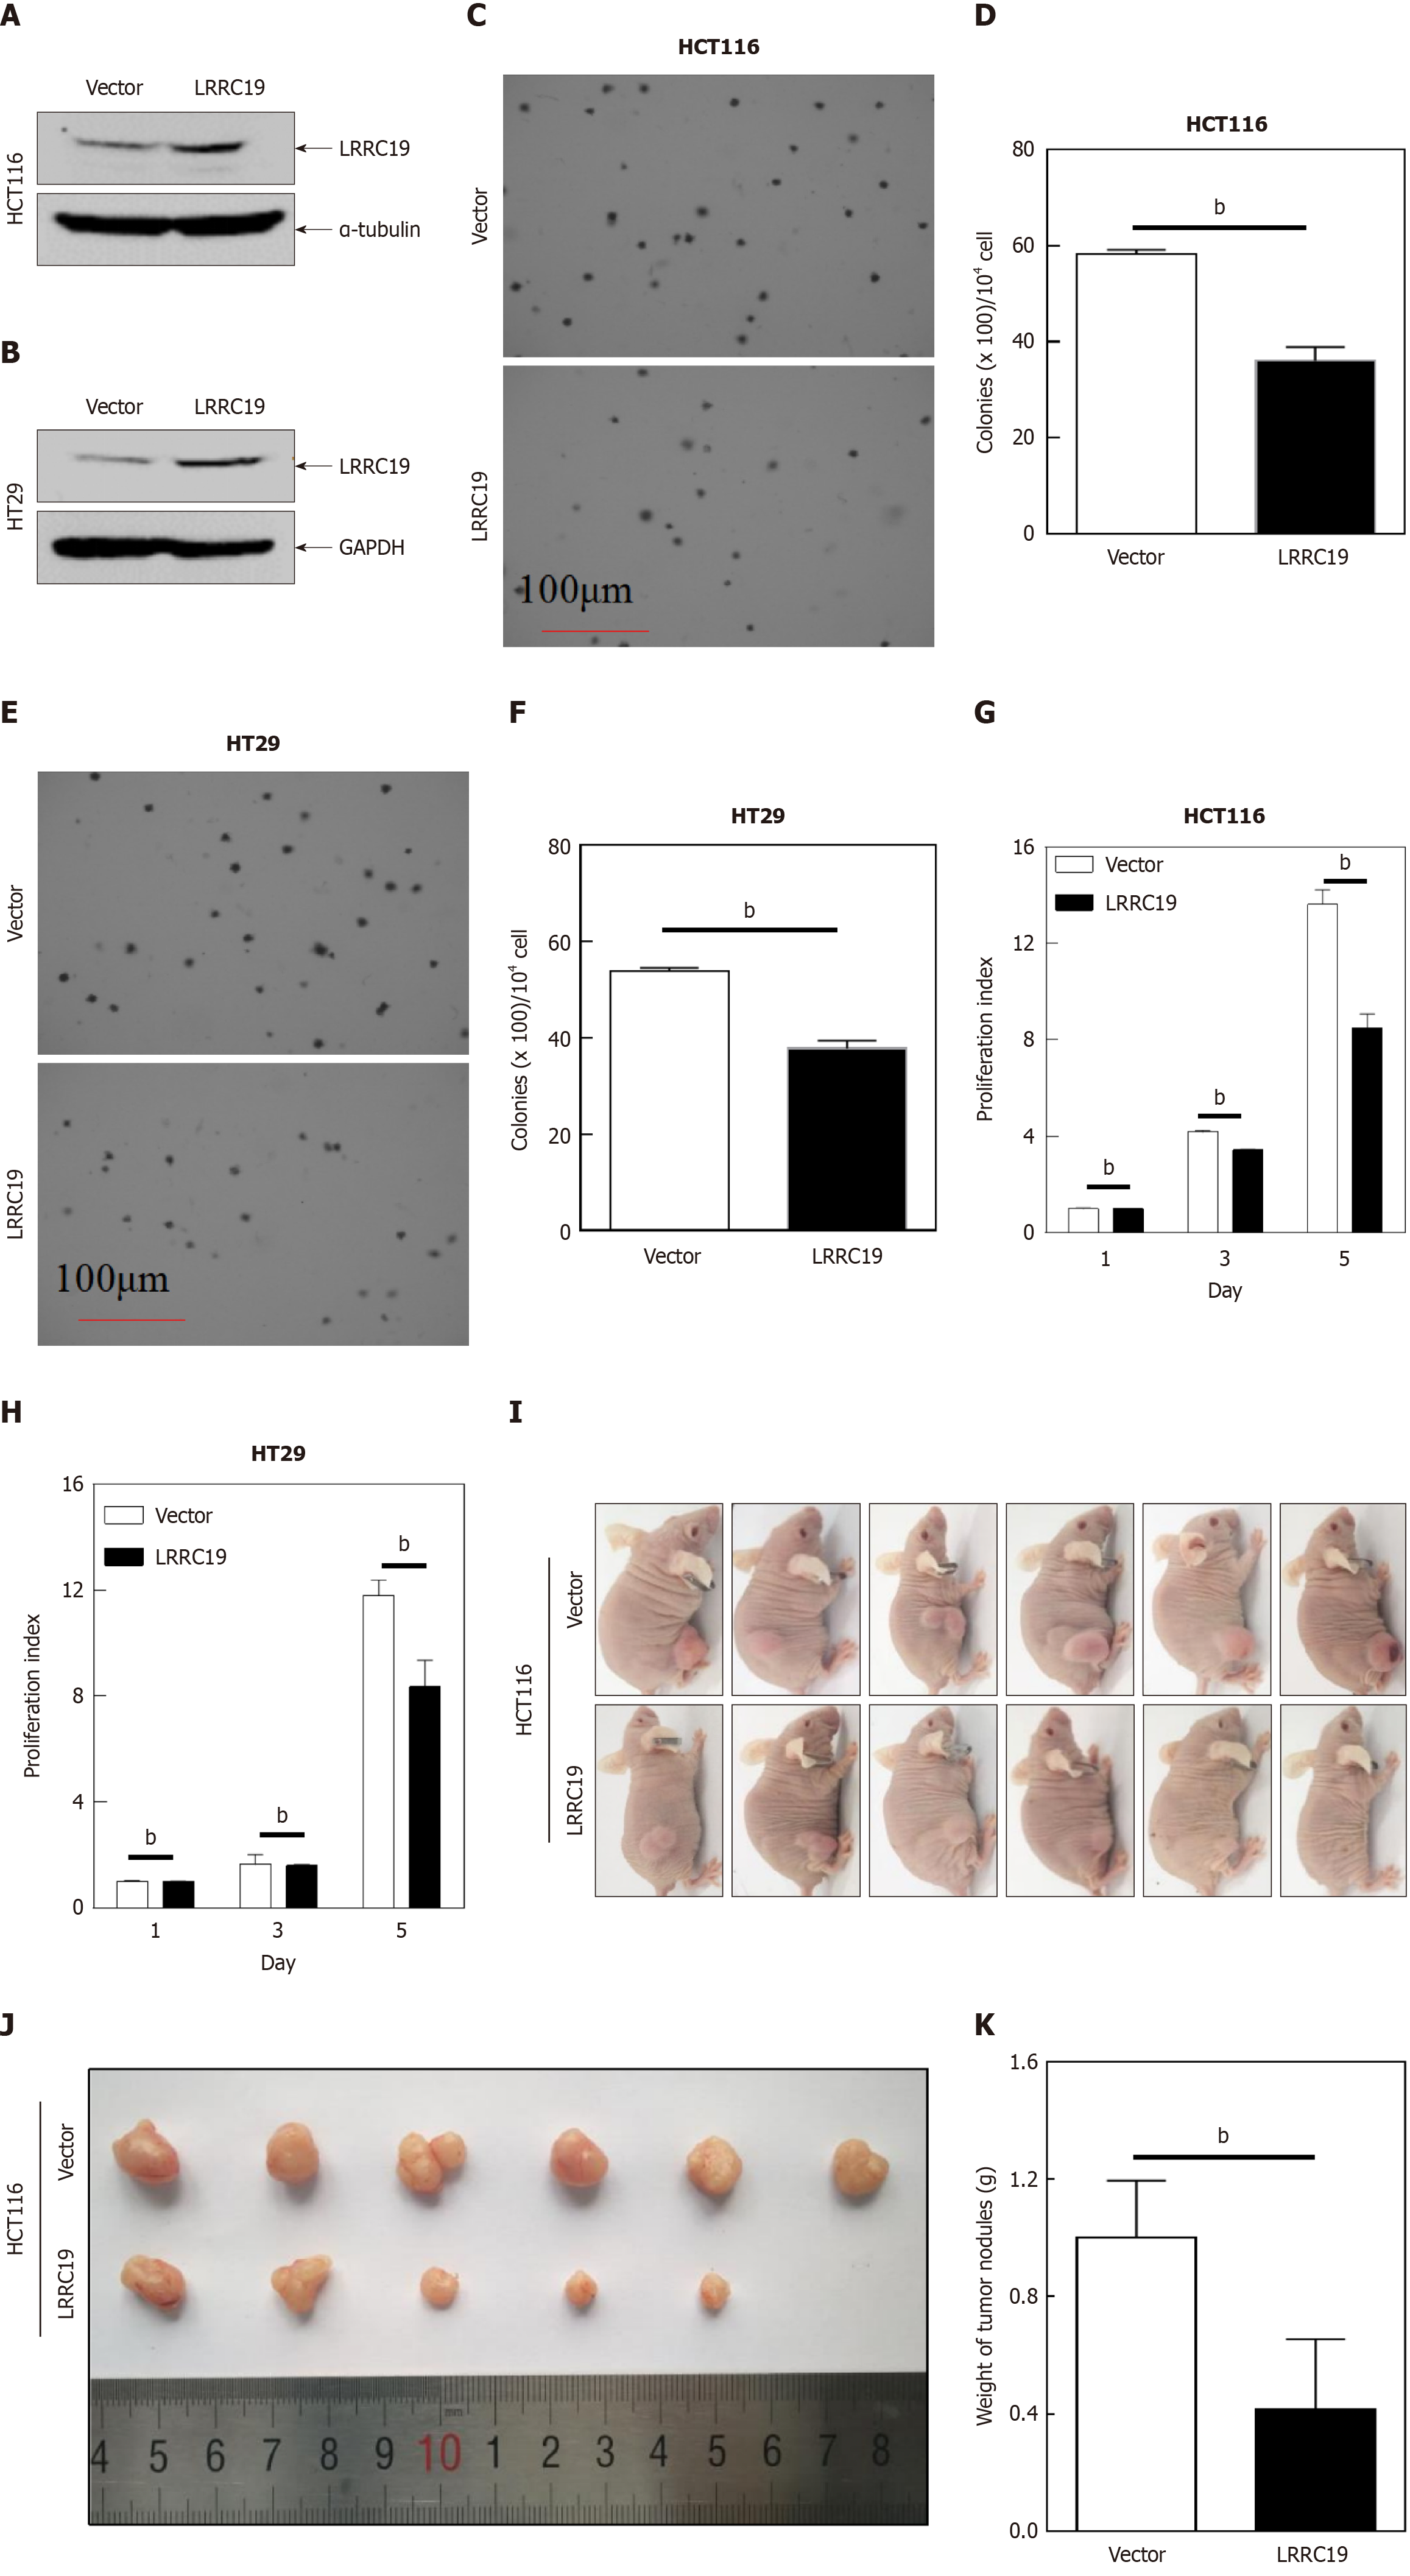
Figure 7 Leucine-rich repeat-containing 19 inhibits colorectal cancer cell proliferation in vitro and in vivo.
A and B: Stable overexpression of leucine-rich repeat-containing 19 (LRRC19) plasmids and vector controls in HT29 and HCT116 cells confirmed by Western blotting; C-F: Anchorage-independent colony formation assays evaluating the effect of LRRC19 overexpression in HT29 and HCT116 cells; G and H: ATP-based cell proliferation assays assessing monolayer cell growth rates; data are shown as the mean ± SD (bP < 0.05 compared with vector controls); I-K: Xenograft tumor growth in BALB/c nude mice subcutaneously injected with LRRC19-overexpressing or vector-control HCT116 cells. Tumors were excised, photographed, and weighed 4-5 weeks post-injection. Data are presented as the mean ± SD (bP < 0.05 compared with controls).
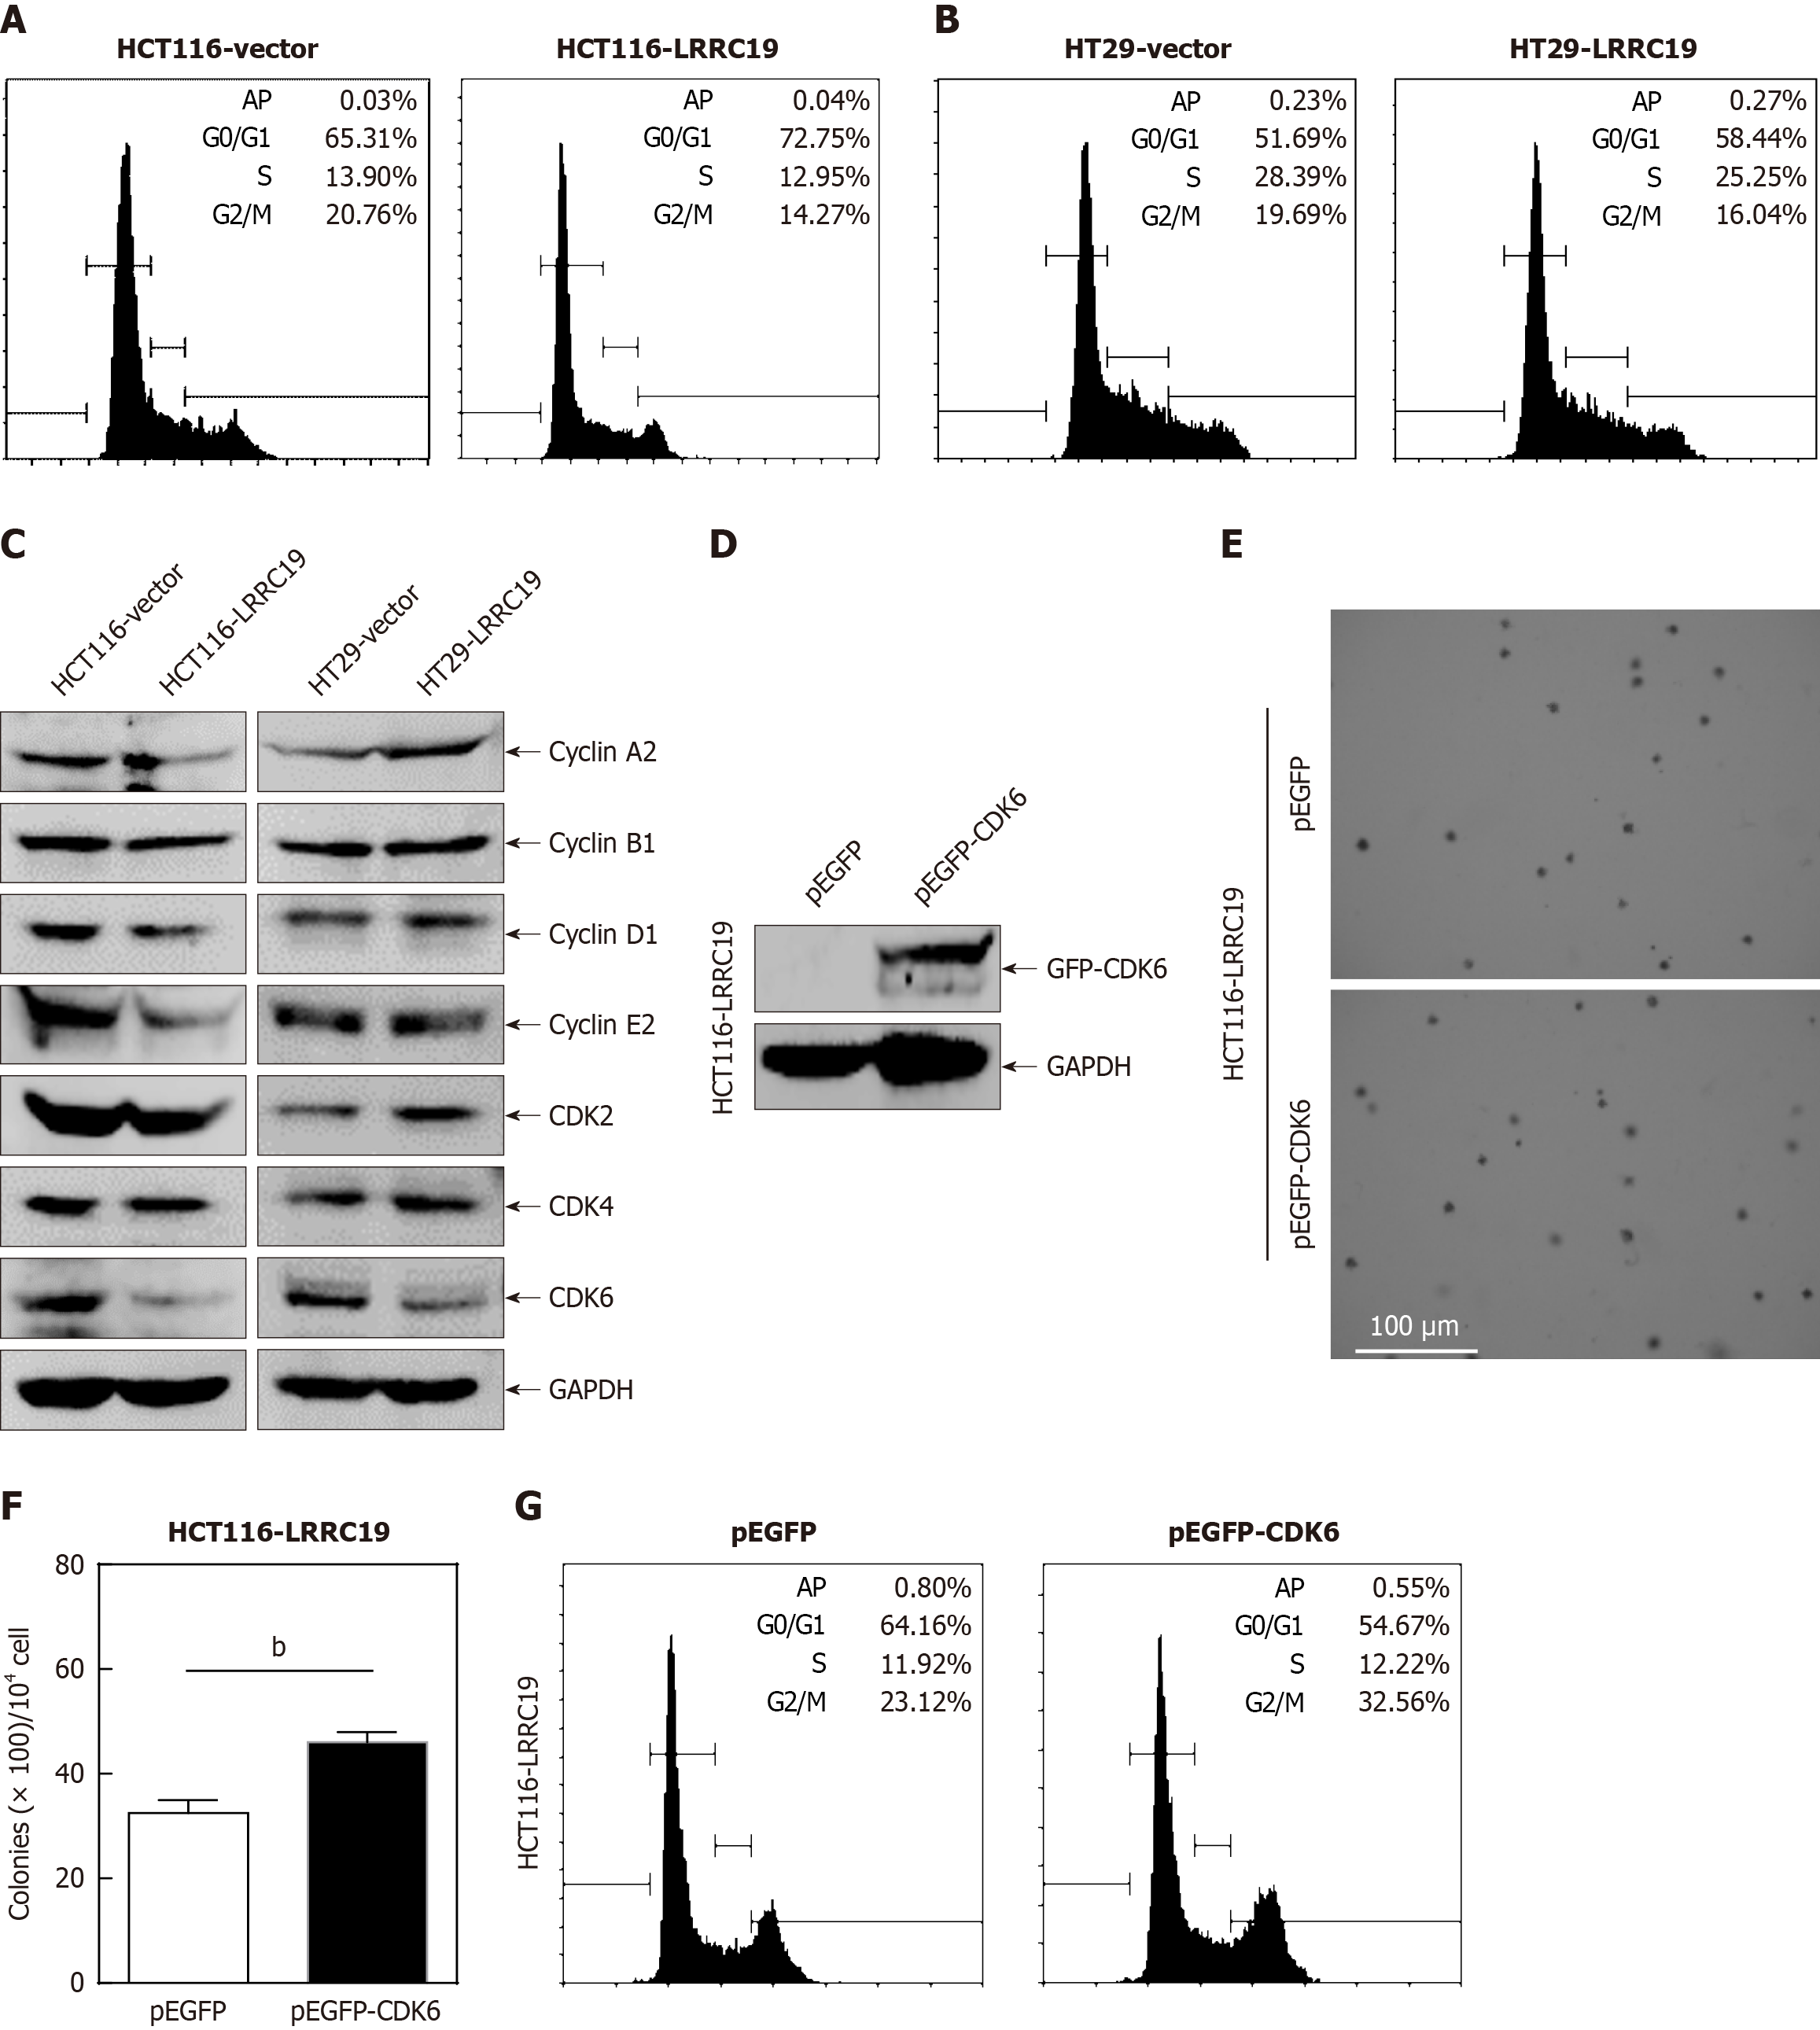
Figure 8 Leucine-rich repeat-containing 19 induces G0/G1 cell cycle arrest by regulating cyclin-dependent kinase 6 expression.
A and B: Cell cycle distribution analysis via flow cytometry in leucine-rich repeat-containing 19 (LRRC19)-overexpressing HCT116 and HT29 cells; C: Western blot analysis evaluating protein levels of cell cycle regulators (cyclin A2, cyclin B1, cyclin D1, cyclin E2, cyclin-dependent kinase 2 (CDK2), CDK4, and CDK6); glyceraldehyde-3-phosphate dehydrogenase (GAPDH) used as a loading control; D: Validation of CDK6 overexpression in HCT116 (LRRC19) cells transfected with pEGFP-CDK6 plasmids via Western blotting; E and F: Anchorage-independent growth assays demonstrating effects of CDK6 rescue in LRRC19-overexpressing cells; G: Flow cytometry analysis assessing cell cycle progression in CDK6-rescued LRRC19-overexpressing HCT116 cells. Data are presented as the mean ± SD. bP < 0.05 compared with respective controls.
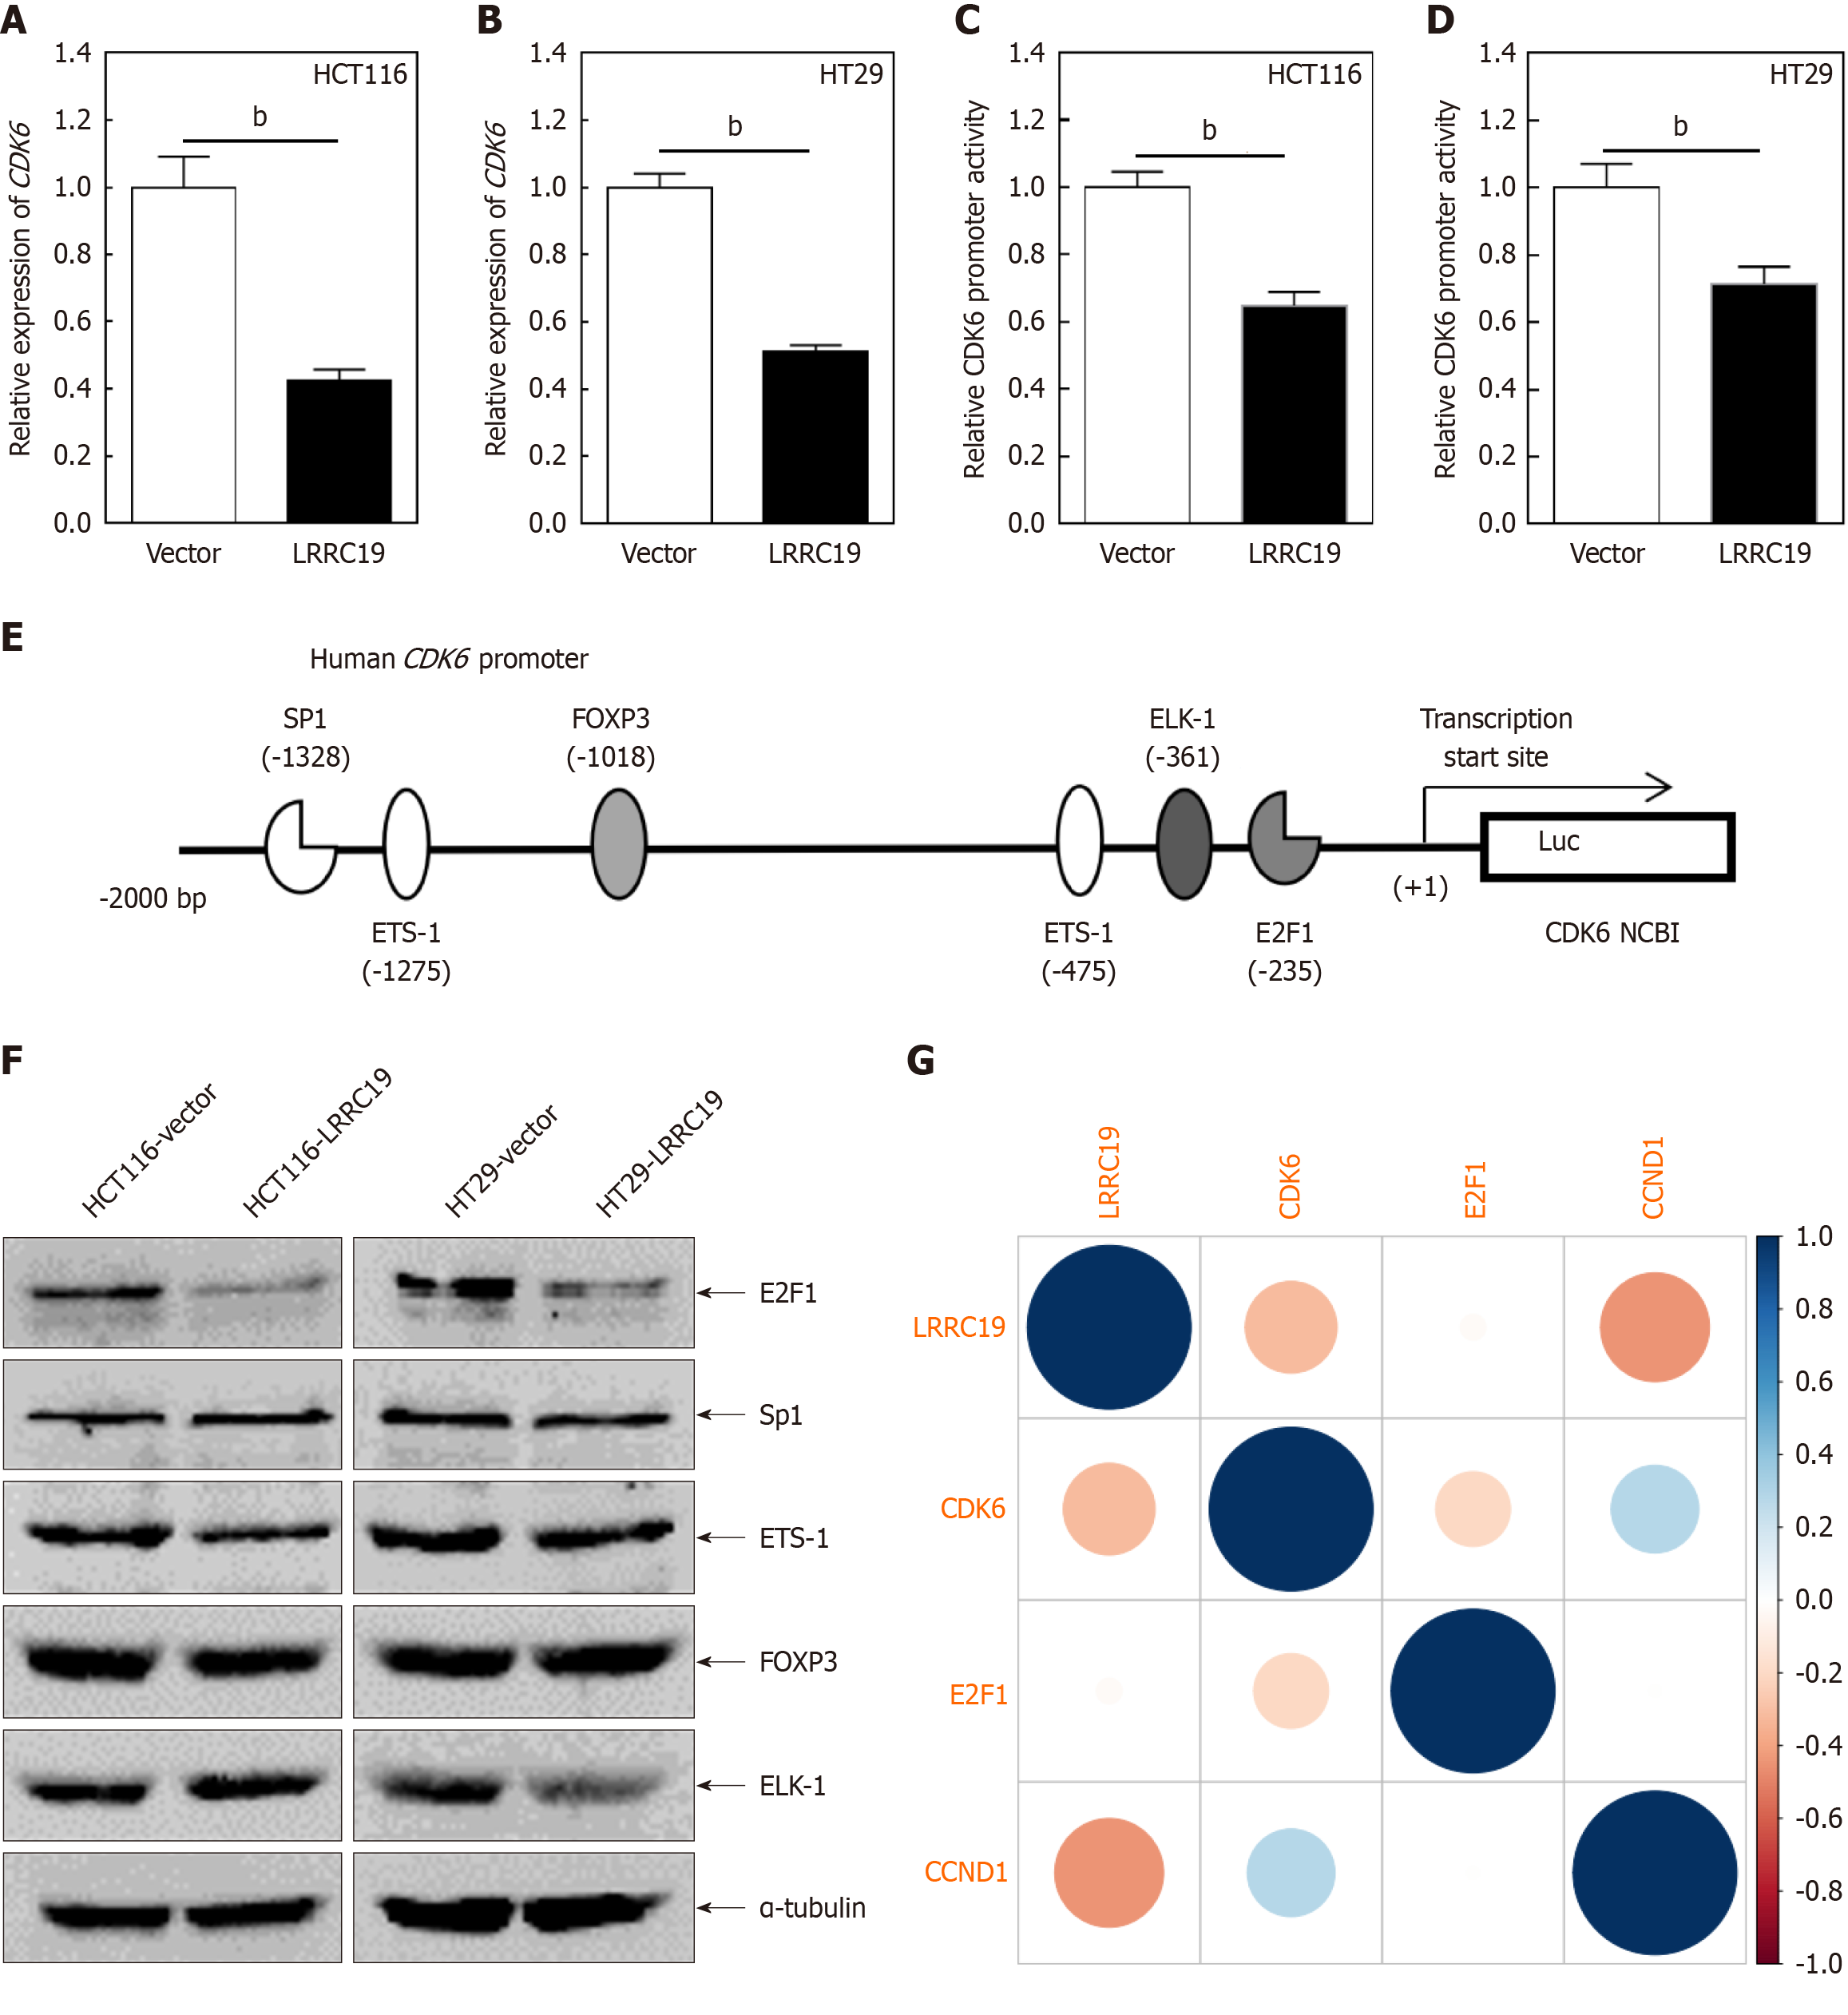
Figure 9 Leucine-rich repeat-containing 19 inhibits colorectal cancer proliferation via transcriptional suppression of E2F1 quantitative PCR analysis of cyclin-dependent kinase 6 mRNA expression levels in leucine-rich repeat-containing 19-overexpressing HCT116 and HT29 cells compared to vector controls.
A and B: Quantitative PCR analysis of cyclin-dependent kinase 6 (CDK6) mRNA expression levels in leucine-rich repeat-containing 19 (LRRC19)-overexpressing HCT116 and HT29 cells compared to vector controls; C and D: Dual luciferase reporter assays evaluating CDK6 promoter activity; data are shown as the mean ± SD from triplicate experiments; E: Prediction of potential transcription factor binding sites within the CDK6 promoter region (-2000 to +1) using the TRANSFAC 8.3 engine; F: Western blot analysis of transcription factors Sp1, ETS-1, forkhead box P3 (FOXP3), ETS-like 1 (ELK-1), and E2F1; α-tubulin served as loading control; G: Scatter plots depicting correlation analyses between LRRC19 and key cell cycle-associated genes. bP < 0.05.
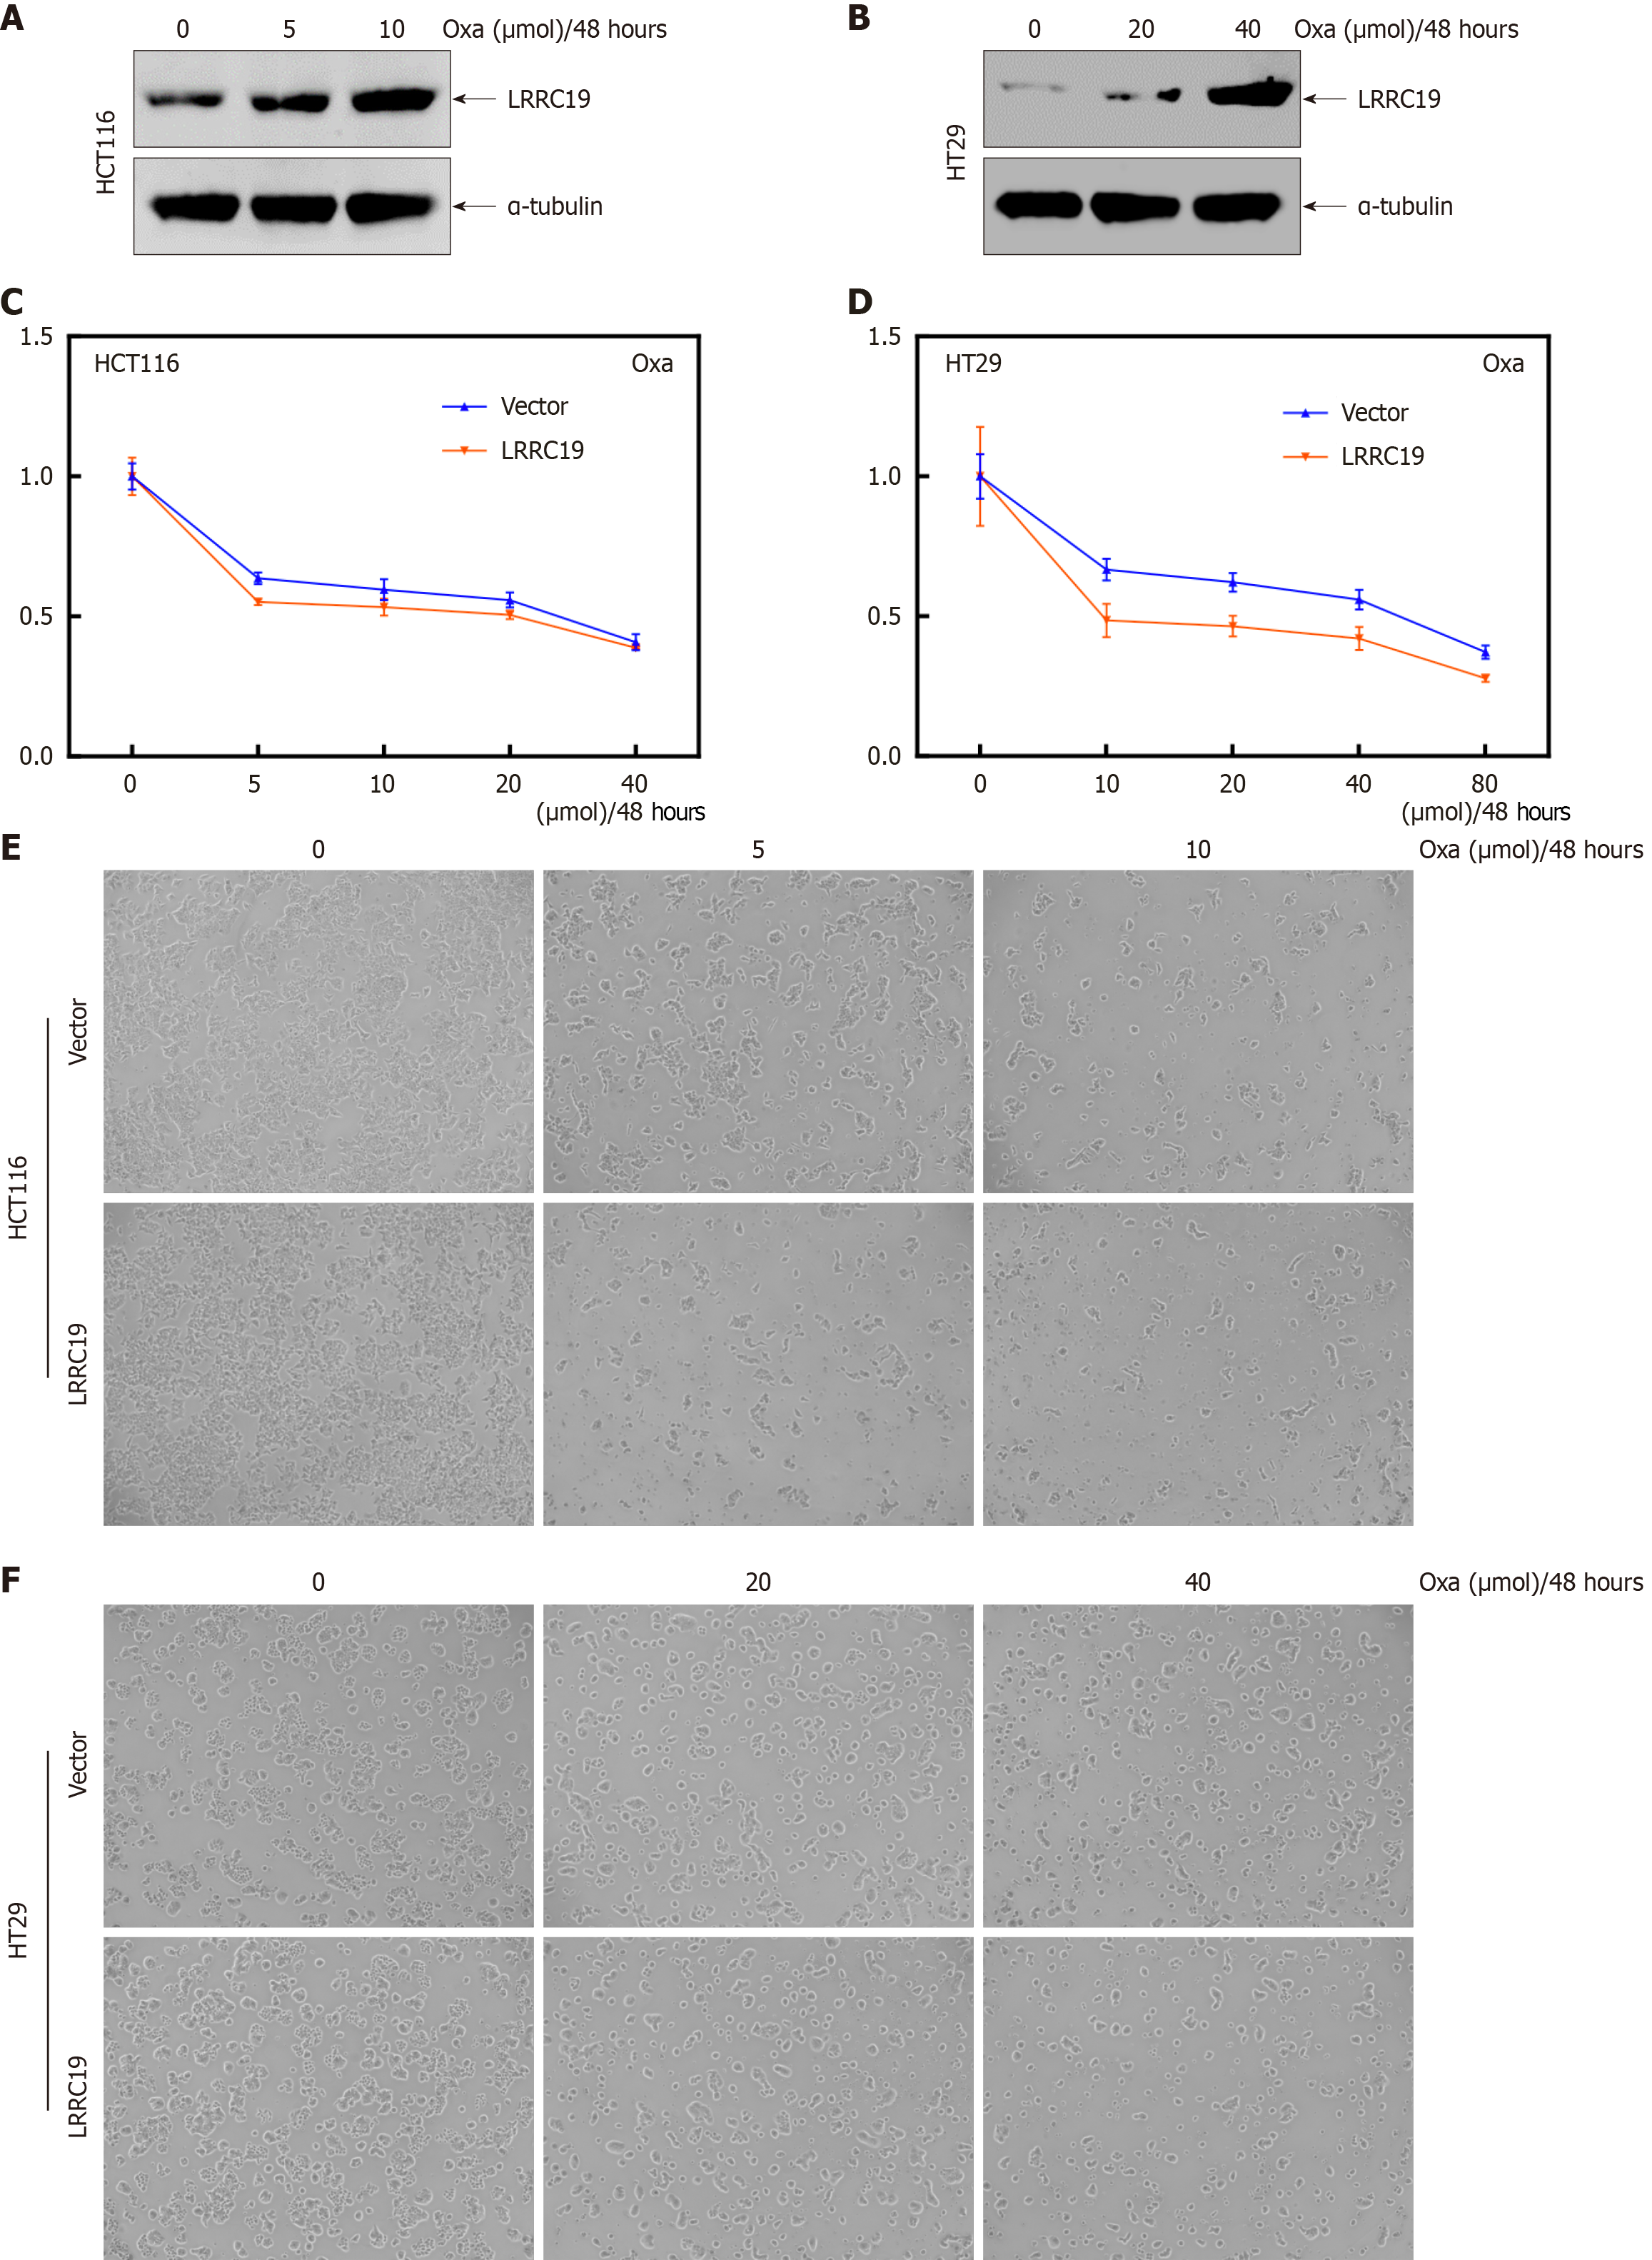
Figure 10 Overexpression of leucine-rich repeat-containing 19 sensitizes colorectal cancer cells to oxaliplatin.
A and B: Western blot analysis of leucine-rich repeat-containing 19 (LRRC19) protein expression in HCT116 and HT29 cells treated with various concentrations (0, 5, 10 μM and 0, 20, 40 μM) of oxaliplatin for 48 hours; C-F: Morphological assessment under inverted microscopy of cell death induced by oxaliplatin treatment at concentrations of 0, 5, 10, 20, 40, and 80 μM in HCT116 (Vector), HCT116 (LRRC19), HT29 (Vector), and HT29 (LRRC19) cells after 48 hours of exposure.
- Citation: Huang SS, Chen W, Vaishnani DK, Huang LJ, Li JZ, Huang SR, Li YZ, Xie QP. Leucine-rich repeat-containing protein 19 suppresses colorectal cancer by targeting cyclin-dependent kinase 6/E2F1 and remodeling the immune microenvironment. World J Gastroenterol 2025; 31(25): 107893
- URL: https://www.wjgnet.com/1007-9327/full/v31/i25/107893.htm
- DOI: https://dx.doi.org/10.3748/wjg.v31.i25.107893


