©The Author(s) 2025.
World J Gastroenterol. Jul 7, 2025; 31(25): 107478
Published online Jul 7, 2025. doi: 10.3748/wjg.v31.i25.107478
Published online Jul 7, 2025. doi: 10.3748/wjg.v31.i25.107478
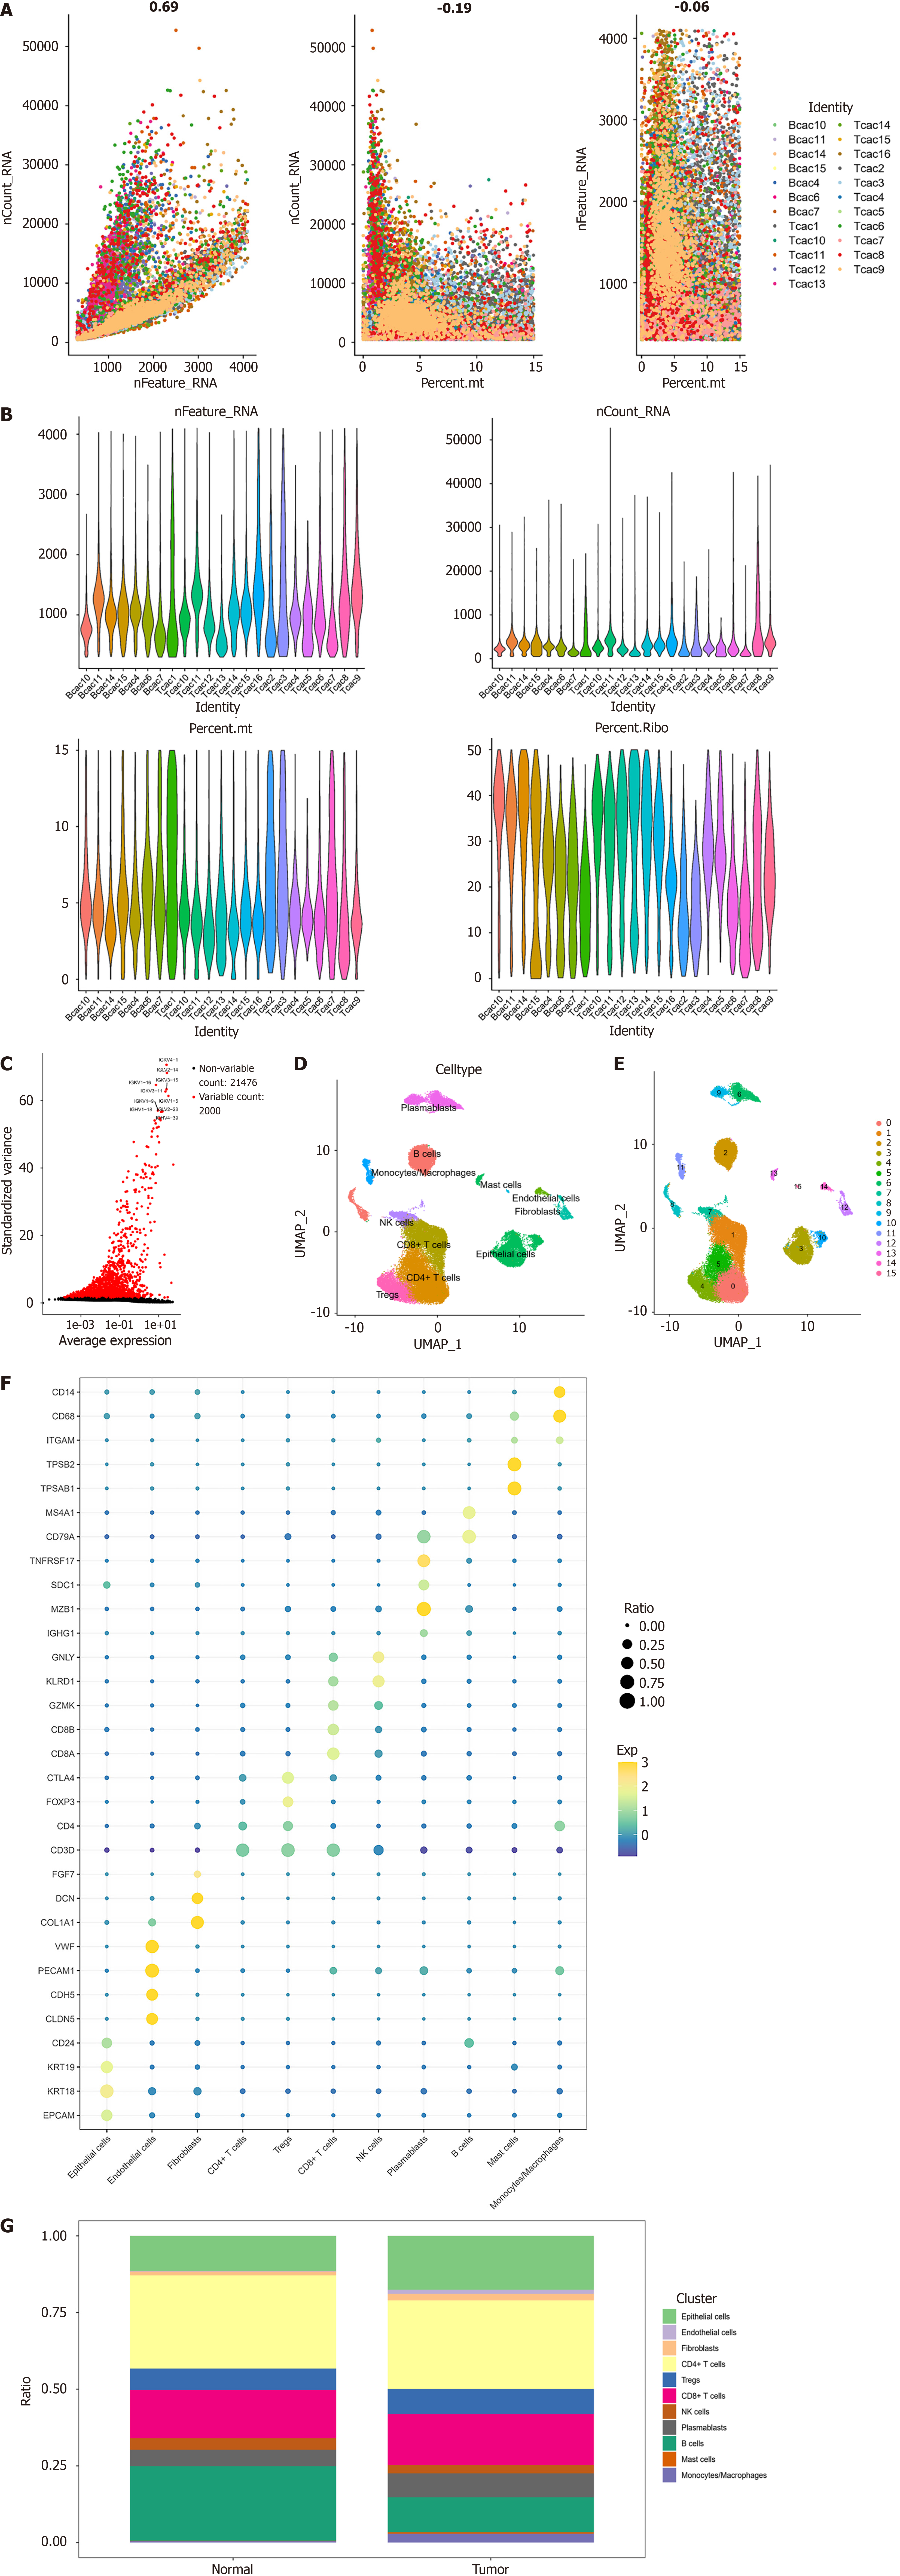
Figure 1 Cell mapping in colorectal cancer.
A: Plot of RNA feature counts (nFeature_RNA) vs total RNA abundance (nCount_RNA) correlation after quality control (QC); plot of nCount_RNA vs mitochondrial percentage after QC; plot of nFeature_RNA vs mitochondrial percentage after QC; B: Violin plots of nFeature_RNA, nCount_RNA, mitochondrial gene percentage, and erythrocyte gene percentage for each sample after QC; C: Volcano plot of highly variable genes. The graph shows 23476 genes in all cells; red dots indicate highly variable genes, and the top 10 most variable genes are labeled in the graph; D: Uniform manifold approximation and projection distribution map of 16 cell clusters identified after cluster analysis and dimensionality reduction analysis; E: Uniform manifold approximation and projection distribution map of 11 cell subclusters identified after annotation; F: Expression bubble plots of marker genes in 11 cell subgroups; G: Ratio of the 11 cell subpopulations in tumor tissues and normal tissues. nFeature_RNA: RNA feature counts; nCount_RNA: Total RNA abundance; UMAP: Uniform manifold approximation and projection; NK: Natural killer.
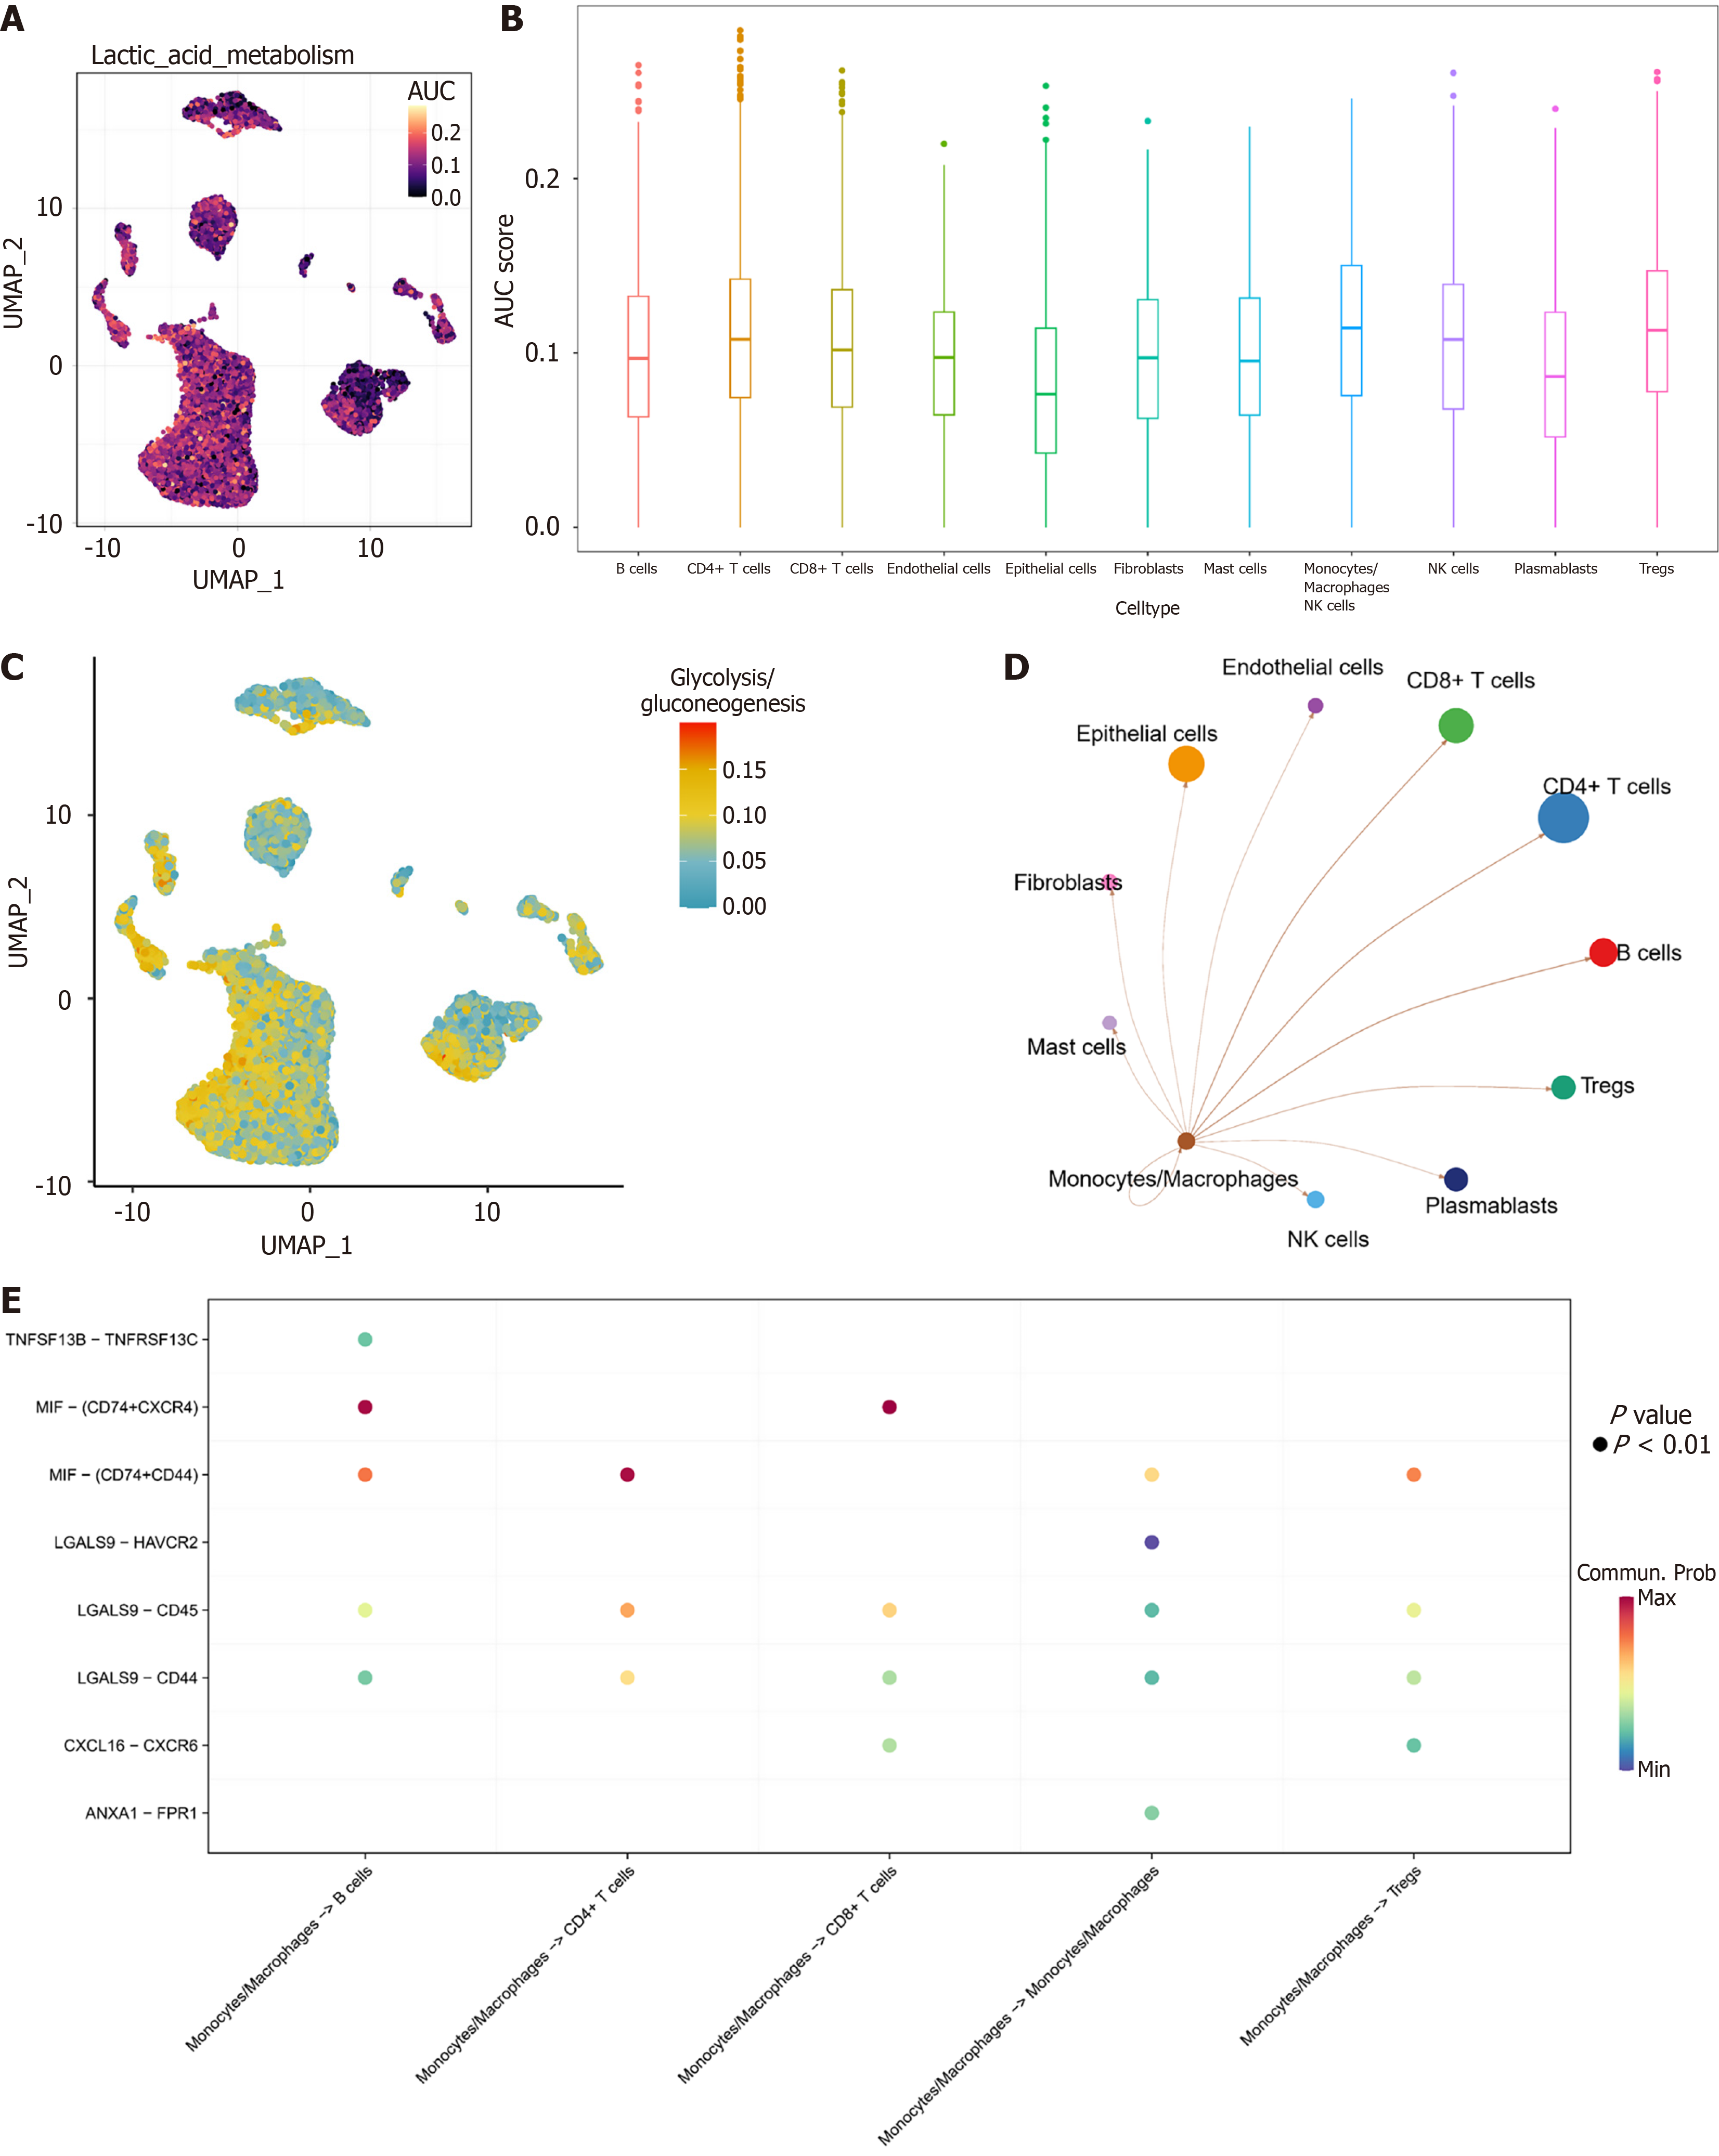
Figure 2 Monocytes/macrophages exhibit high lactate metabolic activity.
A: Uniform manifold approximation and projection heatmap of lactate metabolic activity in 11 cell subpopulations; B: Boxplot of lactate metabolic activity in 11 cell subpopulations; C: Uniform manifold approximation and projection heatmap of glycolysis/gluconeogenesis pathway activity in 11 cellular subpopulations; D: Cellular communication network of monocytes/macrophages with the remaining 10 cell subpopulations; E: Ligand-receptor dot plot of monocytes/macrophages with B cells, CD4+ T cells, monocytes/macrophages, and regulatory T cells. UMAP: Uniform manifold approximation and projection; AUC: Area under the curve; NK: Natural killer; TNFSF: Tumor necrosis factor superfamily member; TNFRSF: Tumor necrosis factor receptor superfamily; MIF: Migration inhibitory factor; CXCR4: C-X-C motif chemokine receptor-4; ANXA: Annexin A.
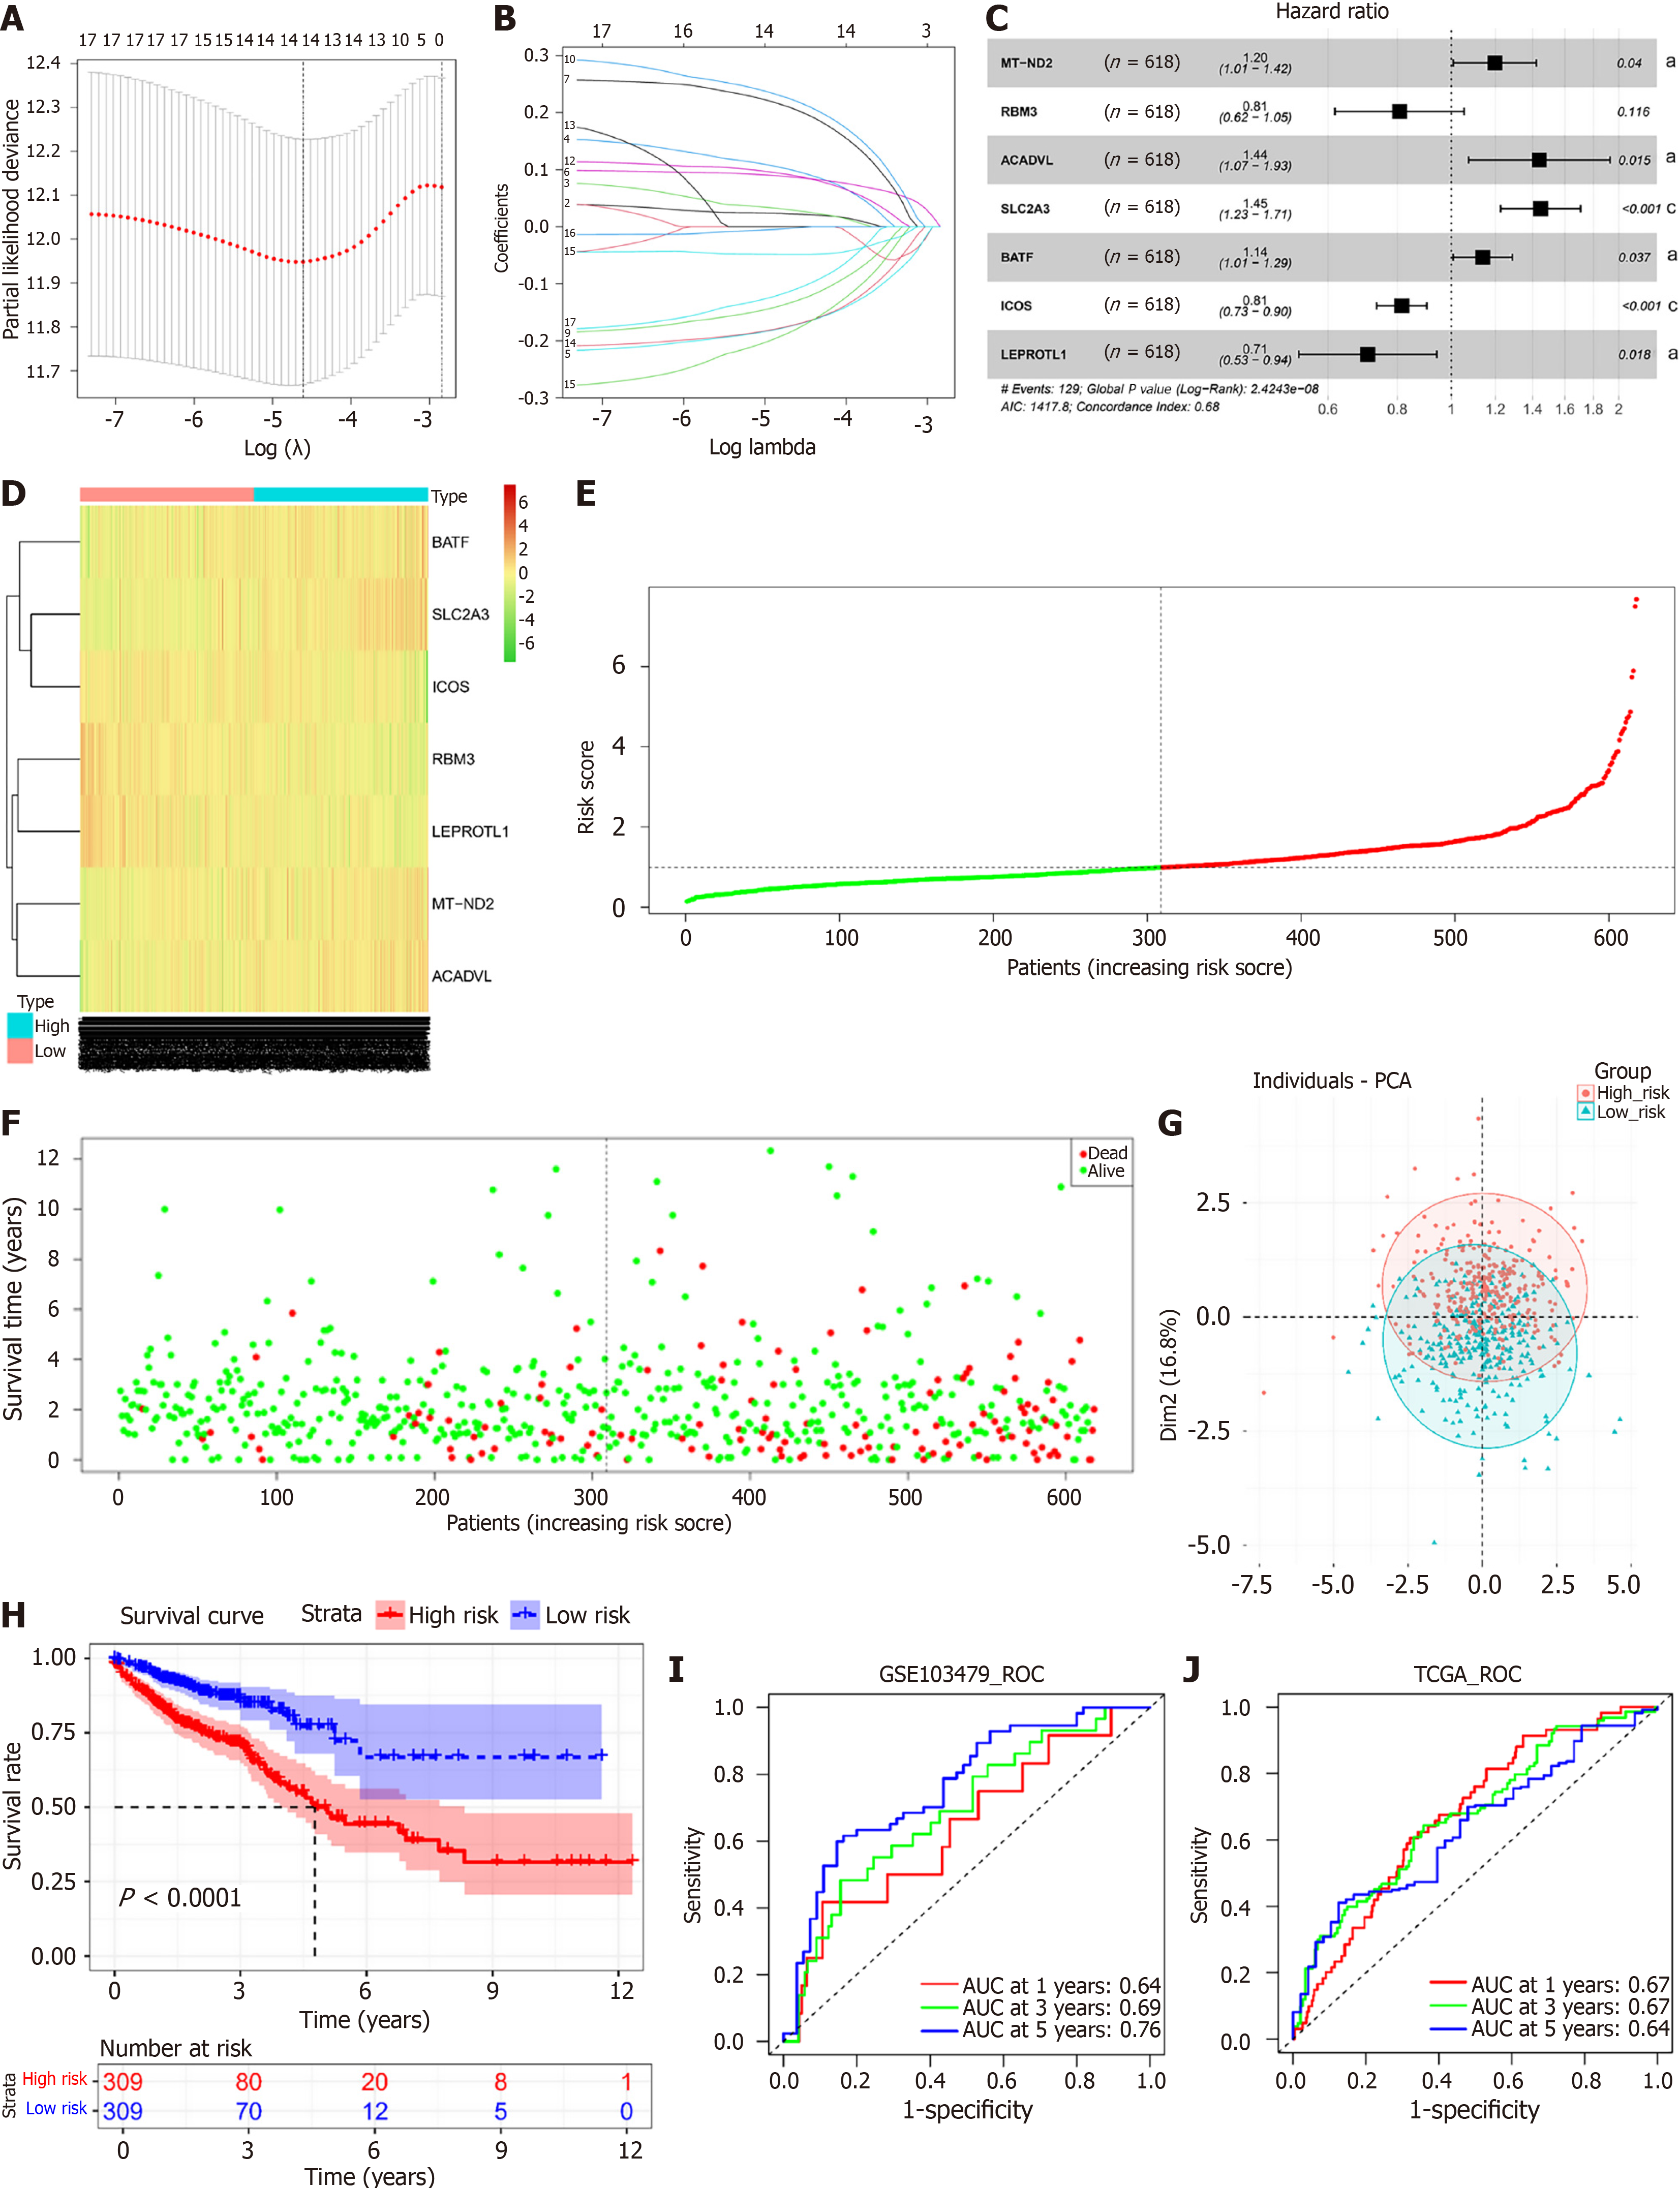
Figure 3 Prognostic modeling of lactate metabolism characteristics in colorectal cancer.
A: Screening for the optimal penalty parameter (λ) in LASSO Cox analysis; B: Coefficients of genes in LASSO Cox analysis; C: Forest plot of seven independent prognostic factors; D: Heatmap of the expression levels of 7 lactate metabolism genes in the high- and low-risk score groups; E: Risk score distribution of samples in The Cancer Genome Atlas database-colon and rectal adenocarcinomas (TCGA-COADREAD) cohort; F: Scatterplot of the survival status of COADREAD patients in the TCGA-COADREAD cohort according to the risk score distribution; G: Principal component analysis distribution plot of patients with high and low risk scores based on the expression profiles of 7 genes related to lactate metabolism; H: Kaplan-Meier survival curves of patients in the TCGA-COADREAD cohort with high and low risk scores; I: Receiver operating characteristic curves of patients in the TCGA-COADREAD cohort with the risk score for predicting 1-, 3-, and 5-year survival; J: Receiver operating characteristic curves for the risk score for predicting patient survival at 1, 3, and 5 years in the GSE103479 cohort. aP < 0.05, cP < 0.001. MT-ND2: Mitochondrial-dihydronicotinamide adenine dinucleotide dehydrogenase subunit 2; RBM3: RNA binding motif protein 3; ACADVL: Acyl-CoA dehydrogenase very-long-chain; SLC2A3: Solute carrier family 2 member 3; BATF: Basic leucine zipper transcription factor ATF-like; ICOS: Inducible T cell costimulator; LEPROTL1: Leptin receptor overlapping transcript-like 1; PCA: Principal component analysis; ROC: Receiver operating characteristic; AUC: Area under the curve; TCGA: The Cancer Genome Atlas database.
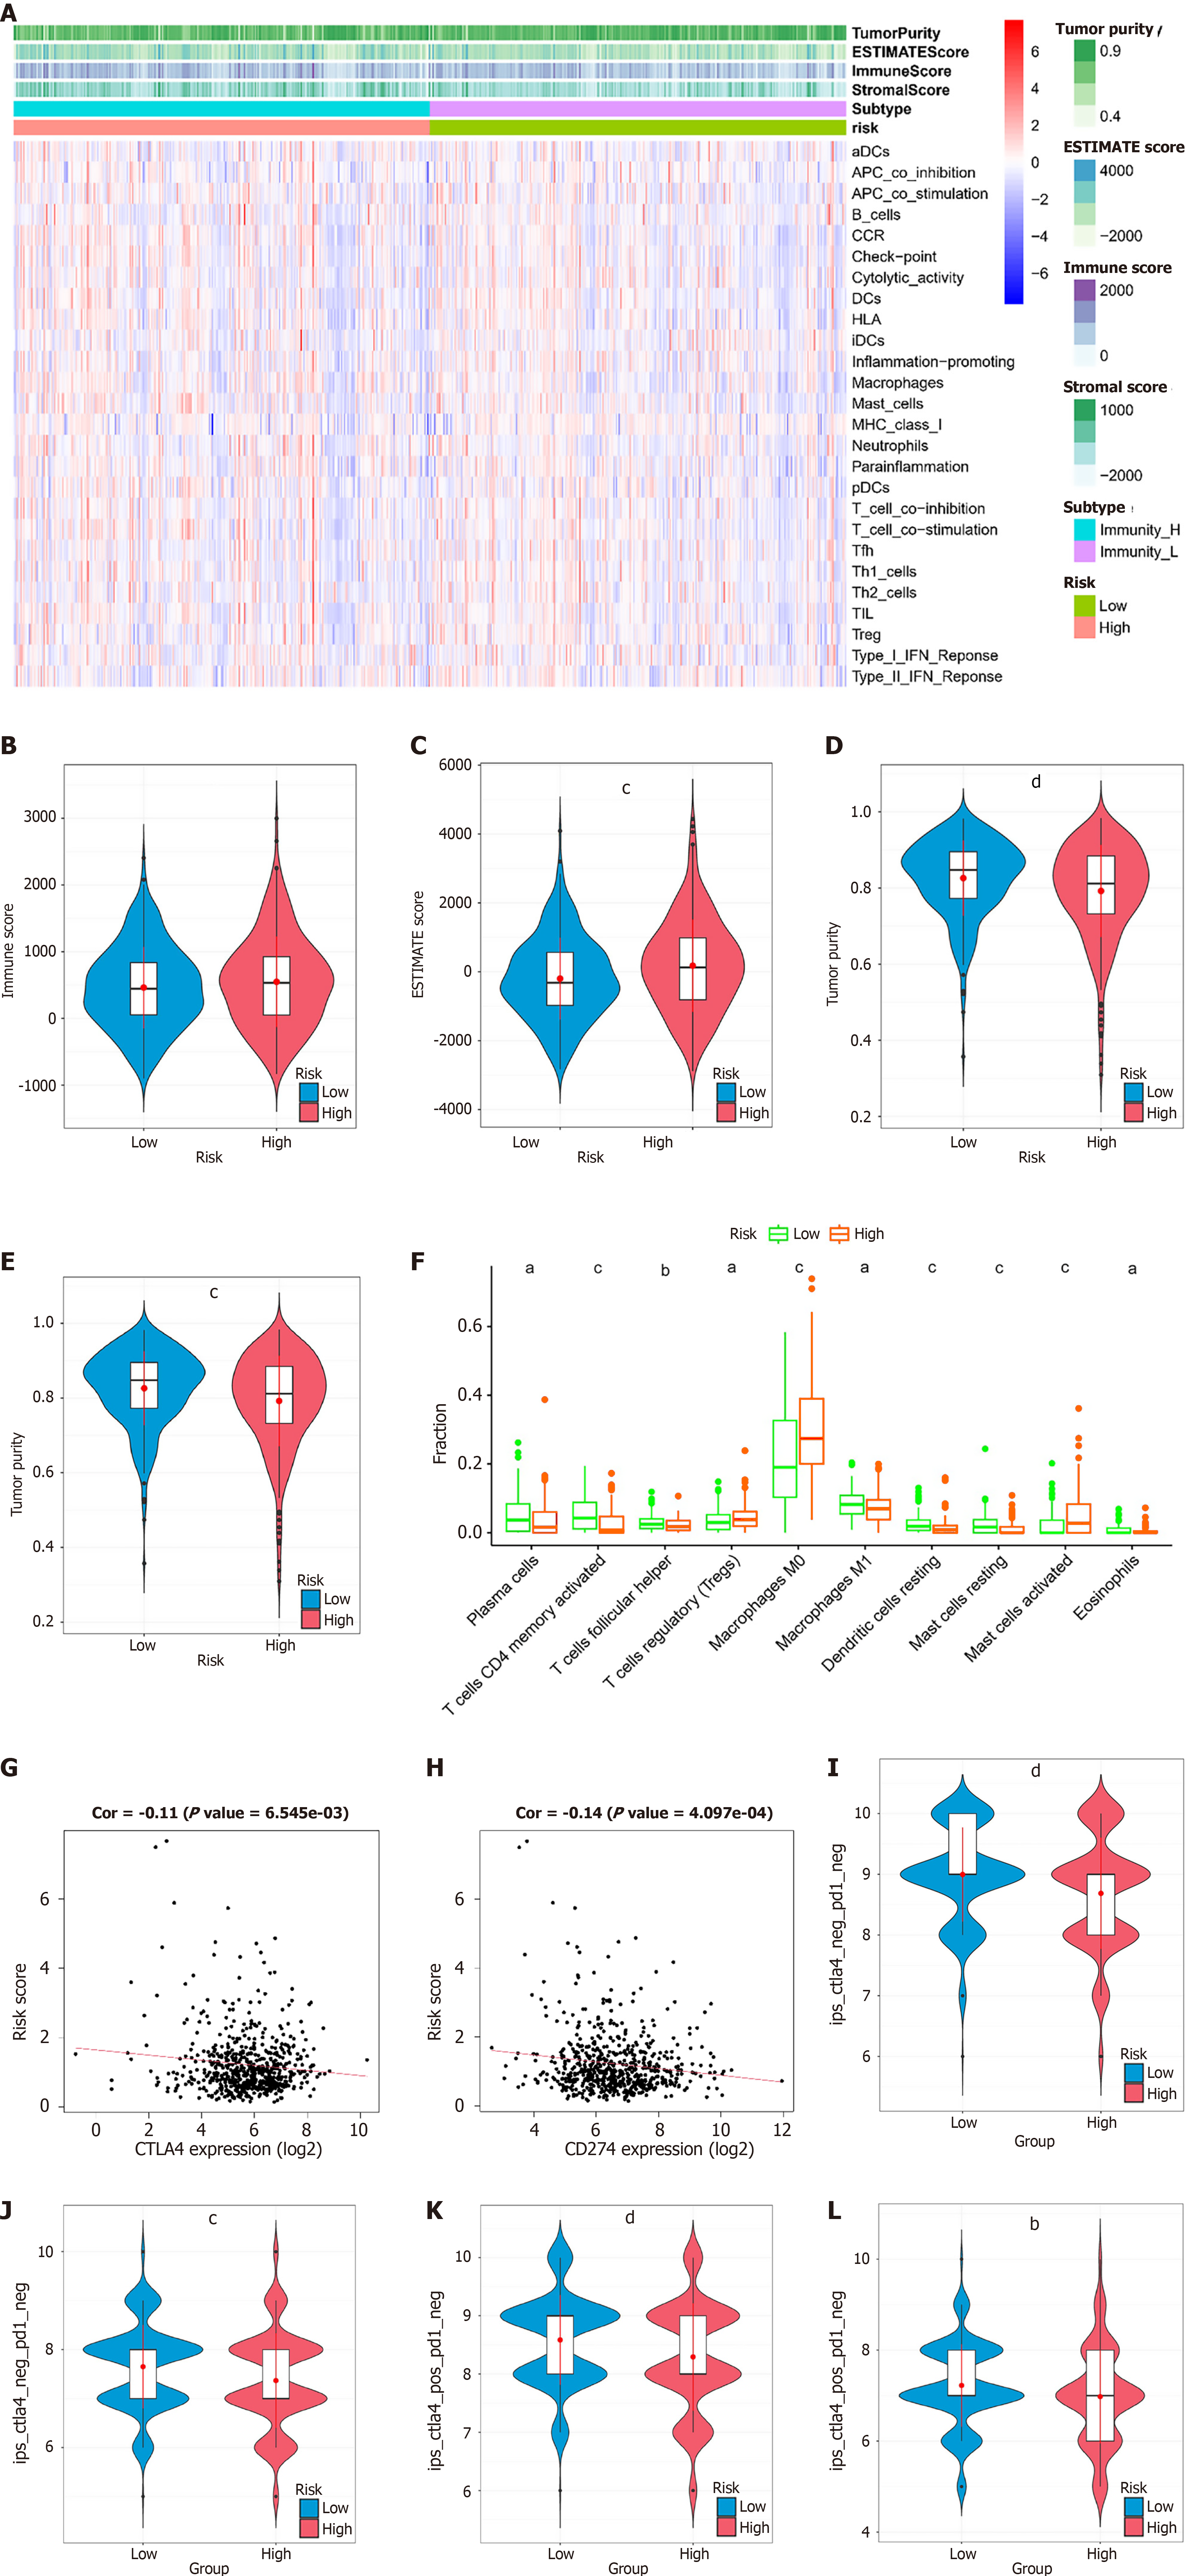
Figure 4 Immune infiltration and immunotherapy sensitivity in the risk score subgroups.
A: Heatmap of immune cell infiltration levels according to single-sample gene set enrichment analysis results and estimation of stromal and immune cells in malignant tumor tissues using expression data results; B: Violin plot demonstrating the immune score in the high- and low-risk score groups; C: Violin plot demonstrating the stromal score in the high- and low-risk score groups; D: Violin plot showing the estimation of stromal and immune cells in malignant tumor tissues using expression data score in the high- and low-risk score groups; E: Violin plot demonstrating tumor purity in the high- and low-risk score groups; F: Cell type identification by estimating relative subsets of RNA transcripts results demonstrating the infiltration levels of 10 immune cells in the high- and low-risk score groups; G: Scatter plot of the correlation between the risk score and cytotoxic T lymphocyte associated protein 4 expression level; H: Scatterplot of the correlation between the risk score and CD274 expression level; I: Immunopheno score (IPS) of cytotoxic T lymphocyte antigen 4 (CTLA-4)-negative/programmed death-1(PD-1)-negative colorectal cancer (CRC) patients in the high- and low-risk score subgroups; J: IPS of CTLA-4-negative/PD-1-positive CRC patients in the high- and low-risk score subgroups; K: IPS of CTLA-4-positive/PD-1-negative CRC patients in the high- and low-risk score subgroups; L: IPS of CTLA-4-positive and PD-1-positive CRC patients in the high- and low-risk score subgroups. aP < 0.05, bP < 0.01, cP < 0.001, dP < 0.0001, denote significant difference from the low-risk score subgroups. ESTIMATE: Estimation of stromal and immune cells in malignant tumor tissues using expression data; CTLA: Cytotoxic T lymphocyte antigen.
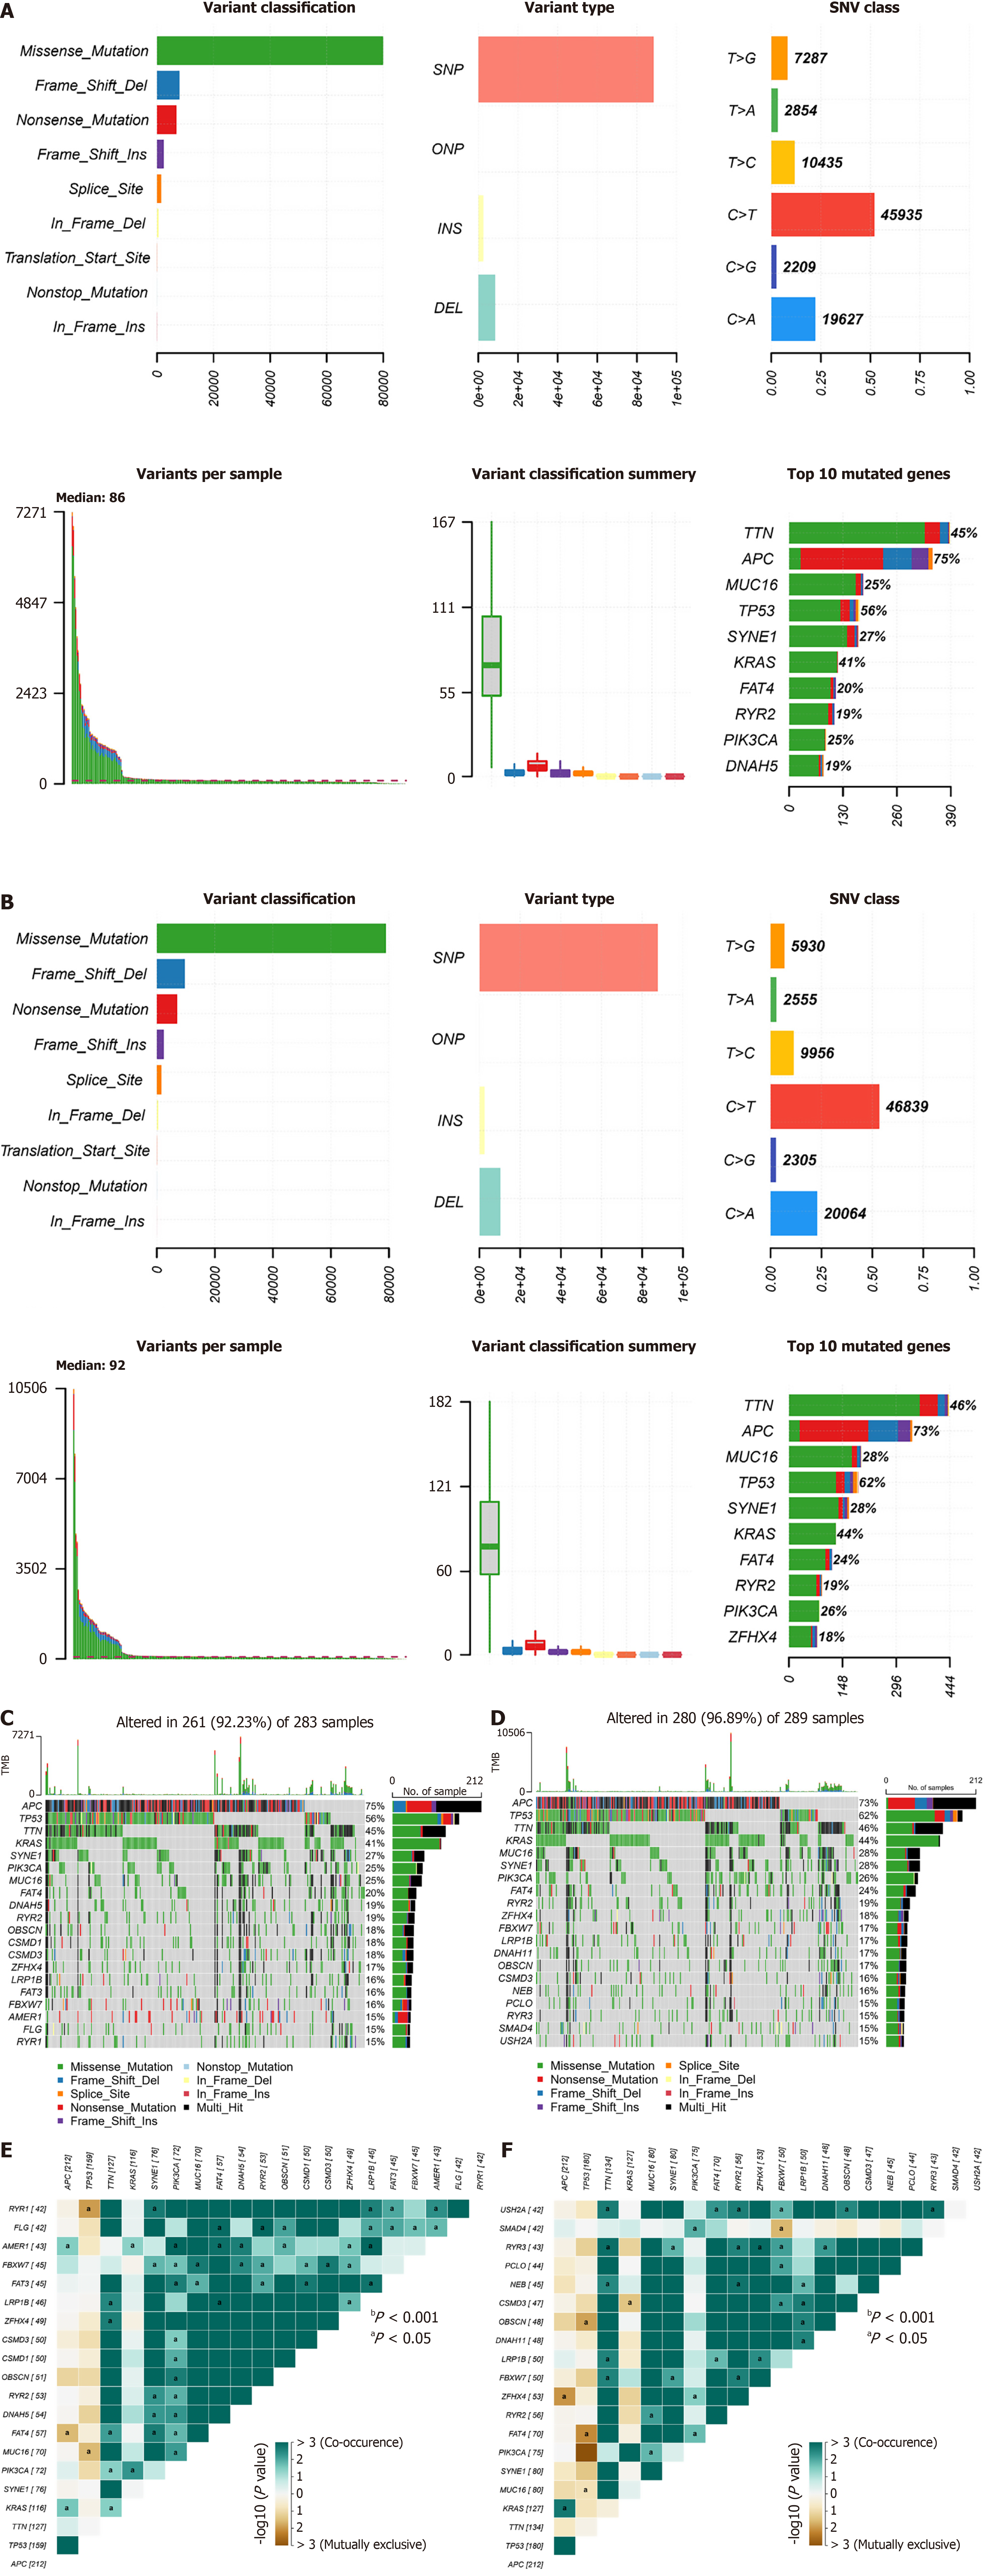
Figure 5 Landscape of mutations in patients in the risk score subgroups.
A: Distribution of single nucleotide variant types in tumor samples in the low-risk score group; B: Distribution of single nucleotide variant types in tumor samples in the high-risk score group; C: Most common mutated genes in the low-risk score group and their mutation frequencies in the samples; D: The most common mutated genes in the high-risk score group and their mutation frequencies in the samples; E: Analysis of the relationships between cooccurring genes and mutually exclusive genes in the low-risk score group; F: Analysis of gene cooccurrences and mutually exclusive relationships in the high-risk score group. aP < 0.05. SNV: Single nucleotide variant; SNP: Single nucleotide polymorphisms; ONP: Oligonucleotide polymorphism; INS: Insertion; DEL: Deletion; TMB: Tumor mutation burden.
Figure 6 Sensitivity to small molecule drugs.
A: Half-maximal inhibitory concentration (IC50) of AZD6482 in the high- and low-risk score groups; B: IC50 of tozasertib in the high- and low-risk score groups; C: IC50 of SB216763 in the high- and low-risk score groups. aP < 0.05, dP < 0.0001, denote significant difference from the low-risk score groups. IC50: Half-maximal inhibitory concentration.
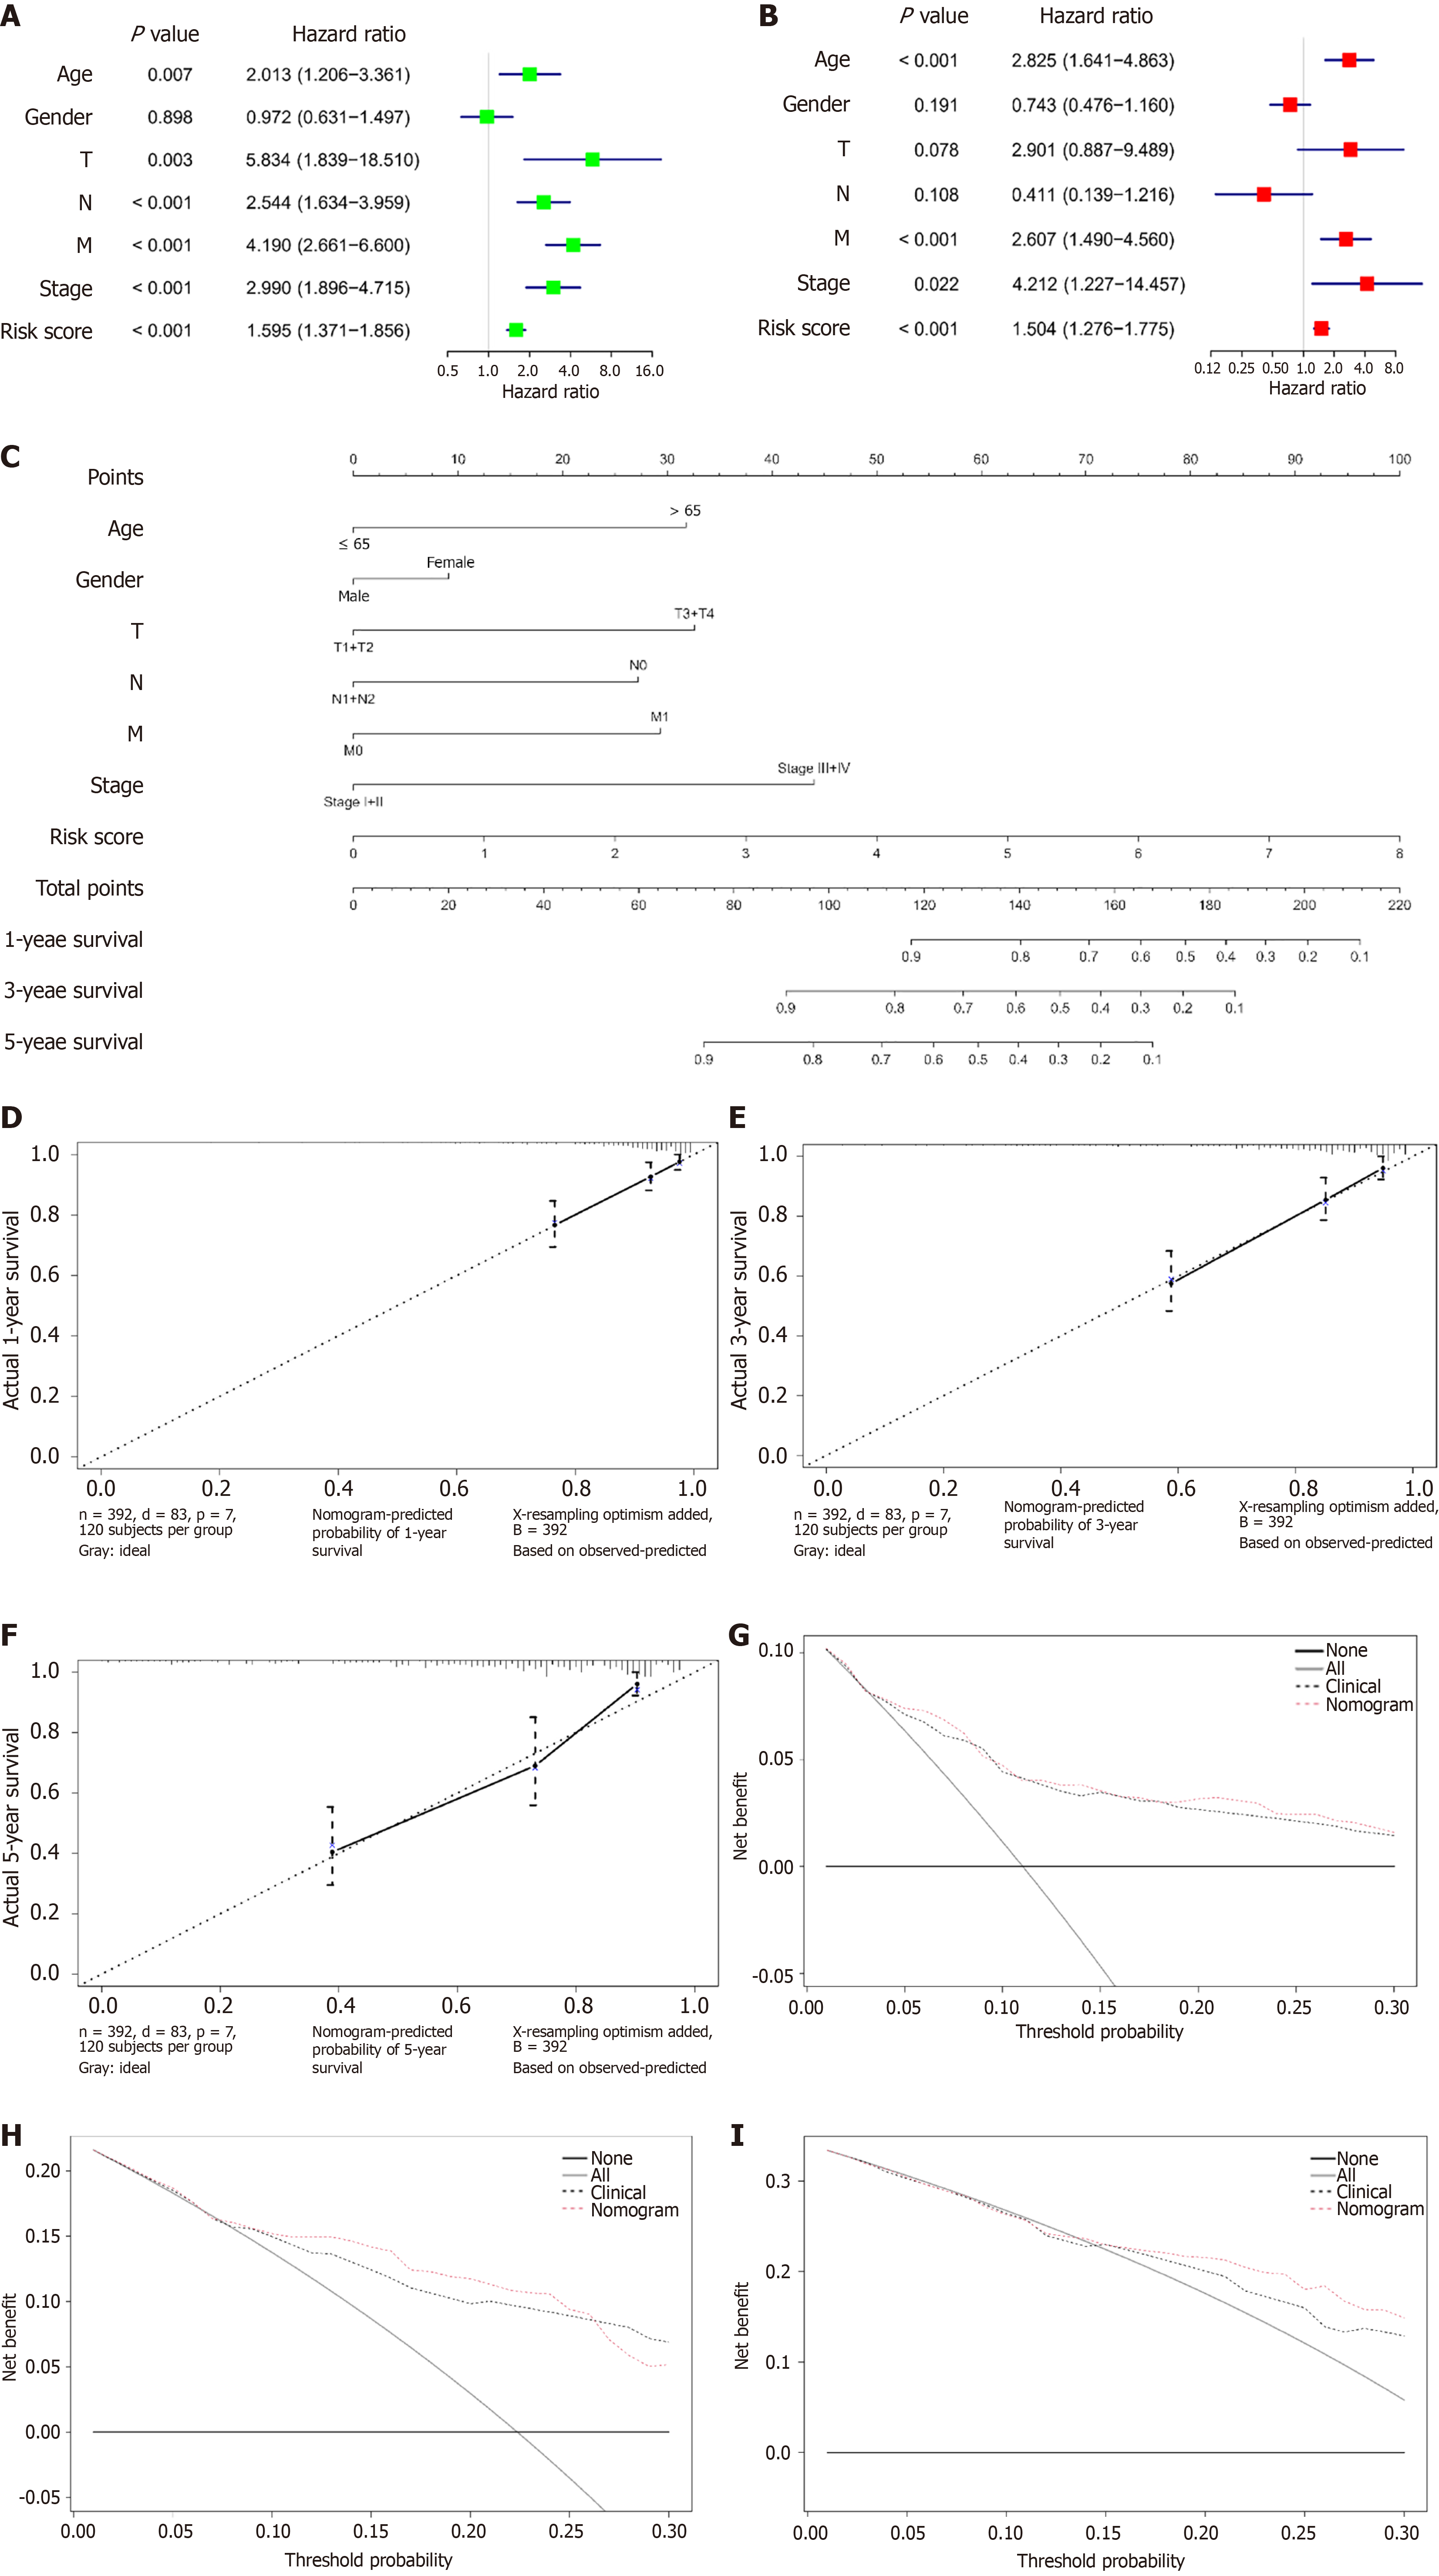
Figure 7 Nomogram model for predicting survival in colorectal cancer patients.
A: Forest plot of univariate Cox analysis combining clinical information and the risk score in The Cancer Genome Atlas database-colon and rectal adenocarcinomas cohort; B: Forest plot of multivariate Cox analysis combining clinical information and the risk score in The Cancer Genome Atlas database-colon and rectal adenocarcinomas cohort; C: Nomogram model constructed by integrating clinical information and the risk score; D: Calibration curve for 1-year survival; E: Calibration curve for 3-year survival; F: Calibration curve for 5-year survival; G: Decision curve for 1-year survival; H: Decision curve for 3-year survival; I: Decision curve for 5-year survival. T: Tumor; N: Node; M: Metastasis.
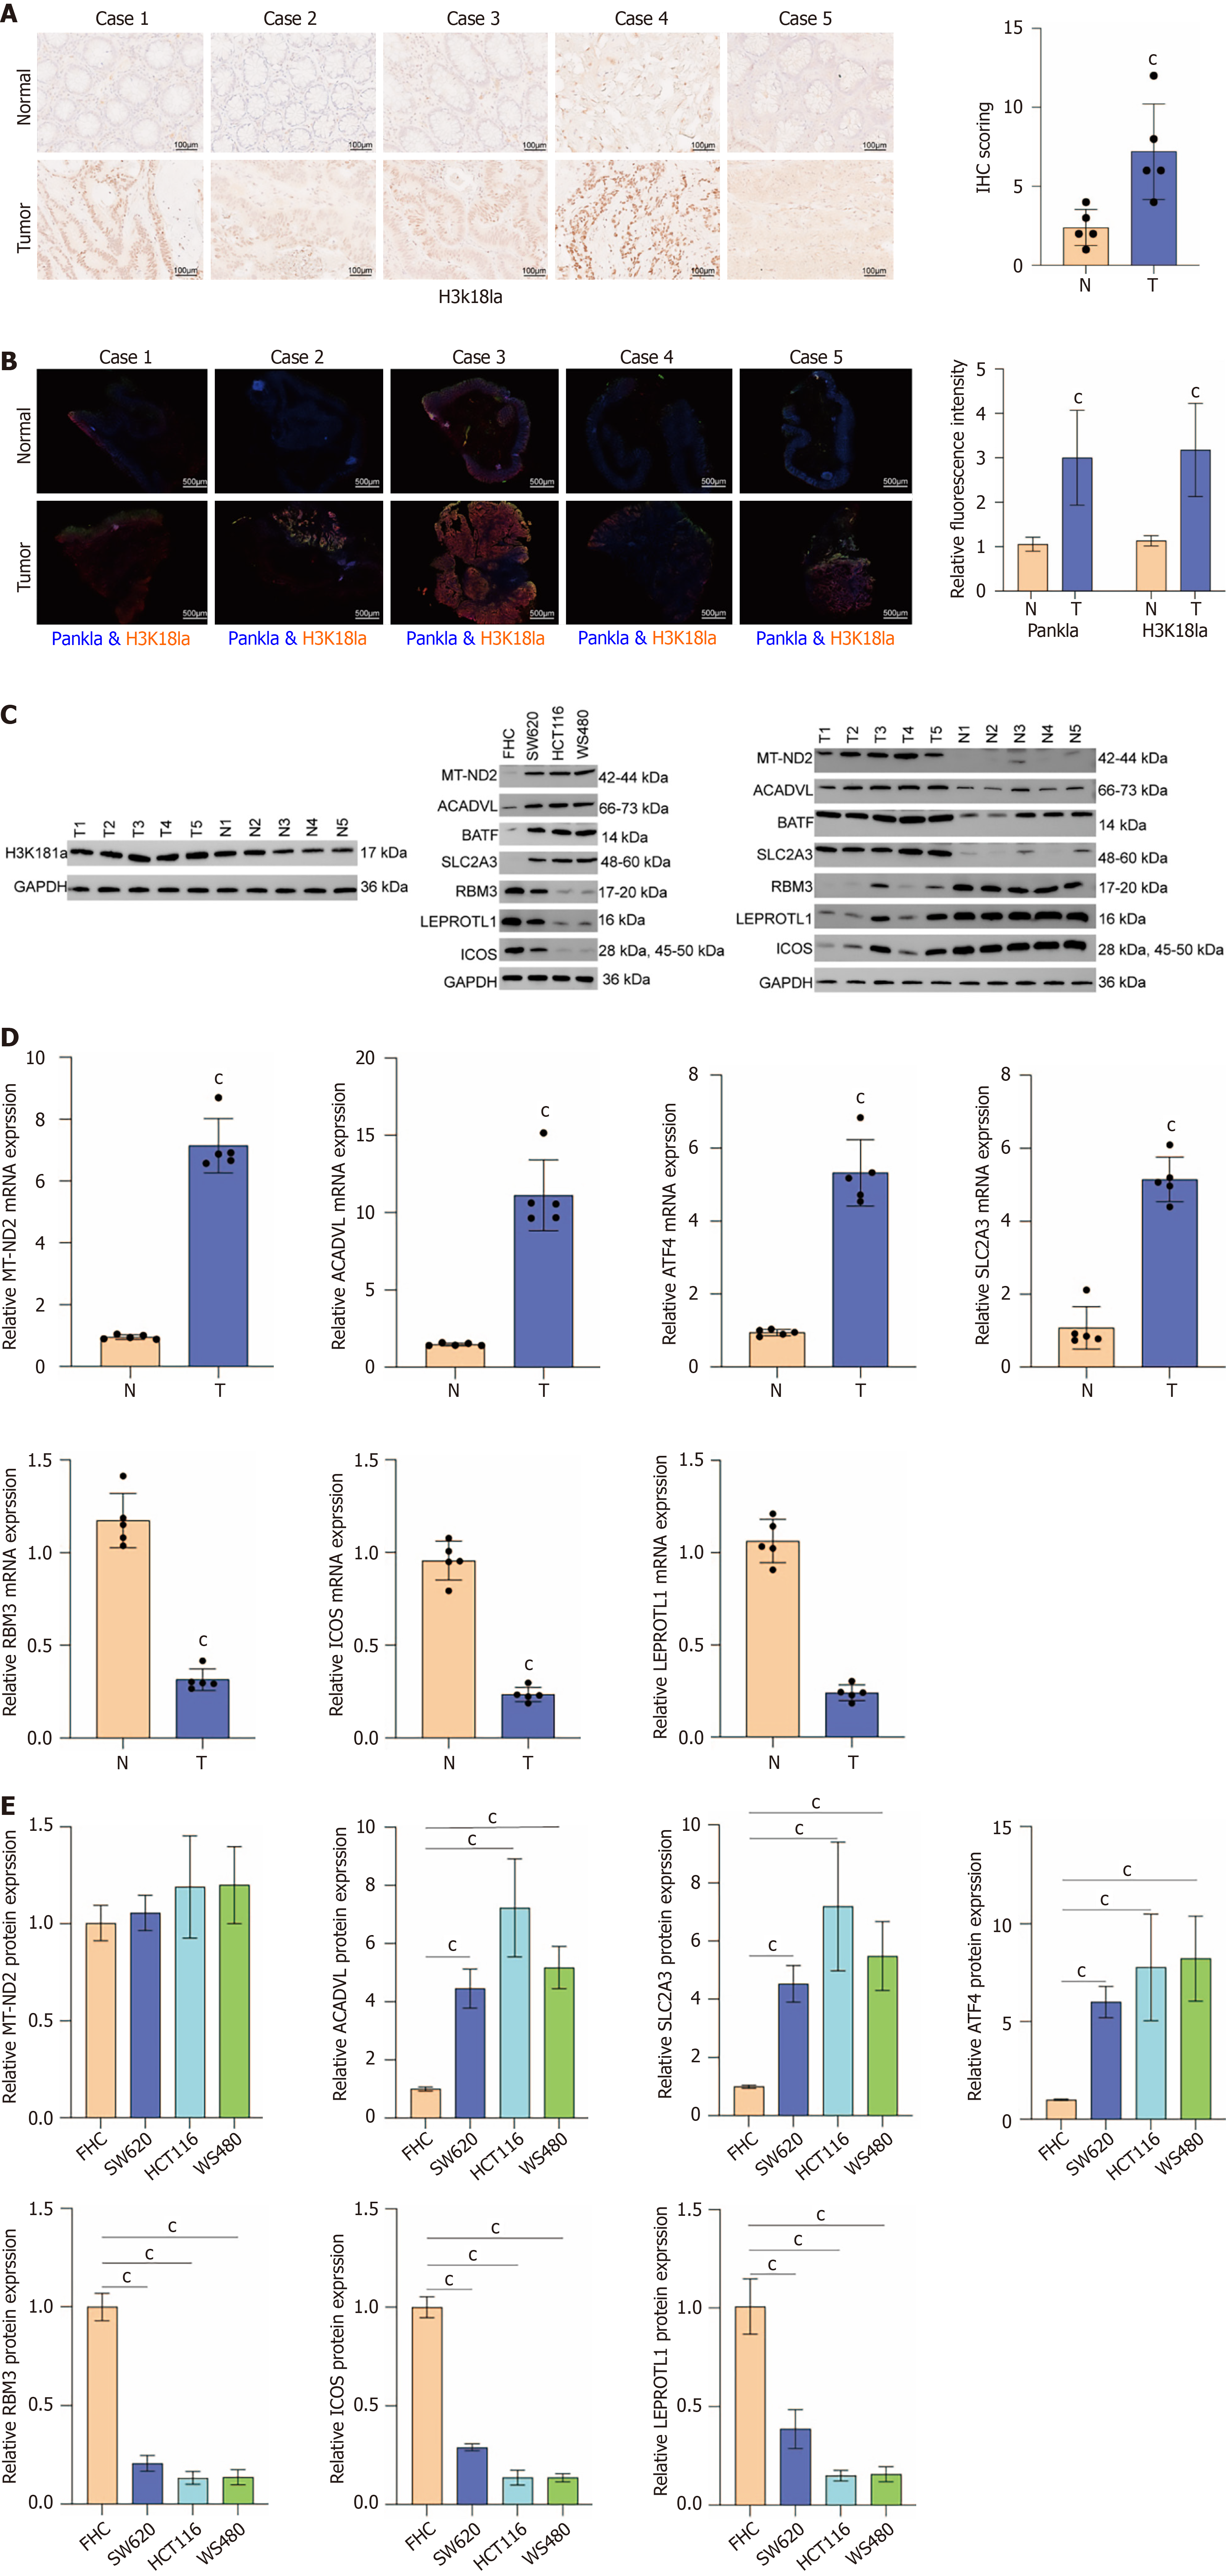
Figure 8 Expression levels of biomarkers in colorectal cancer.
A: Immunohistochemistry results demonstrating the expression level of histone H3 lysine 18 lactylation in colorectal cancer (CRC) tissues and paracancerous tissues; B: Immunofluorescence results of histone H3 lysine 18 lactylation levels in tumor tissues and paracancerous tissues; C: Western blot results demonstrating the protein expression levels of mitochondrial-dihydronicotinamide adenine dinucleotide dehydrogenase subunit 2 (MT-ND2), acyl-CoA dehydrogenase very-long-chain (ACADVL), solute carrier family 2 member 3 (SLC2A3), basic leucine zipper transcription factor ATF-like (BATF), RNA binding motif protein 3 (RBM3), inducible T cell costimulatory (ICOS), leptin receptor overlapping transcript-like 1 (LEPROTL1) in CRC tissues/paracancerous tissues, and normal colon cell/CRC cell lines (SW620, HCT116, WS480); D: The quantitative real-time fluorescence polymerase chain reaction results demonstrating the expression levels of MT-ND2, ACADVL, SLC2A3, BATF, RBM3, ICOS, and LEPROTL1 in CRC tissues and paracancerous tissues; E: The quantitative real-time fluorescence polymerase chain reaction results demonstrate the expression levels of MT-ND2, ACADVL, SLC2A3, BATF, RBM3, ICOS, and LEPROTL1 in normal colon cell and CRC cell lines (SW620, HCT116, WS480). cP < 0.001, compared with normal group. H3K18 La: Histone H3 lysine 18 lactylation; MT-ND2: Mitochondrial-dihydronicotinamide adenine dinucleotide dehydrogenase subunit 2; ACADVL: Acyl-CoA dehydrogenase very-long-chain; SLC2A3: Solute carrier family 2 member 3; BATF: Basic leucine zipper transcription factor ATF-like; RBM3: RNA binding motif protein 3; ICOS: Inducible T cell costimulatory; LEPROTL1: Leptin receptor overlapping transcript-like 1; FHC: Normal colon cells.
- Citation: Wang XP, Zhu JX, Liu C, Zhang HW, Sun GD, Zhai JM, Yang HJ, Liu DC. Deciphering lactate metabolism in colorectal cancer: Prognostic modeling, immune infiltration, and gene mutation insights. World J Gastroenterol 2025; 31(25): 107478
- URL: https://www.wjgnet.com/1007-9327/full/v31/i25/107478.htm
- DOI: https://dx.doi.org/10.3748/wjg.v31.i25.107478


