©The Author(s) 2025.
World J Gastroenterol. Jul 7, 2025; 31(25): 106371
Published online Jul 7, 2025. doi: 10.3748/wjg.v31.i25.106371
Published online Jul 7, 2025. doi: 10.3748/wjg.v31.i25.106371
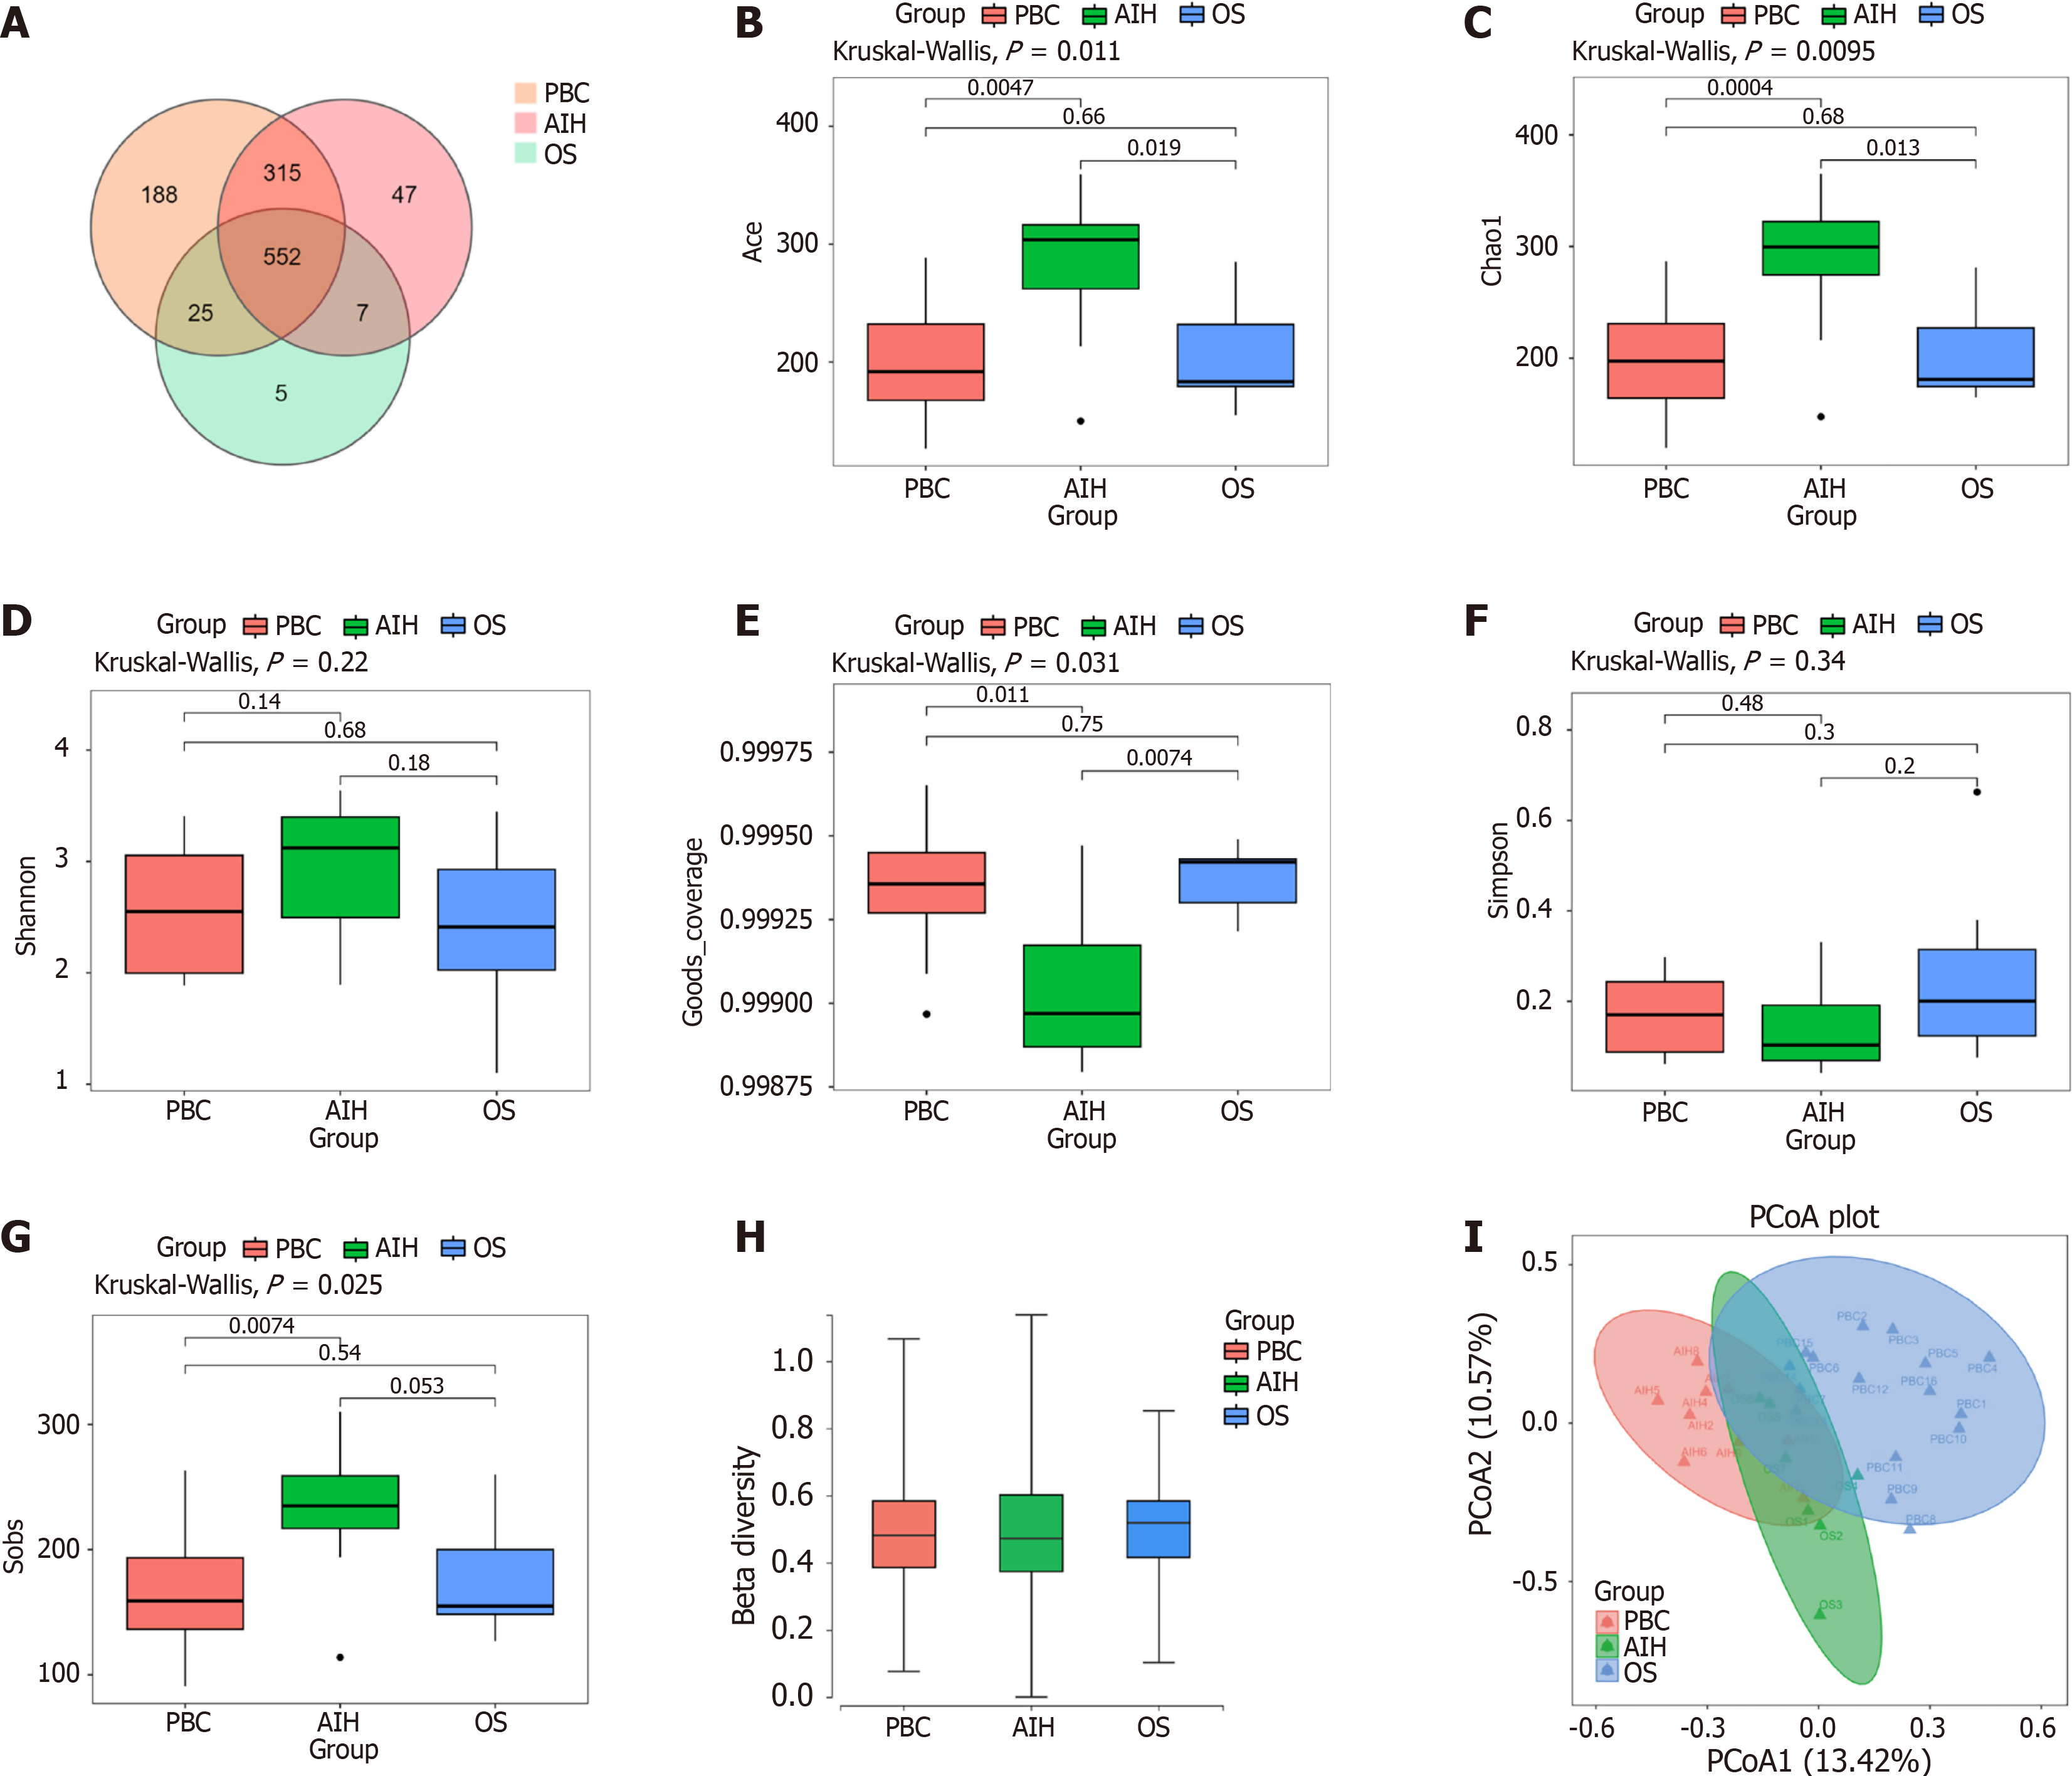
Figure 1 Alterations in gut microbial richness and diversity in primary biliary cholangitis, autoimmune hepatitis, and overlap syndrome patients.
A: Venn diagram; B: ACE index; C: Chao1 index; D: Shannon index; E: Good coverage metric; F: Simpson index; G: Sobs; H: Boxplot visualization of β-diversity differences; I: Principal coordinates analysis plot. PBC: Primary biliary cholangitis; AIH: Autoimmune hepatitis; OS: Overlap syndrome; PCoA: Principal coordinates analysis.
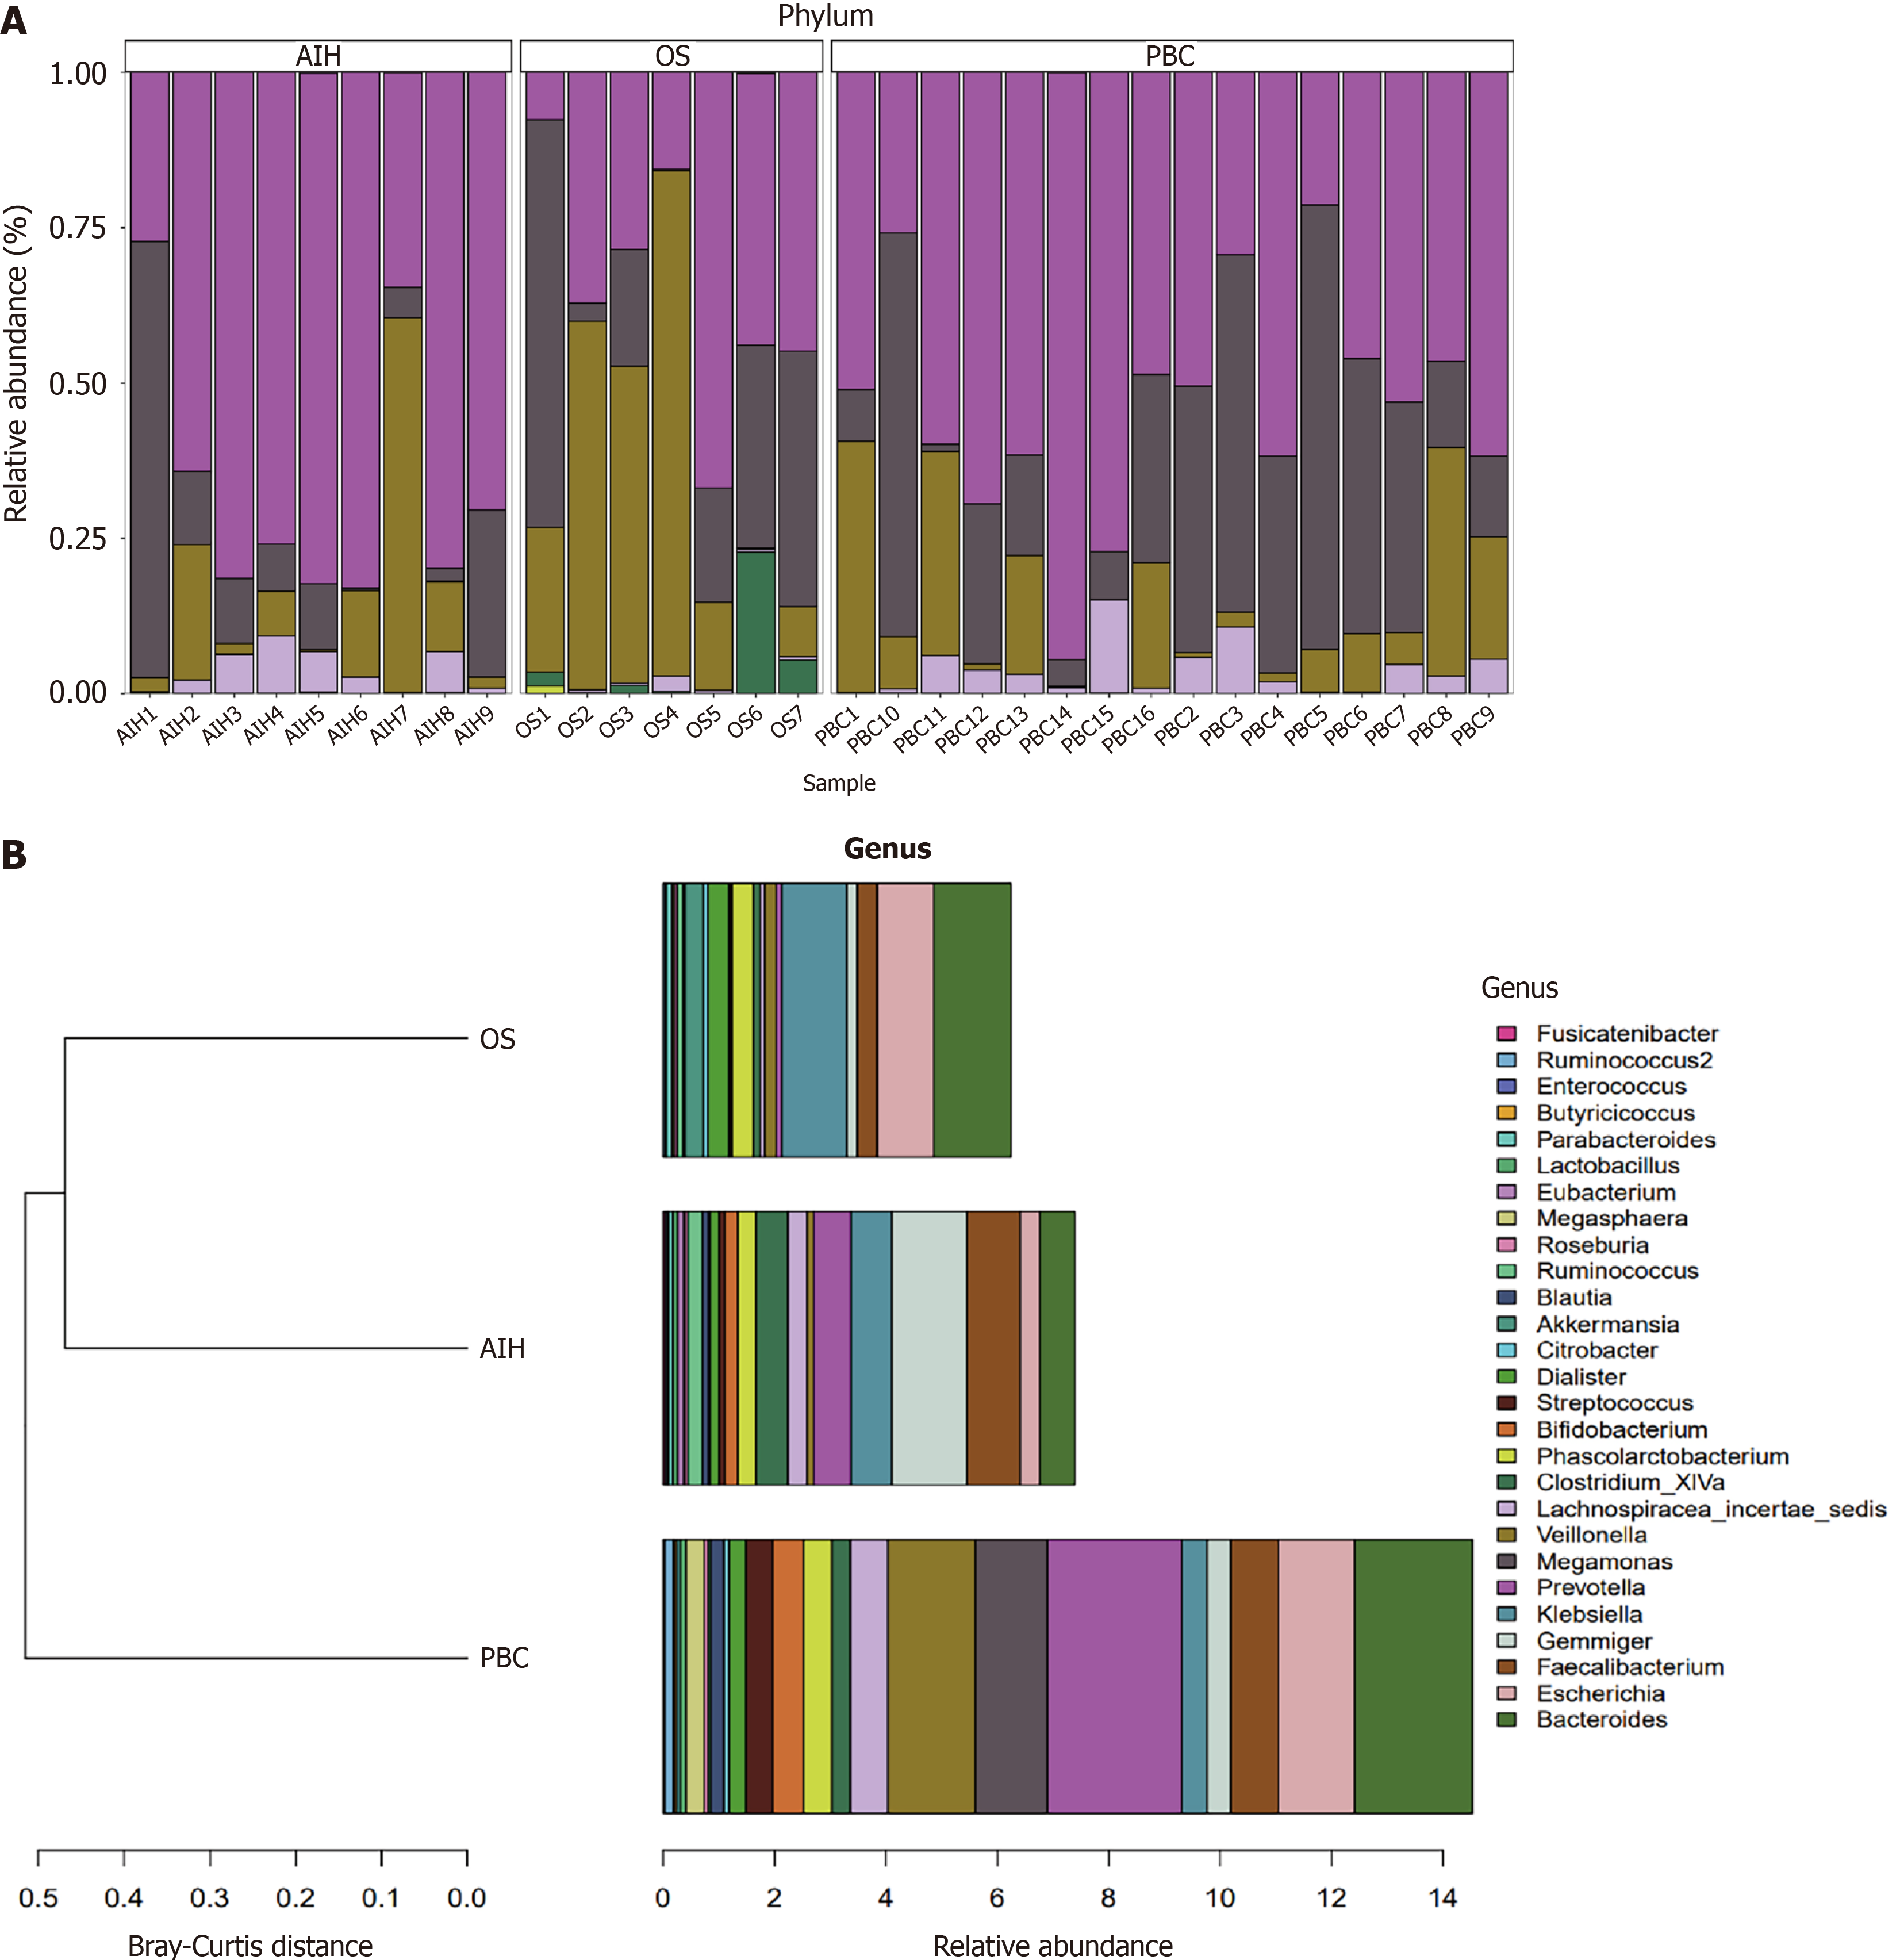
Figure 2 Alterations in microbial structure and composition among primary biliary cholangitis, autoimmune hepatitis, and overlap syndrome patients.
A: Phylum level; B: Genus level. PBC: Primary biliary cholangitis; AIH: Autoimmune hepatitis; OS: Overlap syndrome.
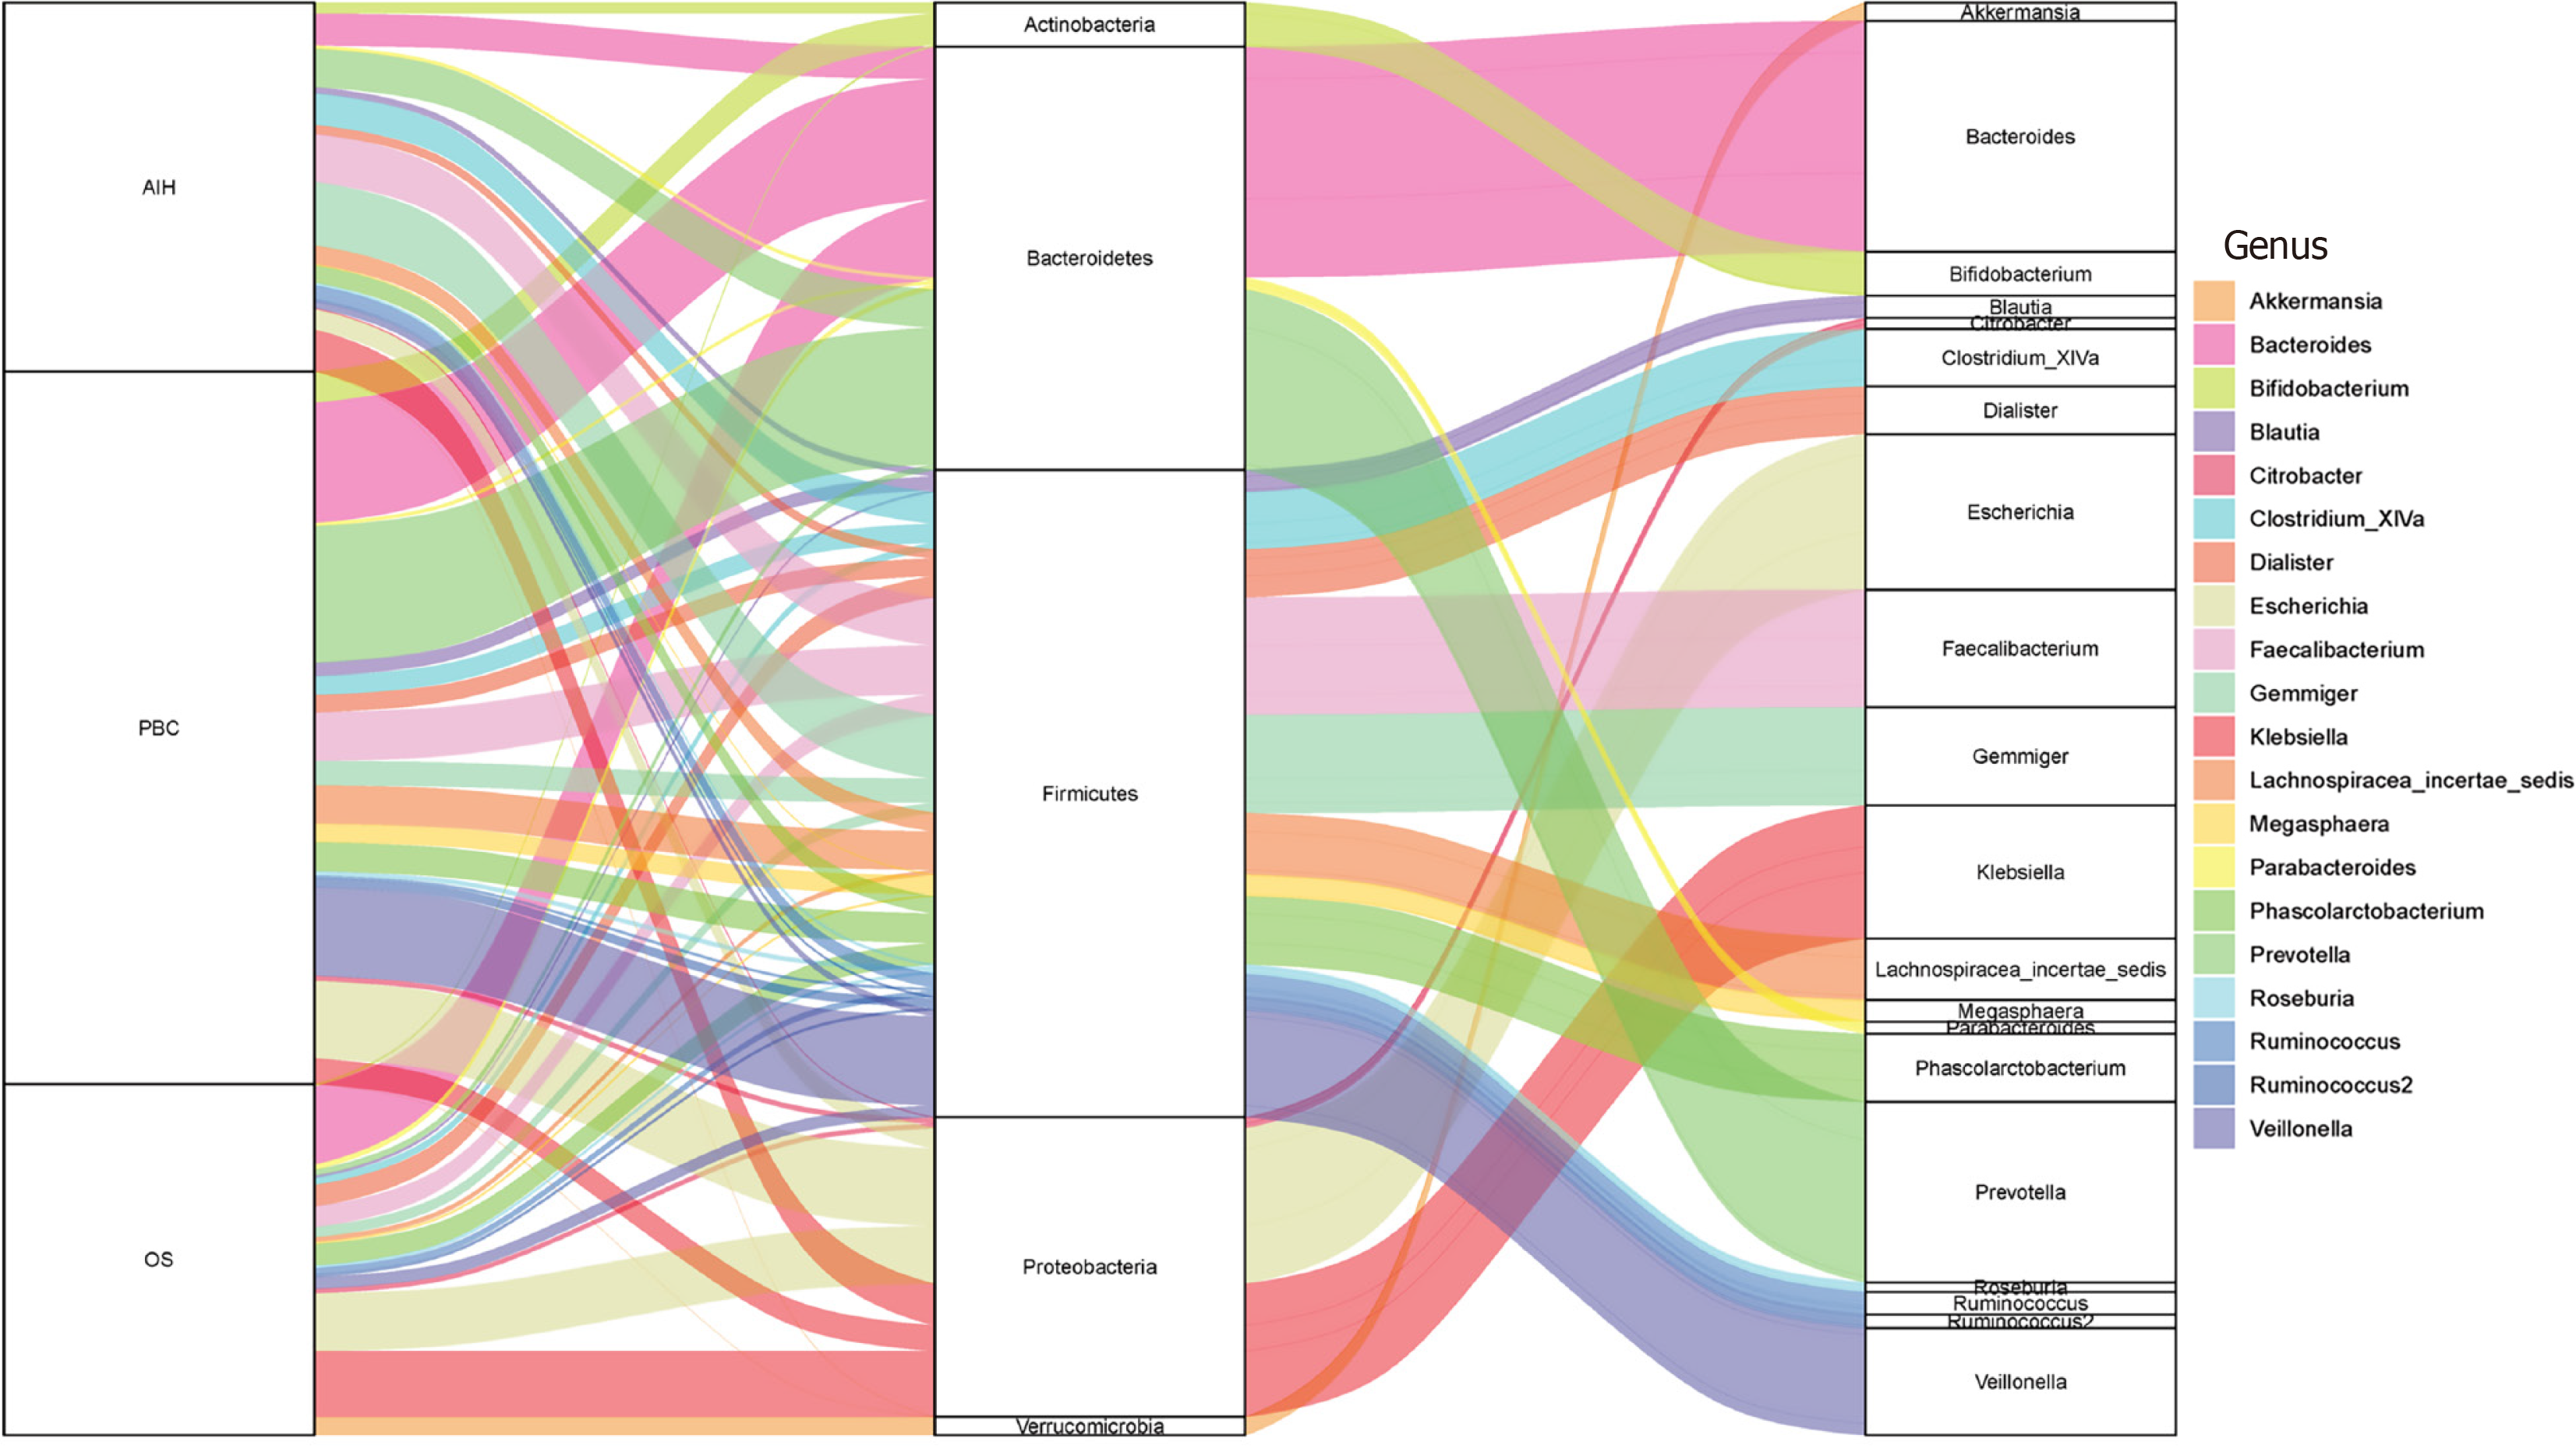
Figure 3 Sankey diagram depicting microbial taxonomic shifts (phylum to genus) in three disease groups.
Flow width corresponds to relative abundance. PBC: Primary biliary cholangitis; AIH: Autoimmune hepatitis; OS: Overlap syndrome.
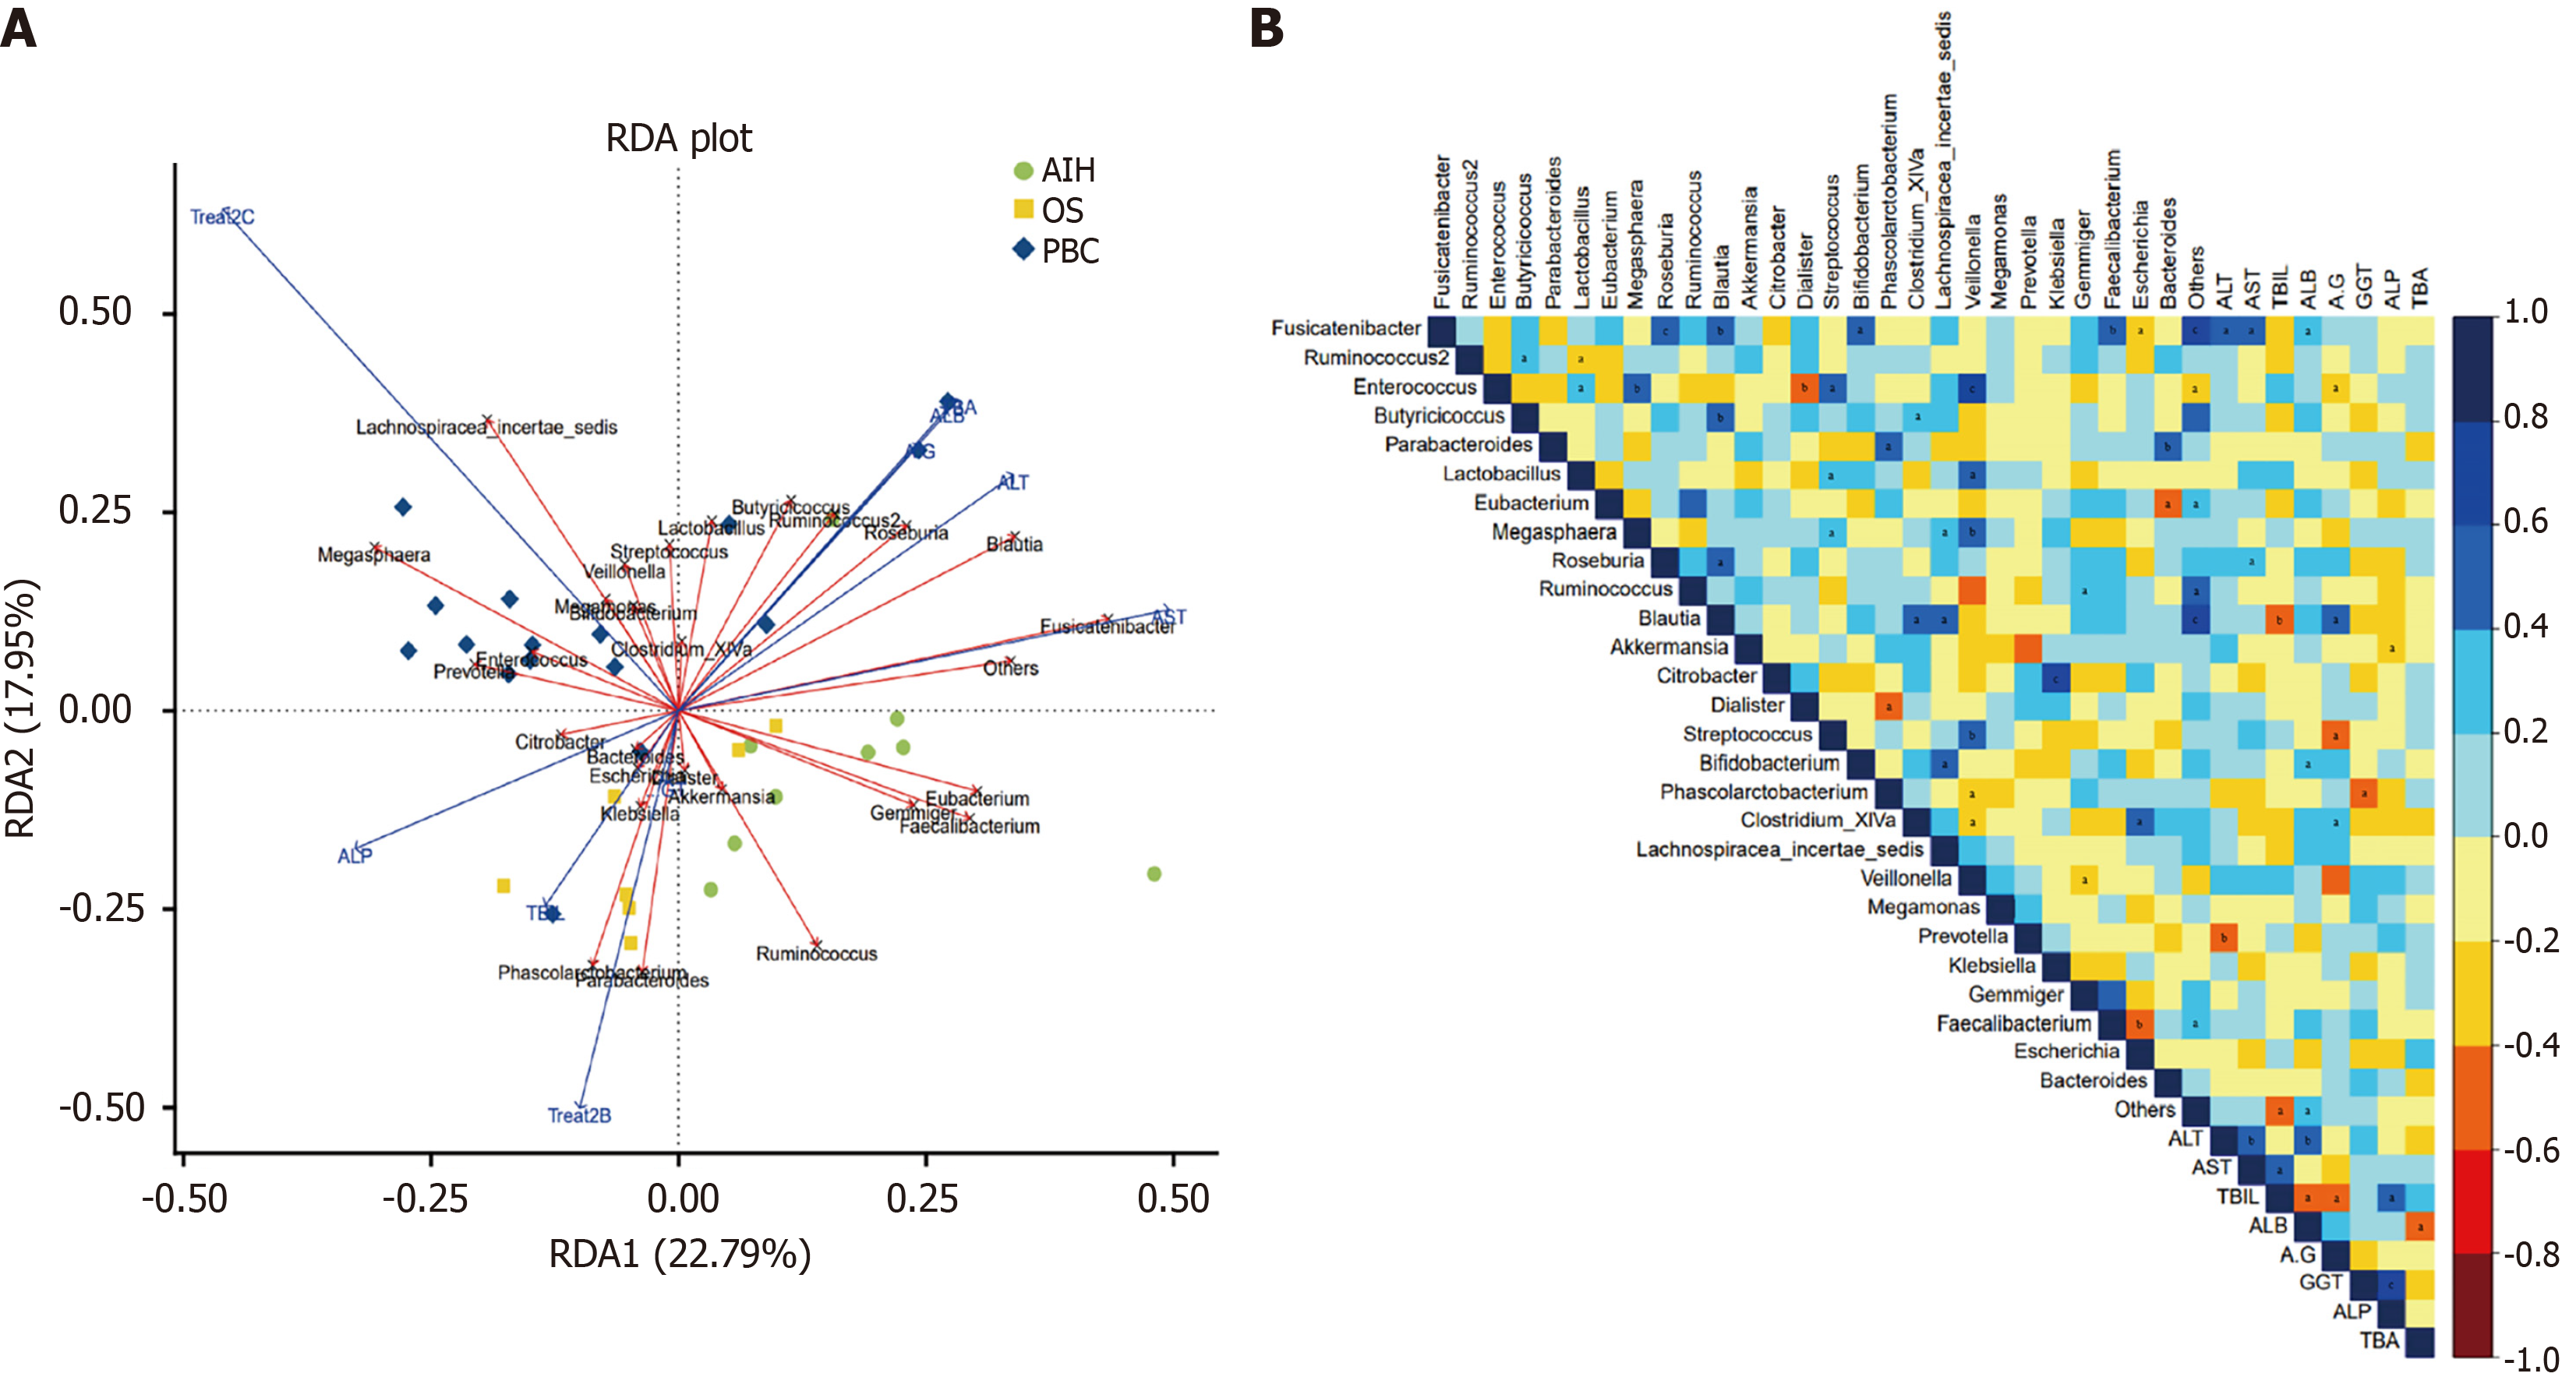
Figure 4 The correlation between the gut microbial communities and liver function.
A: Redundancy analysis across three groups; B: Heatmap in overlap syndrome patients. aP < 0.05. bP < 0.01. cP < 0.001. RDA: Redundancy analysis; PBC: Primary biliary cholangitis; AIH: Autoimmune hepatitis; OS: Overlap syndrome; ALT: Alanine aminotransferase; AST: Aspartate aminotransferase; TBIL: Total bilirubin; ALB: Albumin; GGT: Gamma-glutamyl transferase; ALP: Alkaline phosphatase; TBA: Total bile acid; TG: Triglyceride.
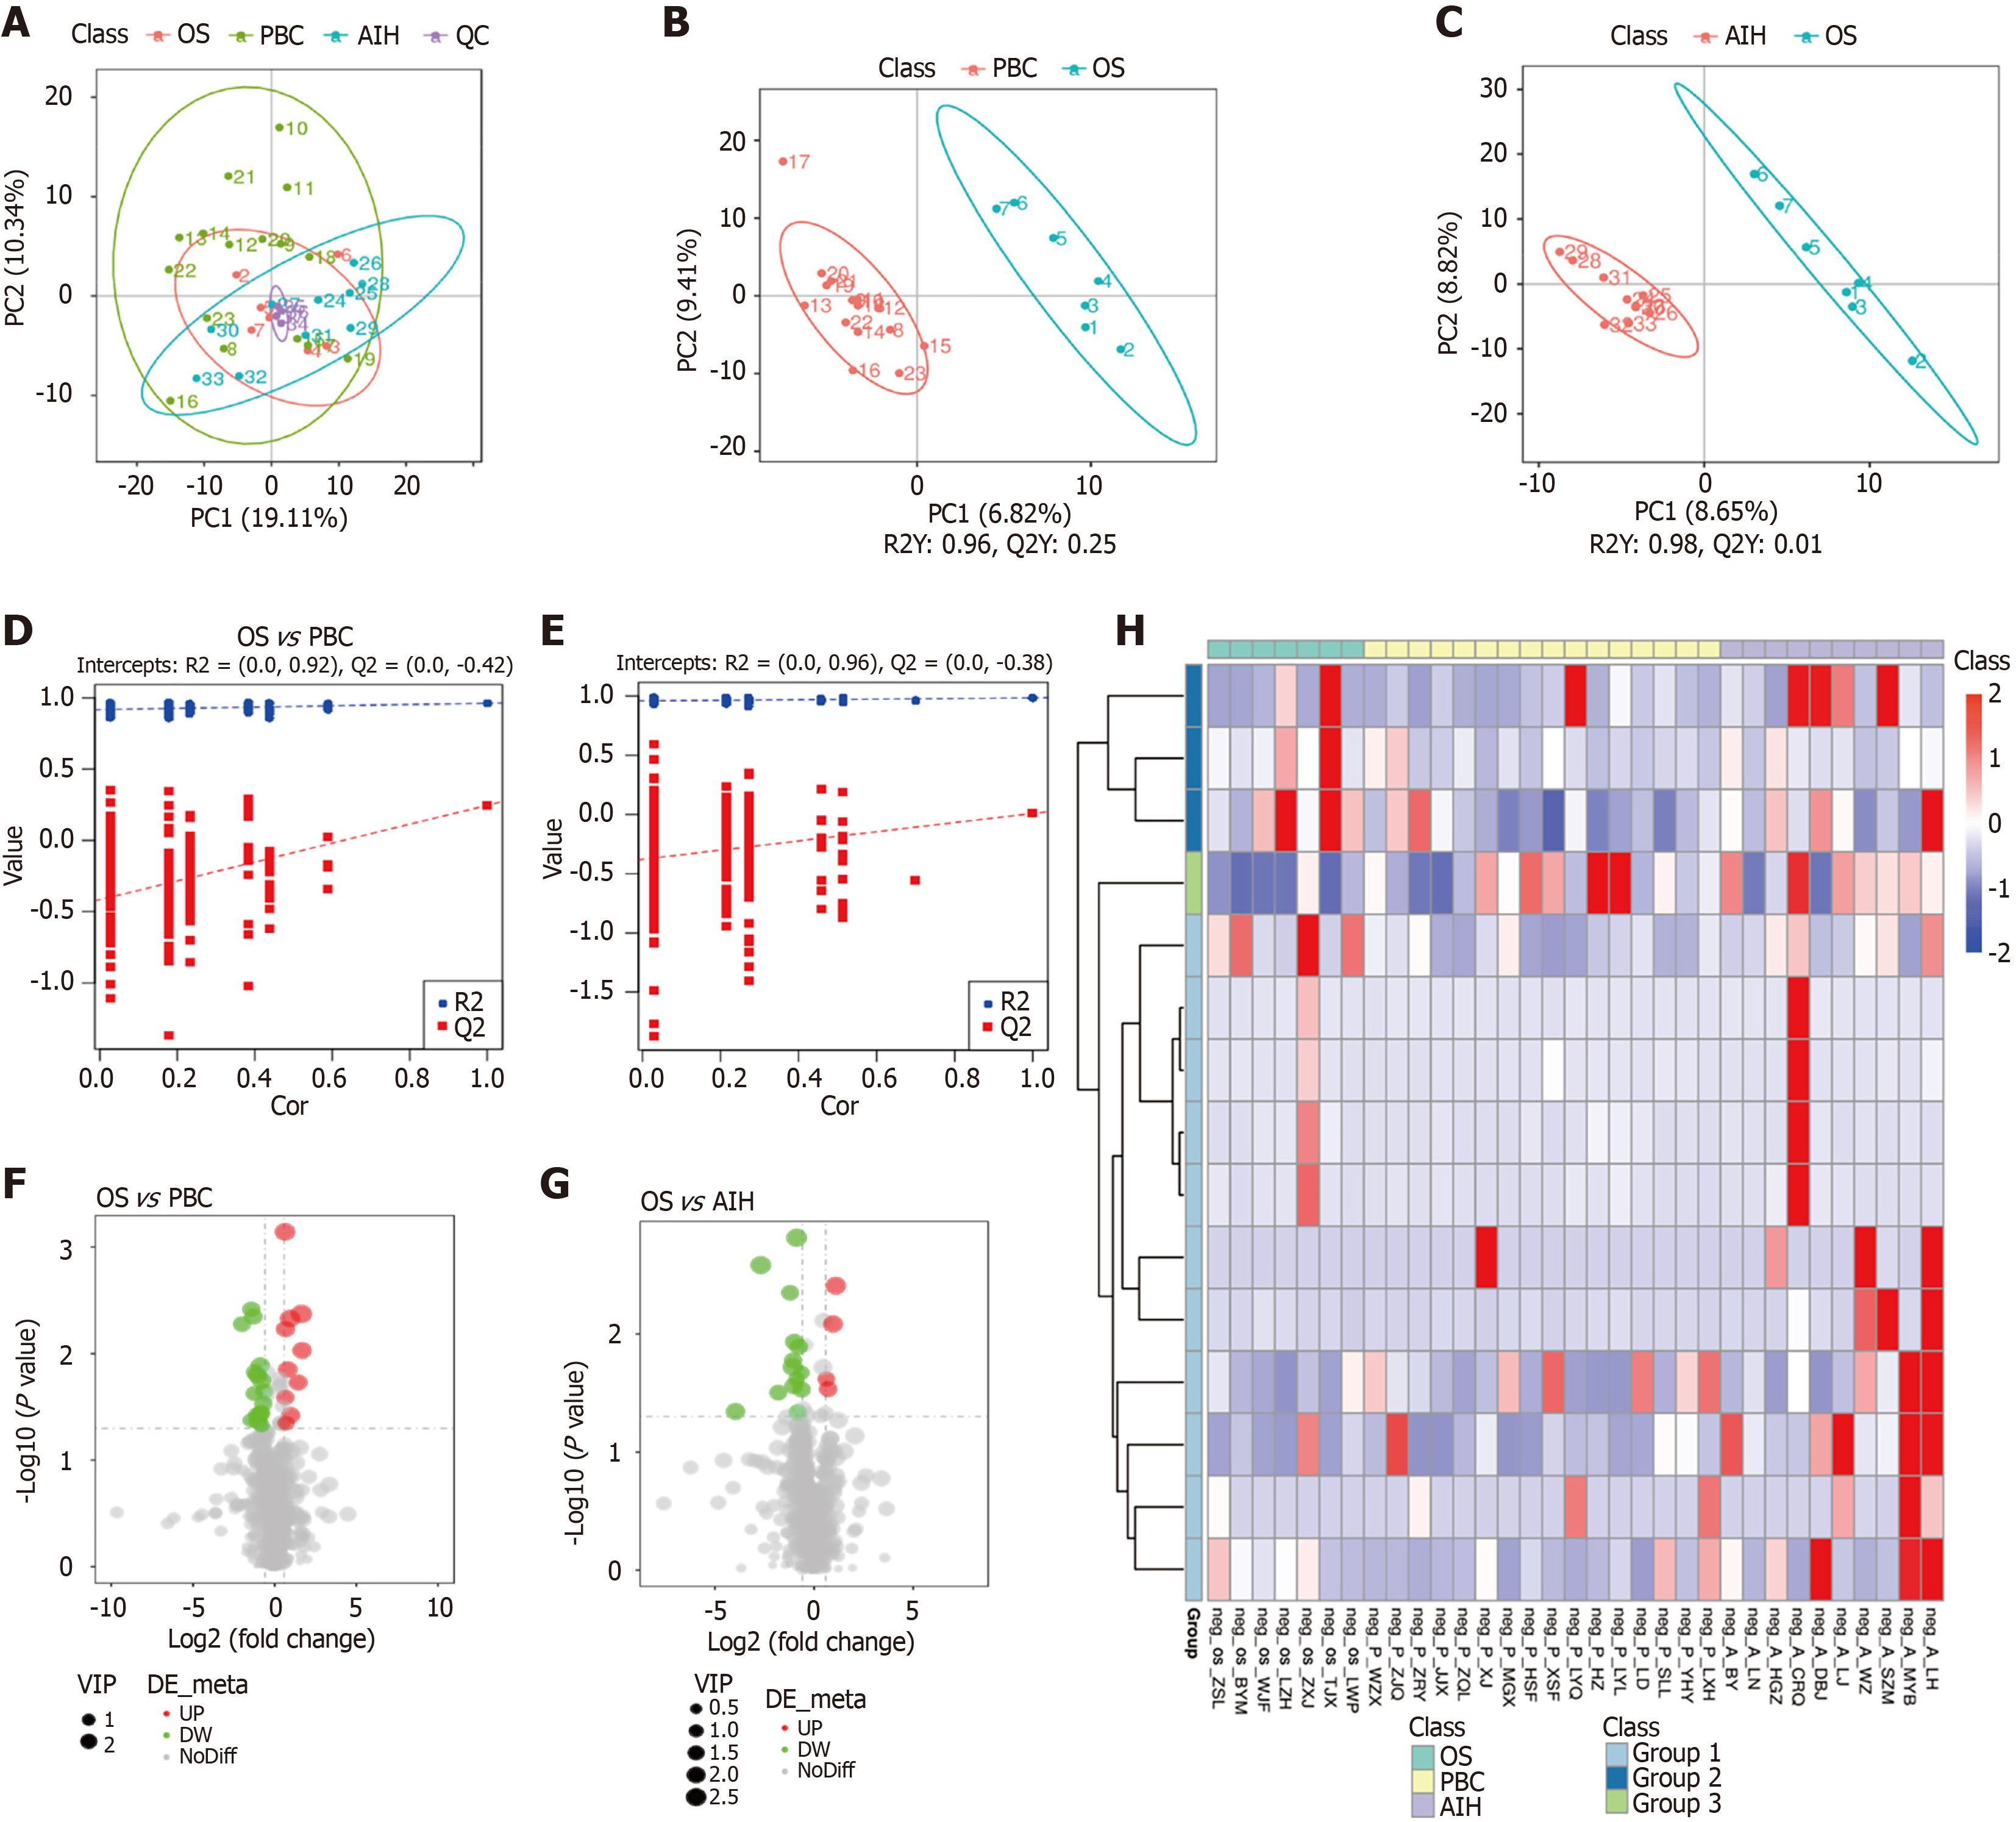
Figure 5 Serum metabolomic characteristics of three groups.
A: Principal component analysis score plot; B: Orthogonal partial least squares-discriminant analysis (OPLS-DA) for primary biliary cholangitis (PBC) and overlap syndrome (OS); C: OPLS-DA for autoimmune hepatitis (AIH) and OS; D: Assessment of predictive performance and stability of (B); E: Assessment of predictive performance and stability of (D); F: Volcano plot for PBC and OS; G: Volcano plot for AIH and OS; H: Sample clustering heatmap for PBC, AIH, and OS. PBC: Primary biliary cholangitis; AIH: Autoimmune hepatitis; OS: Overlap syndrome; PC: Principal component; VIP: Variable importance in projection.
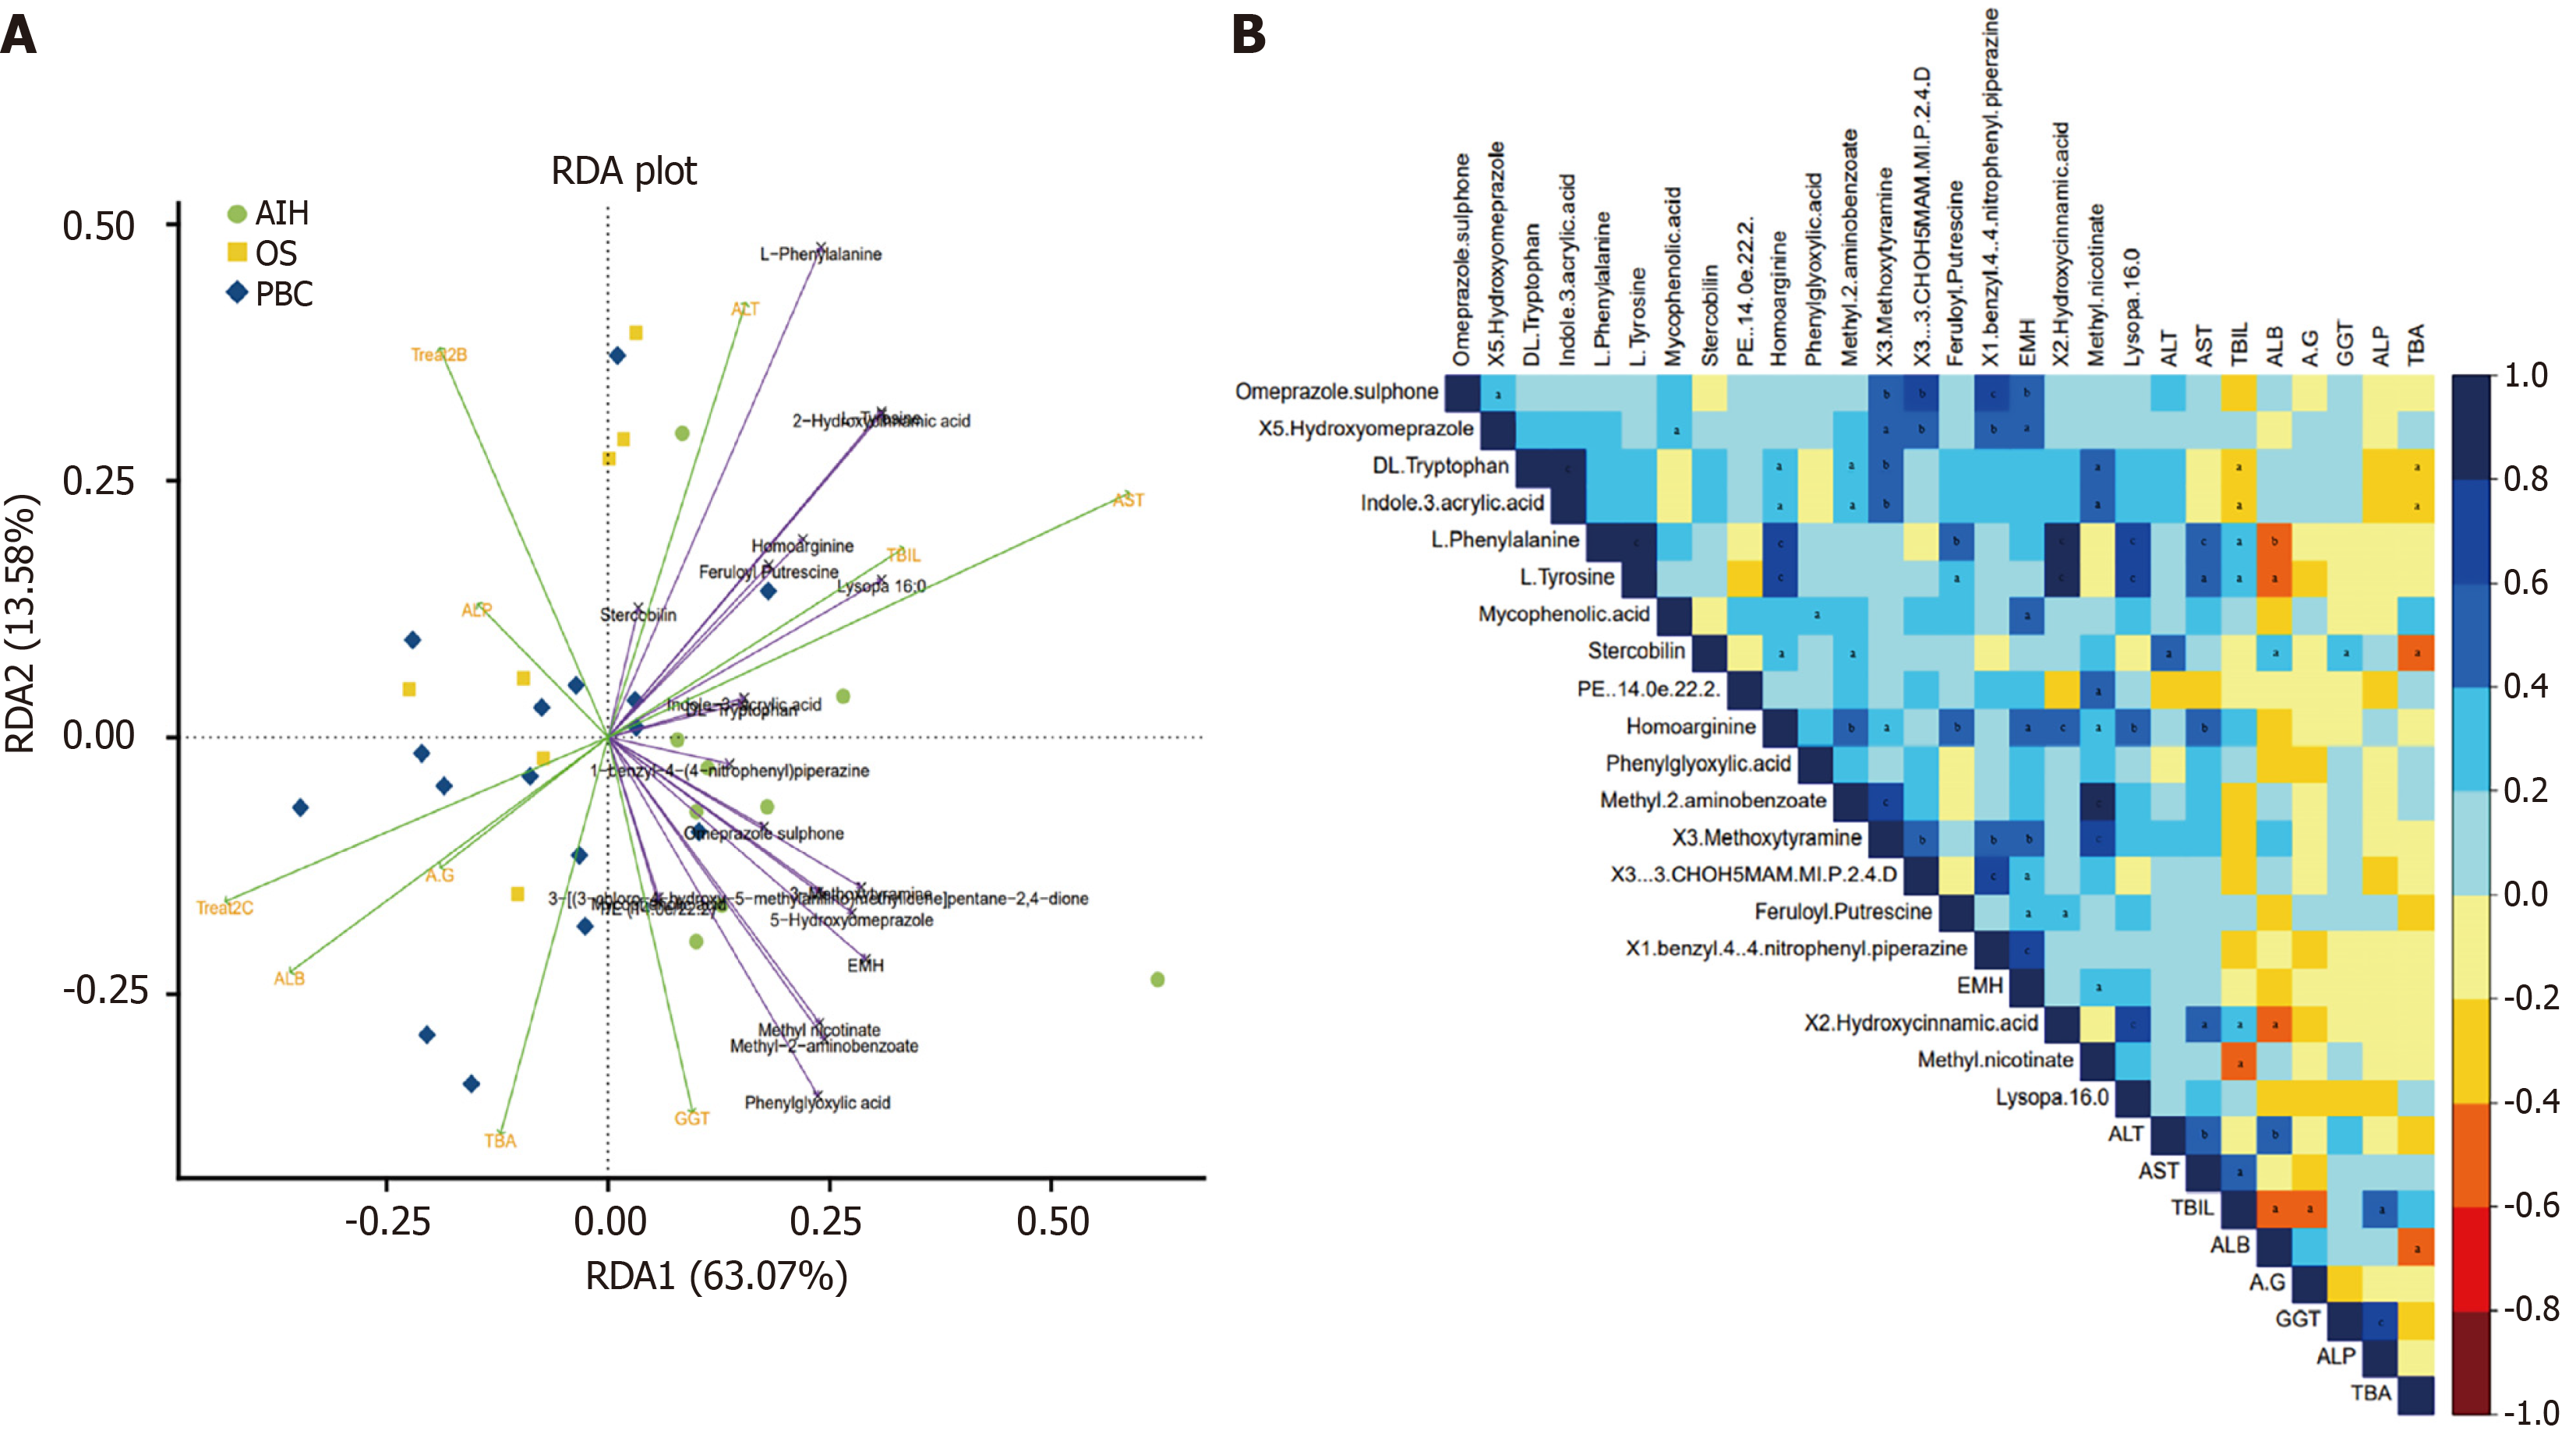
Figure 6 The correlation between the metabolisms and liver function.
A: Redundancy analysis for three groups; B: Heatmap for overlap syndrome patients. aP < 0.05. bP < 0.01. cP < 0.001. RDA: Redundancy analysis; PBC: Primary biliary cholangitis; AIH: Autoimmune hepatitis; OS: Overlap syndrome; ALT: Alanine aminotransferase; AST: Aspartate aminotransferase; TBIL: Total bilirubin; ALB: Albumin; GGT: Gamma-glutamyl transferase; ALP: Alkaline phosphatase; TBA: Total bile acid; TG: Triglyceride.
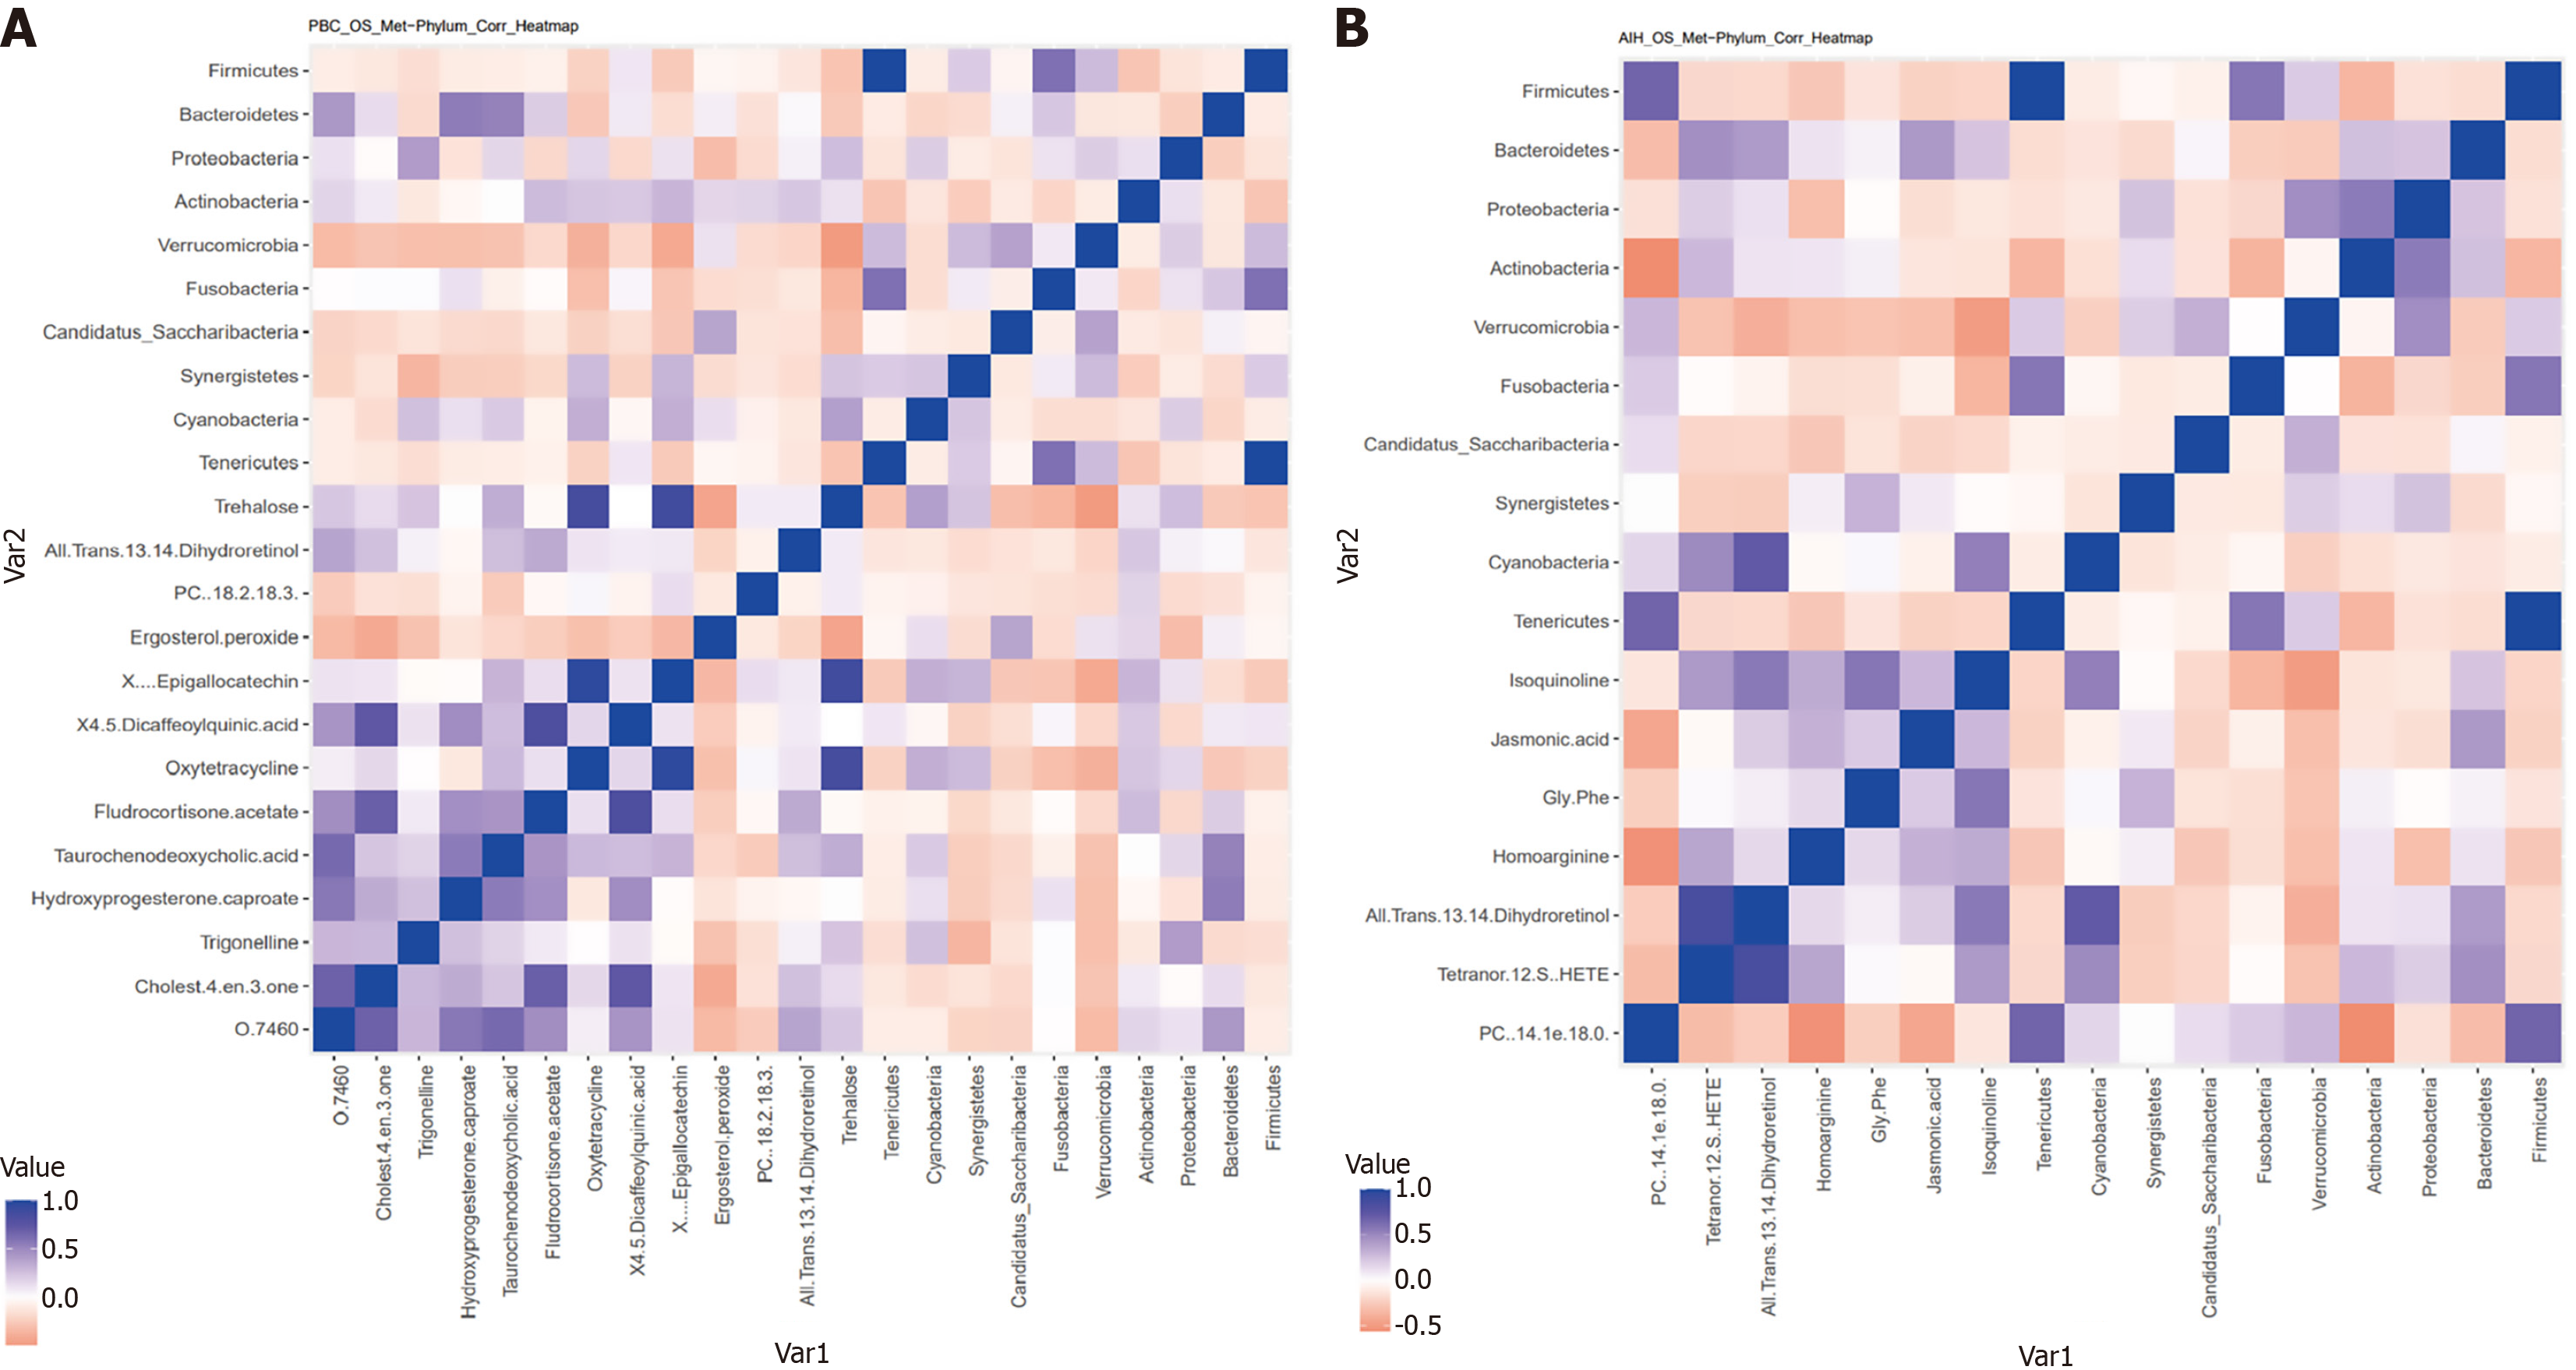
Figure 7 Heatmap showing the correlation between differential microbiota and differential metabolites in overlap syndrome compared to primary biliary cholangitis or autoimmune hepatitis.
A: Compared to primary biliary cholangitis; B: Compared to autoimmune hepatitis. PBC: Primary biliary cholangitis; AIH: Autoimmune hepatitis; OS: Overlap syndrome.
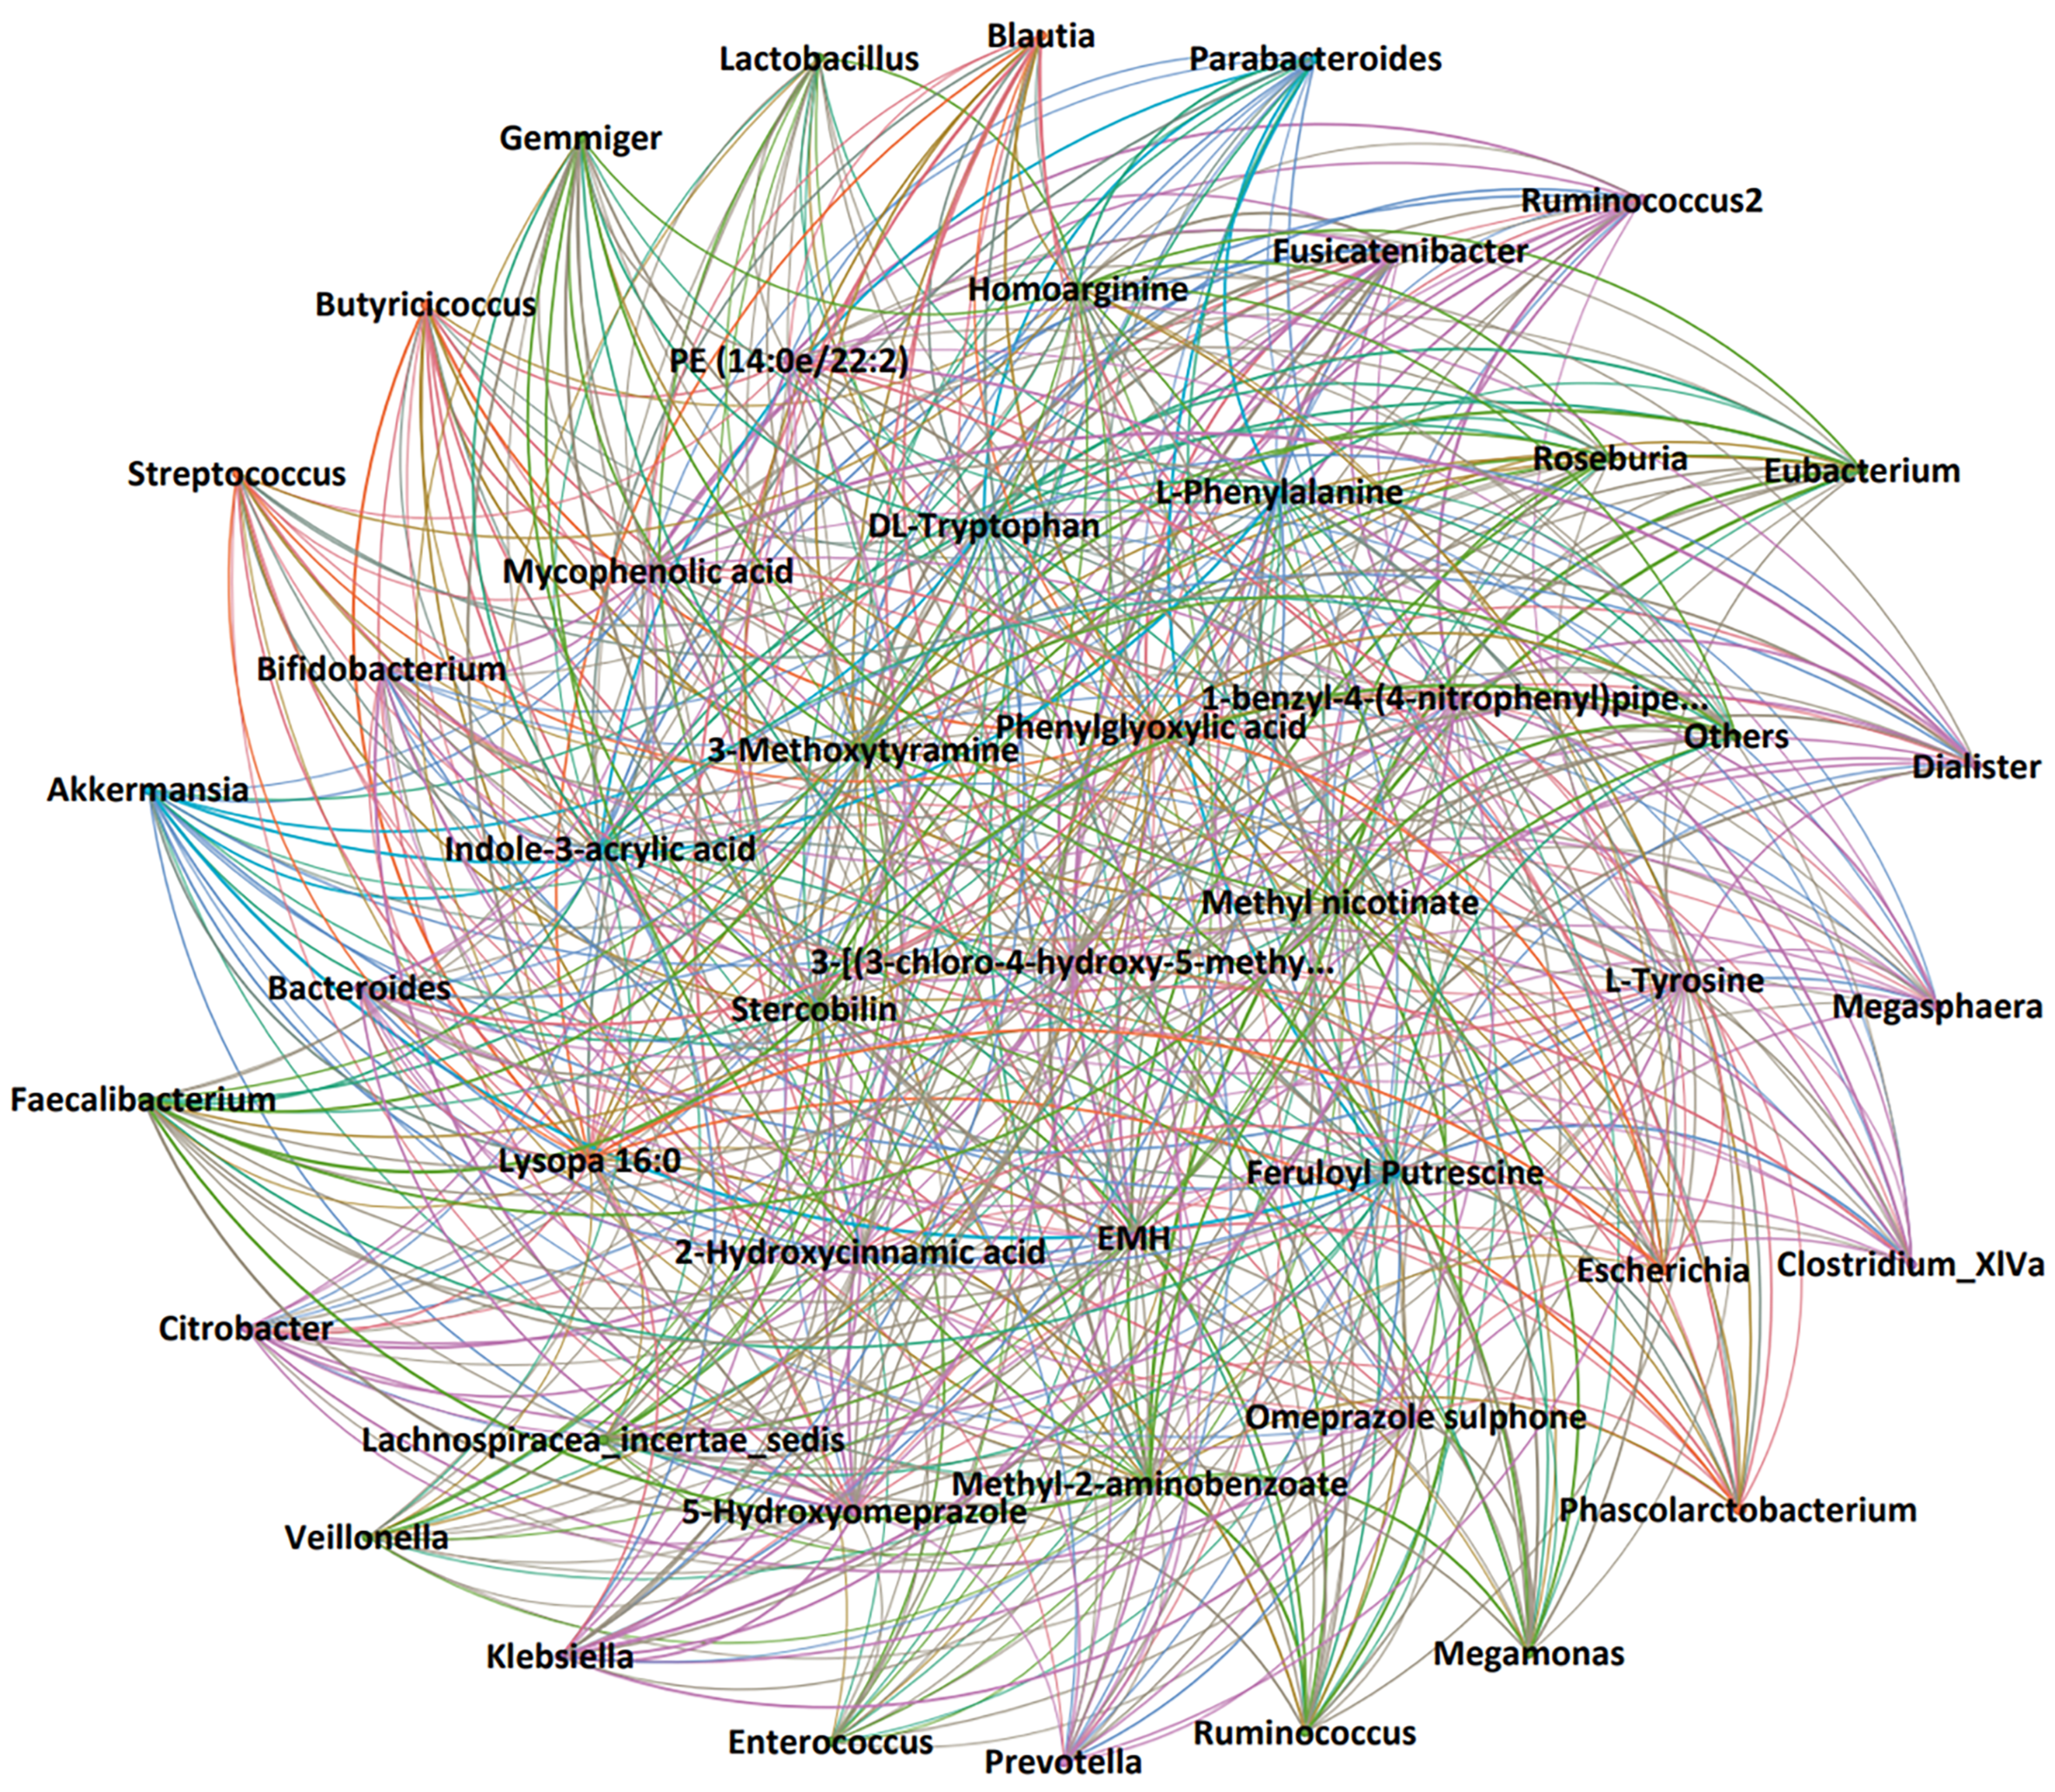
Figure 8 Network diagram of differential metabolite-differential microbiota correlations in overlap syndrome patients.
OS: Overlap syndrome.
- Citation: Wang Q, Sun LN, Shi H, Ma XY, Gao W, Xu B, Lin X, Liu YM, Huang CY, Jin RH. Multi-omics analysis reveals gut microbiota-metabolite interactions and their association with liver function in autoimmune overlap syndrome. World J Gastroenterol 2025; 31(25): 106371
- URL: https://www.wjgnet.com/1007-9327/full/v31/i25/106371.htm
- DOI: https://dx.doi.org/10.3748/wjg.v31.i25.106371


