Copyright
©The Author(s) 2025.
World J Gastroenterol. Jun 14, 2025; 31(22): 108815
Published online Jun 14, 2025. doi: 10.3748/wjg.v31.i22.108815
Published online Jun 14, 2025. doi: 10.3748/wjg.v31.i22.108815
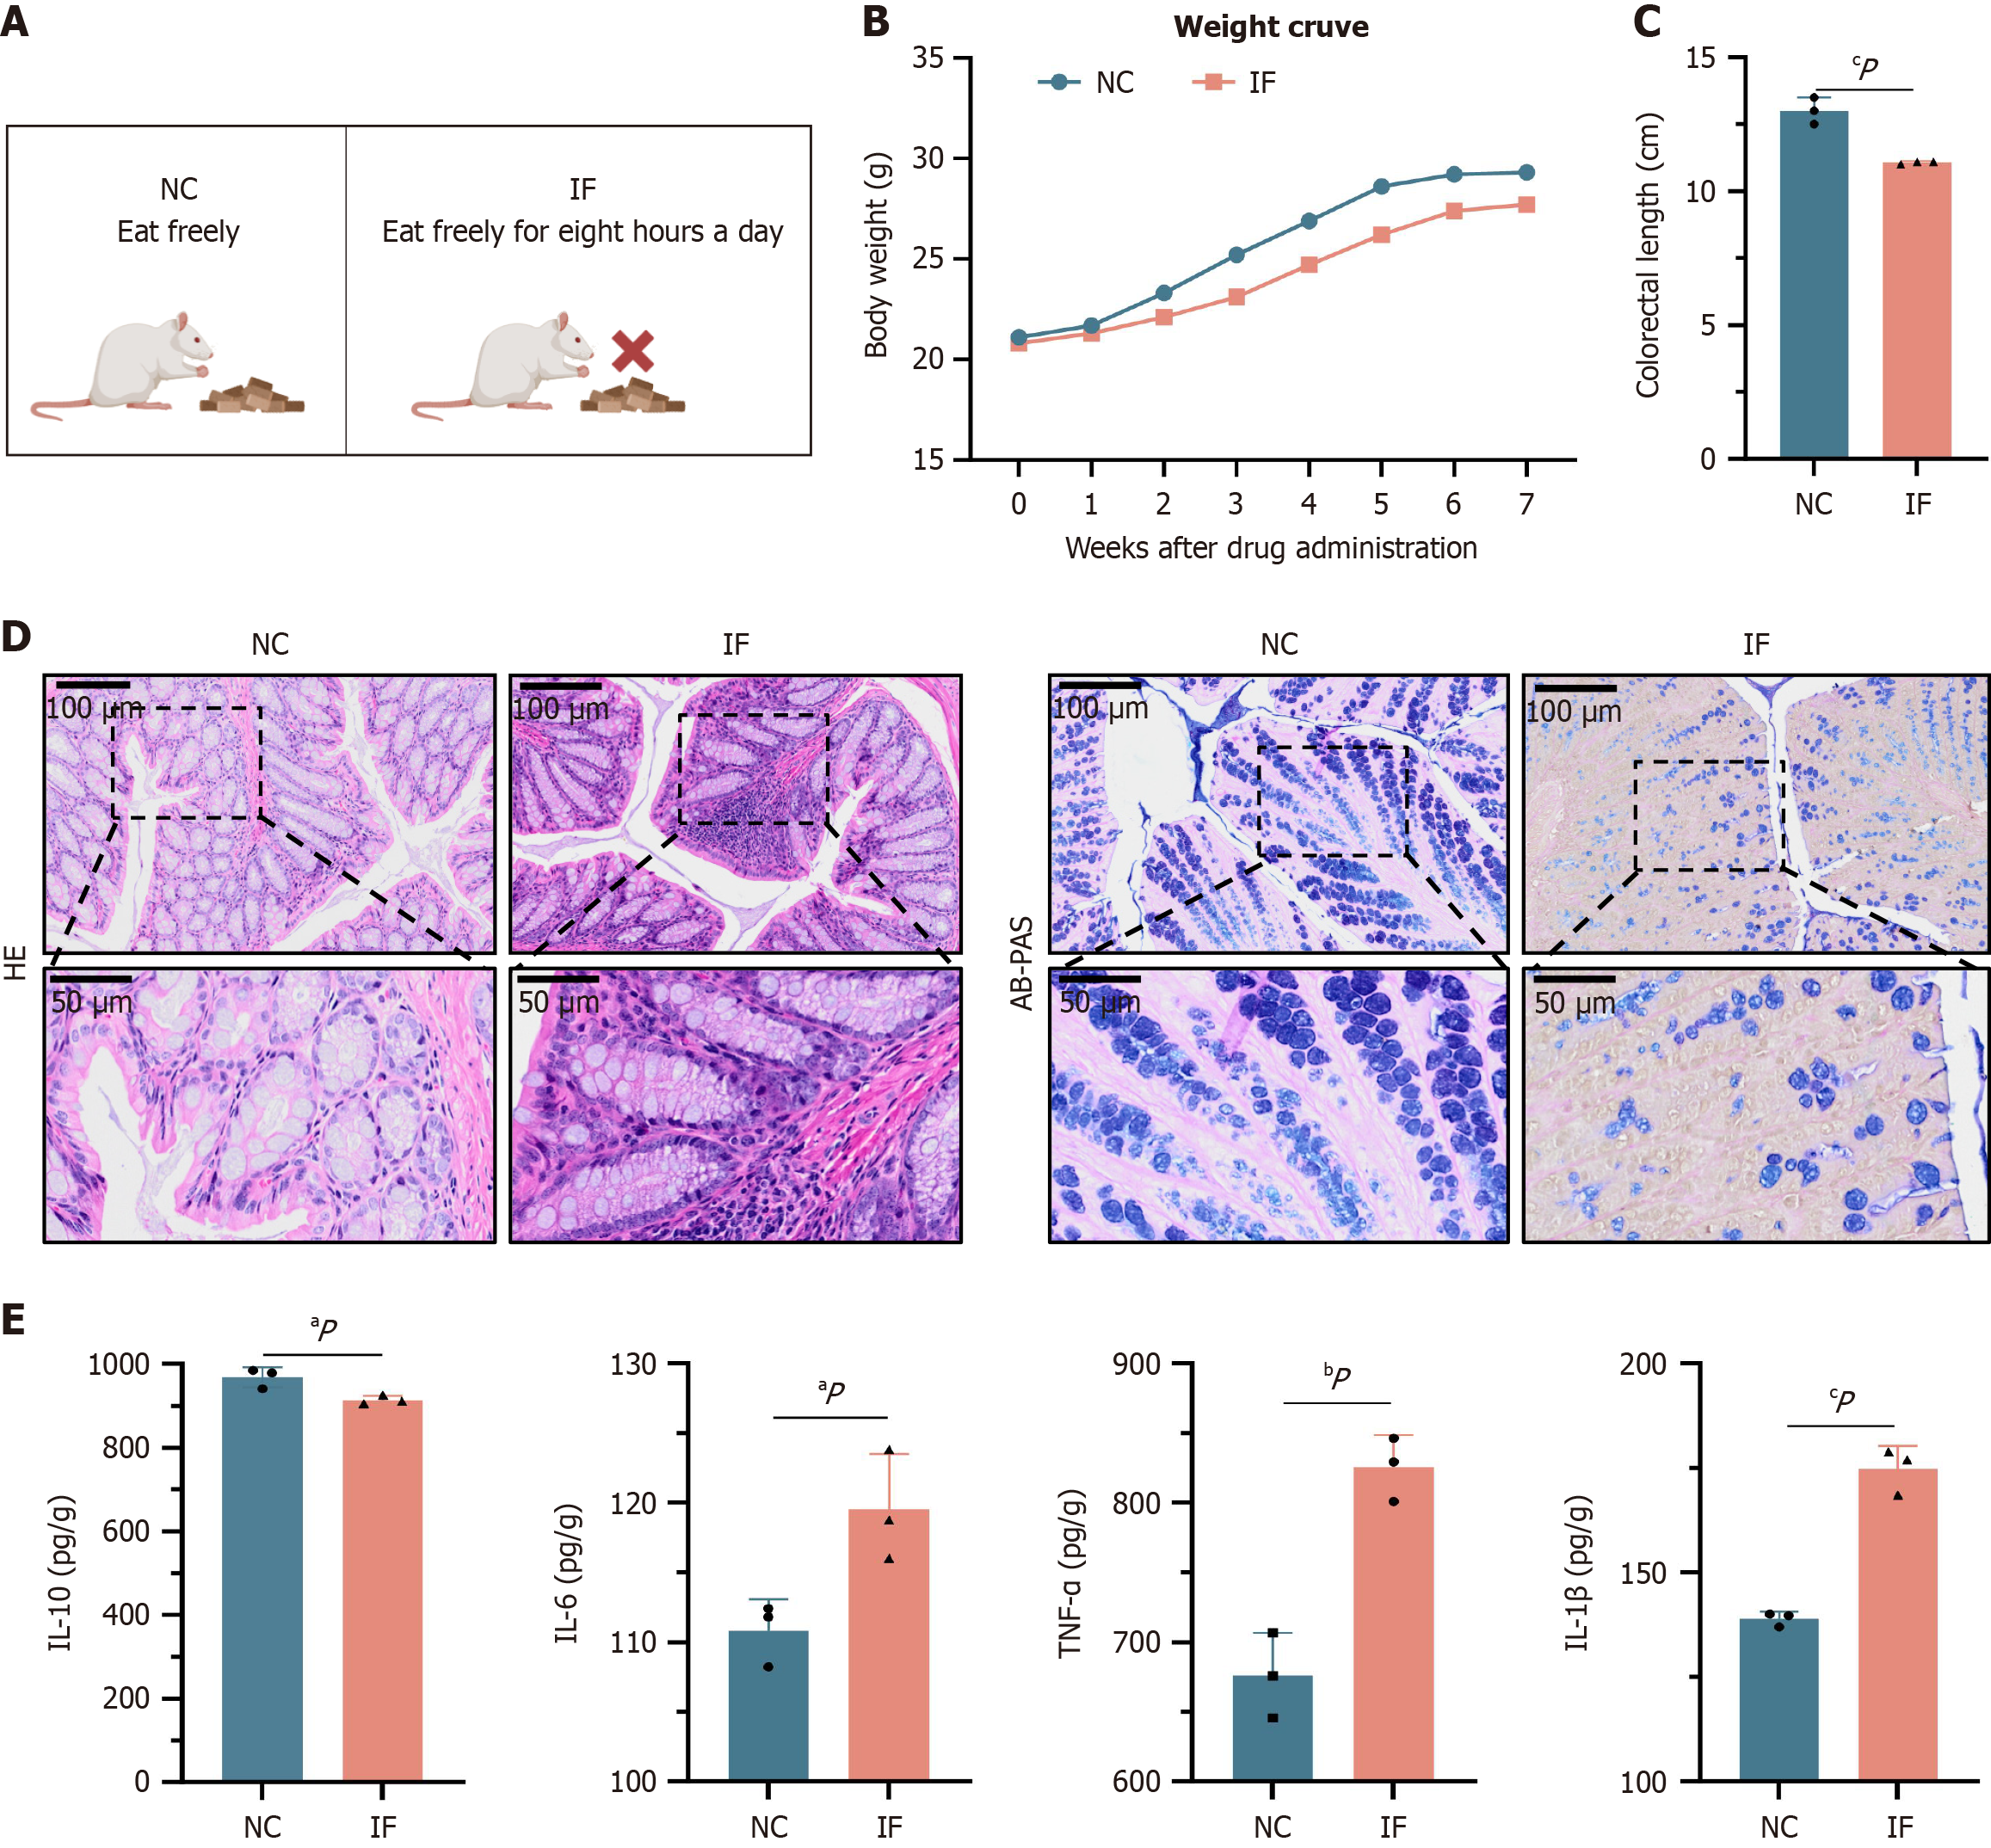
Figure 1 Intermittent fasting induces intestinal inflammation.
A: Mice were divided into normal control (NC) and intermittent fasting (IF) groups; B: IF mice had significantly lower weight gain compared to NC mice; C: IF colon length was significantly lower than control mice; D: Hematoxylin-eosin staining and alcian blue-periodic acid-Schiff staining showed significant inflammatory cell infiltration of colon tissue and number of goblet cells; E: The expression of tumor necrosis factor-α, interleukin (IL)-1β and IL-6 were significantly higher than the NC group, while IL-10 was detected by enzyme-linked immunosorbent assay. aP < 0.05. bP < 0.01. cP < 0.001. NC: Normal control; IF: Intermittent fasting; HE: Hematoxylin-eosin; AB-PAS: Alcian blue-periodic acid-Schiff staining; IL: Interleukin; TNF: Tumor necrosis factor.
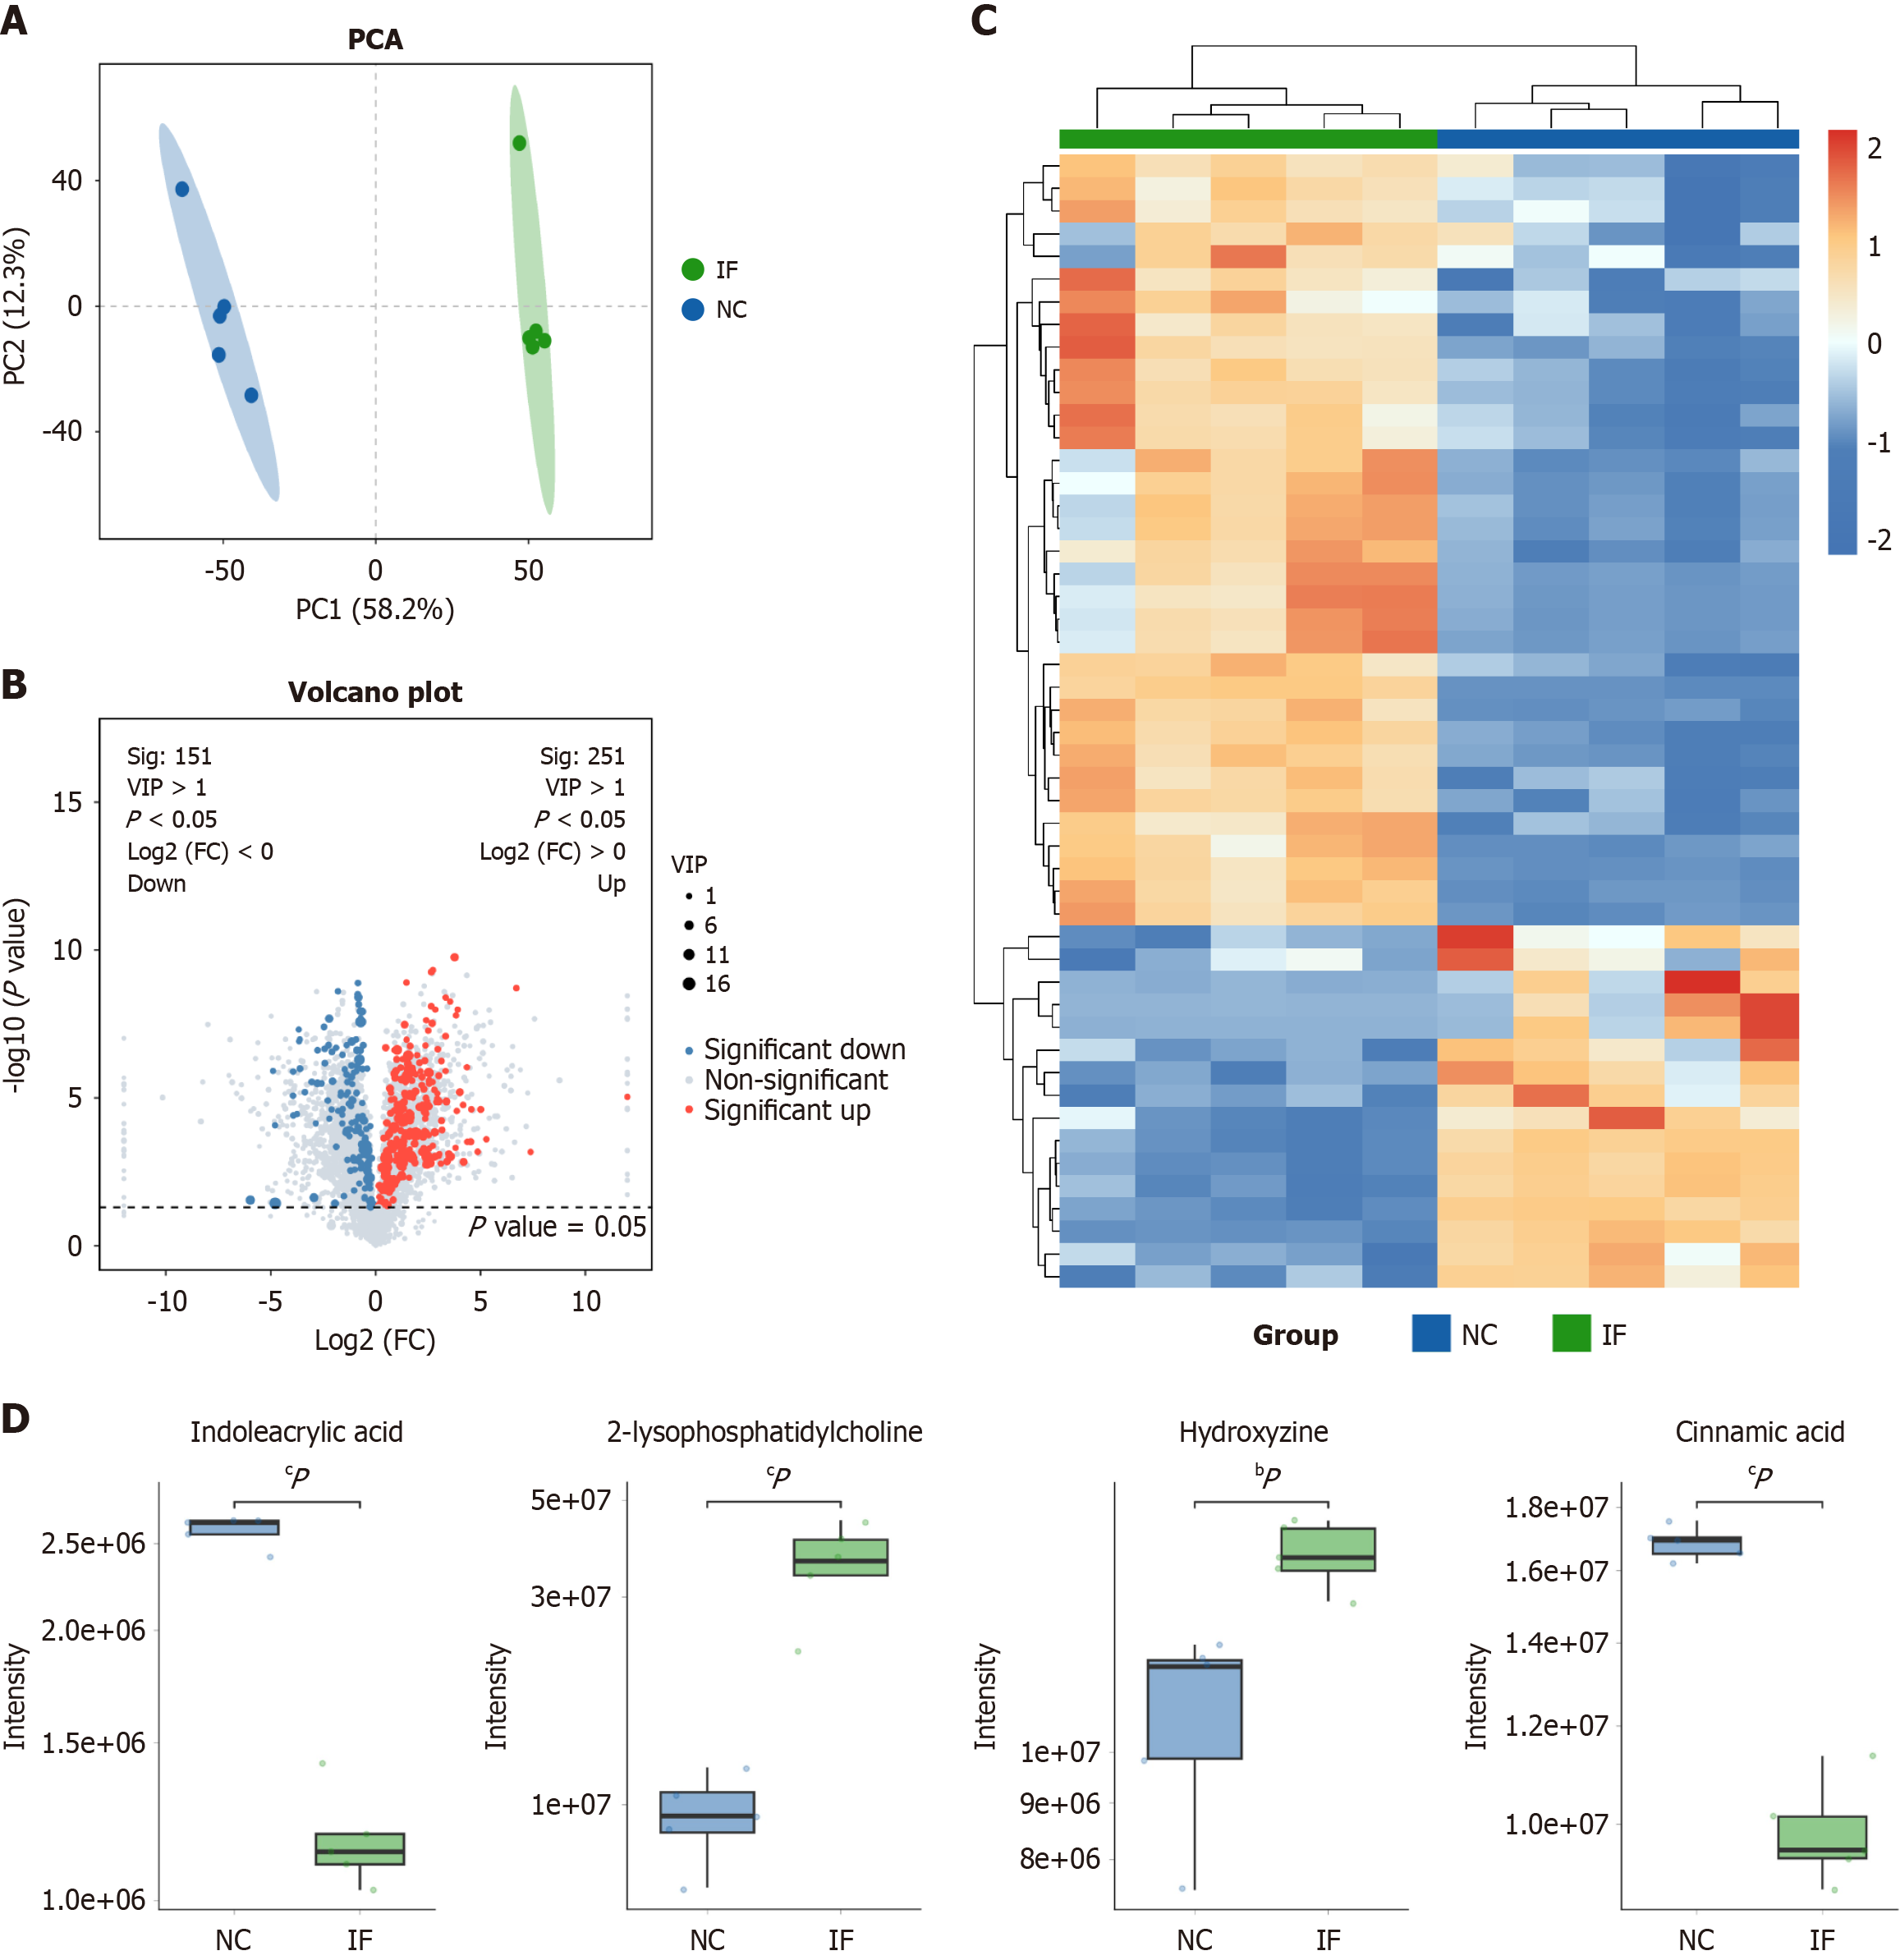
Figure 2 Untargeted metabolomics analysis.
A: Normal control (NC) (blue) and intermittent fasting (IF) (green) were significantly separated on the principal component analysis plot; B: 251 metabolites with significant differences between the two groups, with 151 downregulated; C: Hierarchical clustering of expression of all significantly differential metabolites as well as significantly differential metabolites in variable importance in the projection top 50, The heat map indicates significant differences in metabolite expression between the two groups; D: By using the boxplot, we visually found the distribution of indoleacrylic acid, 2-lysopho
Figure 3 Restrictive diet is associated with gut microbiota dysbiosis.
A: The abundance-based coverage estimator and Chao1 index analysis, found significant differences in α diversity between the two groups; B: Principal component analysis showed significant differences in β diversity observed in the two groups; C: A total number of 369 species in both groups of gut microbiota, of the 375 species endemic to the normal control group, 292 species; D: At the gate level, Firmicutes (Firmicutes) decreased and Cyclospora (Campilobacterota) increased in the intermittent fasting group; At the genus level, the relative abundance of group F species (Rikenella) and murobacteria (Muribaculaceae) increased; E and F: Lefse further analyzed the microbial communities. bP < 0.01. NC: Normal control; IF: Intermittent fasting; PC: Principal component; LDA: Linear discriminant analysis.
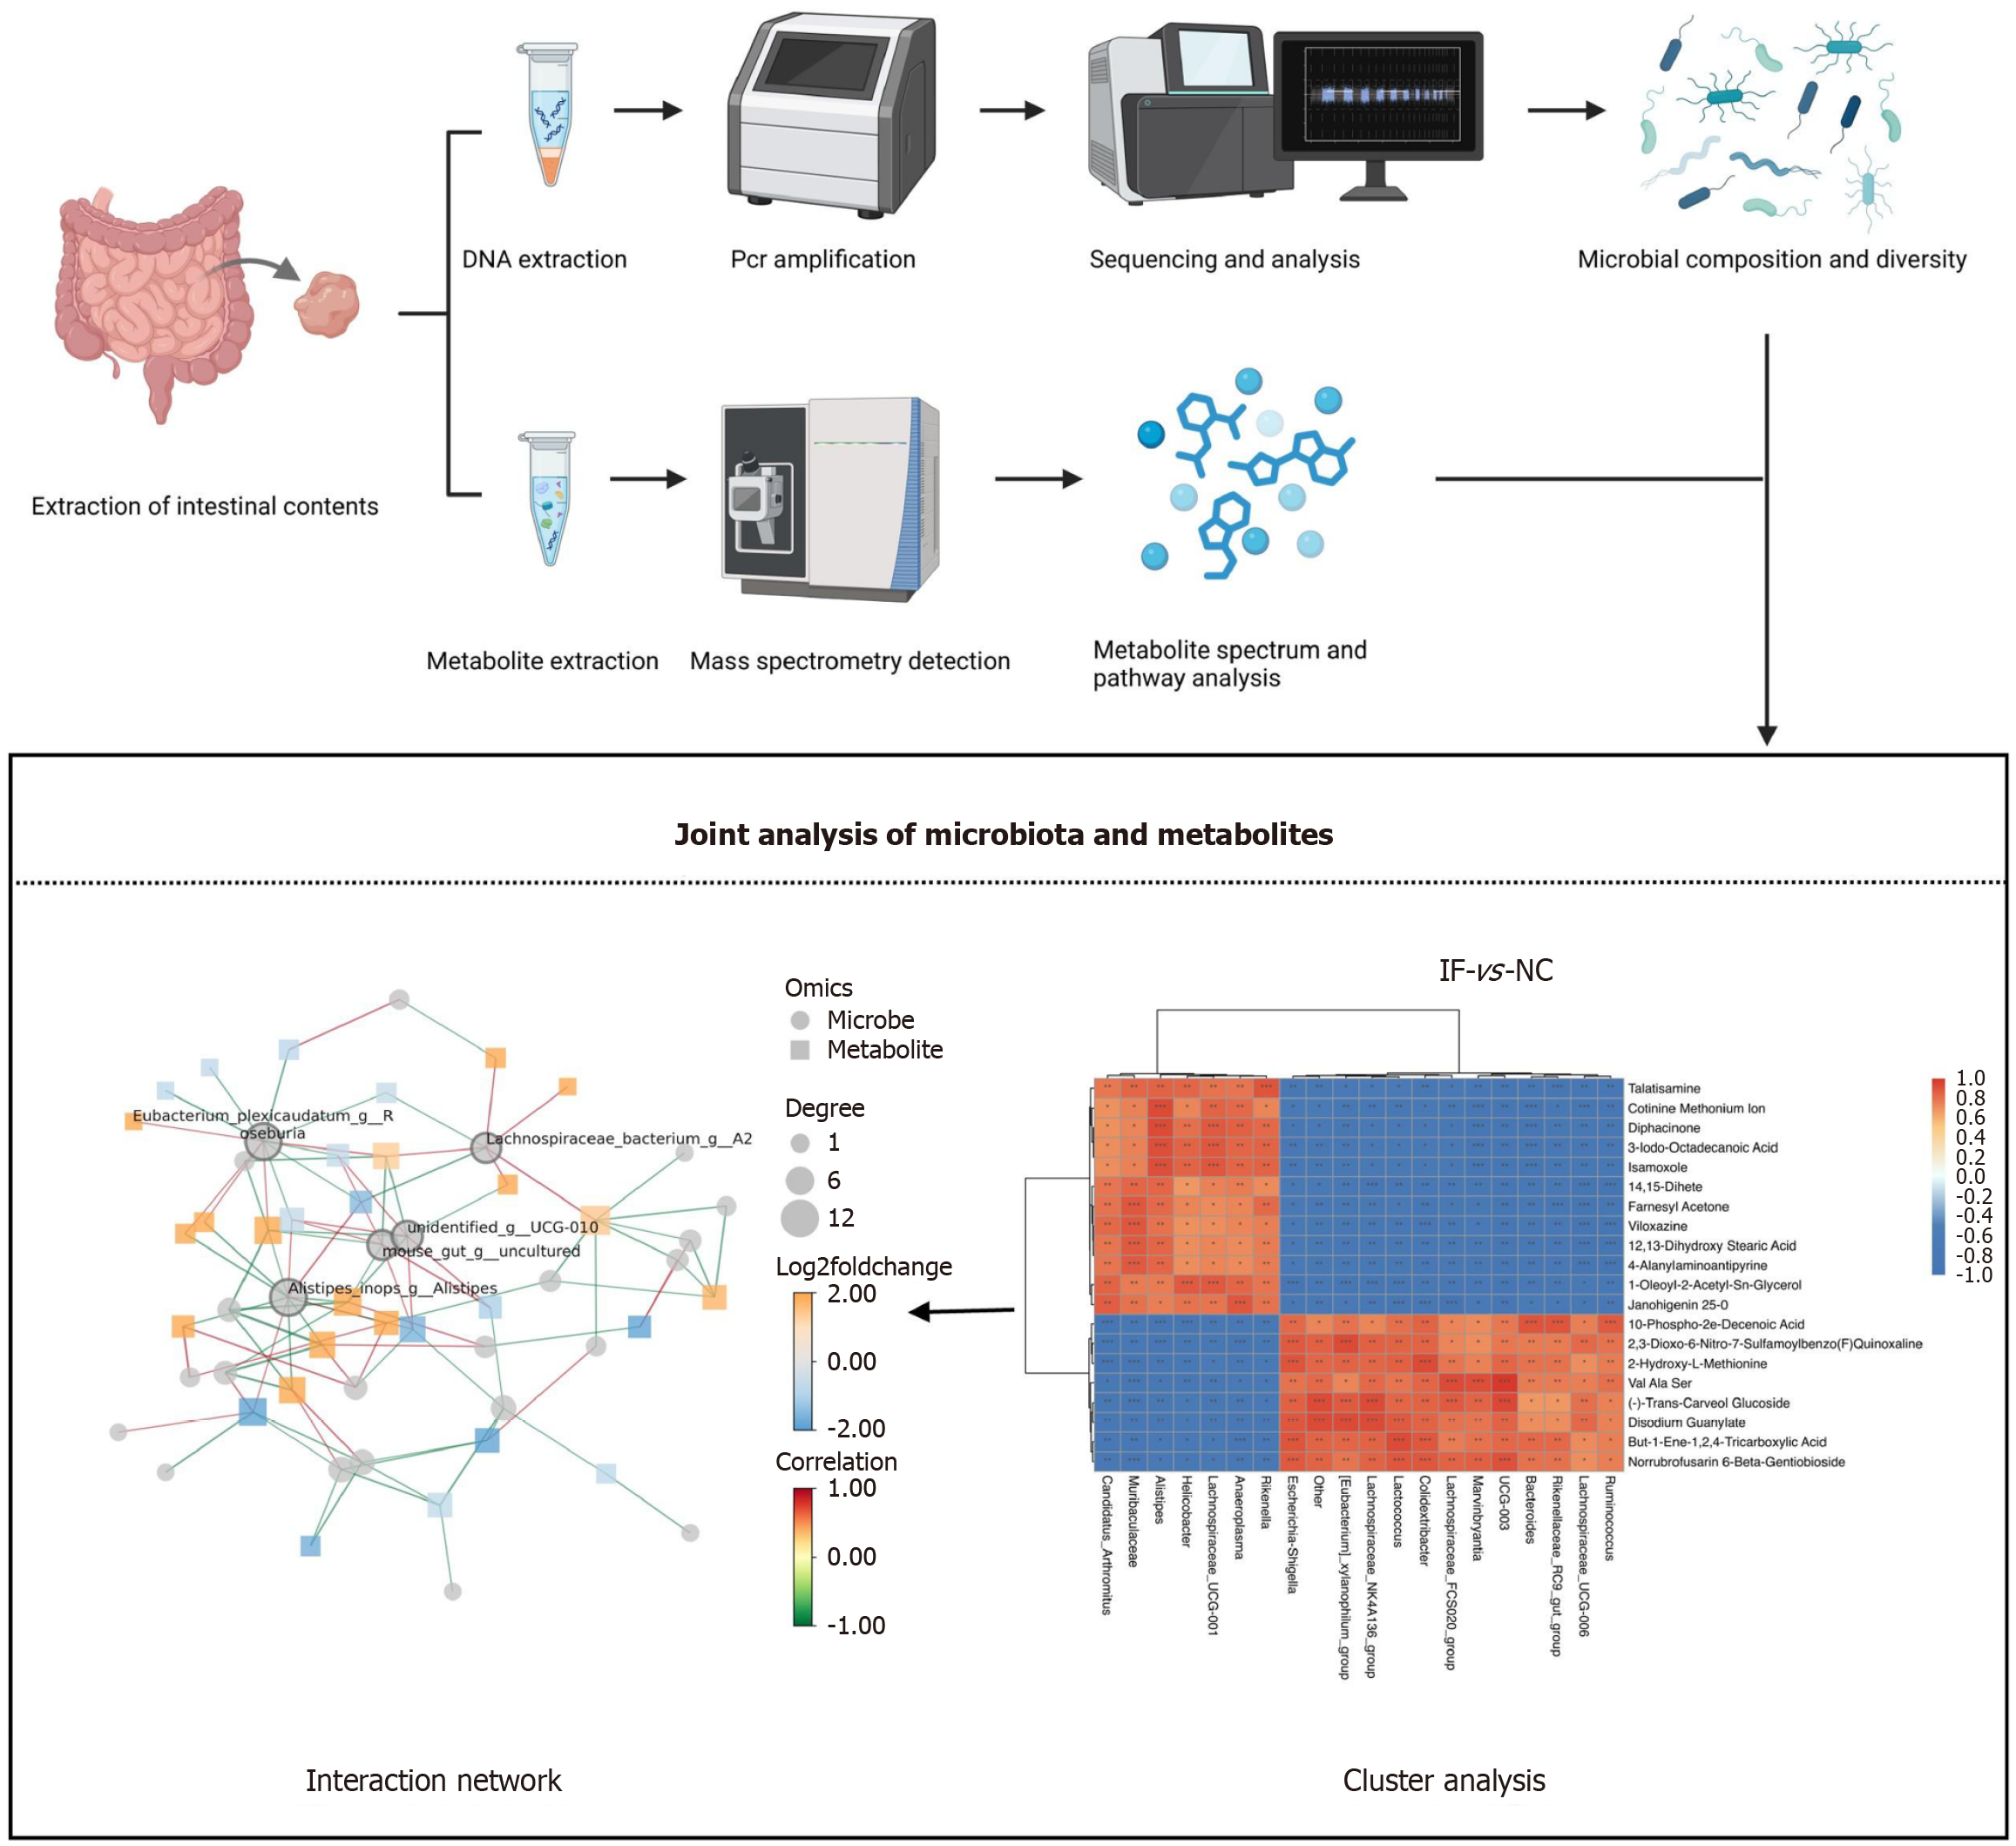
Figure 4 Combined analysis of non-targeted metabolomics and 16s rRNA sequencing.
Mouse intestinal contents by DNA extraction, polymerase chain reaction amplification, sequencing analysis, flora composition and diversity, at the same time by the metabolite spectrum and pathway analysis, then the two content joint analysis, cluster analysis, shows a significant difference between the two groups, finally the interaction network, indicating that the core flora (e.g. Alistipes and Unidentified _ g _ UCG-010) and a variety of metabolites established a strong correlation. NC: Normal control; IF: Intermittent fasting; PCR: Polymerase chain reaction.
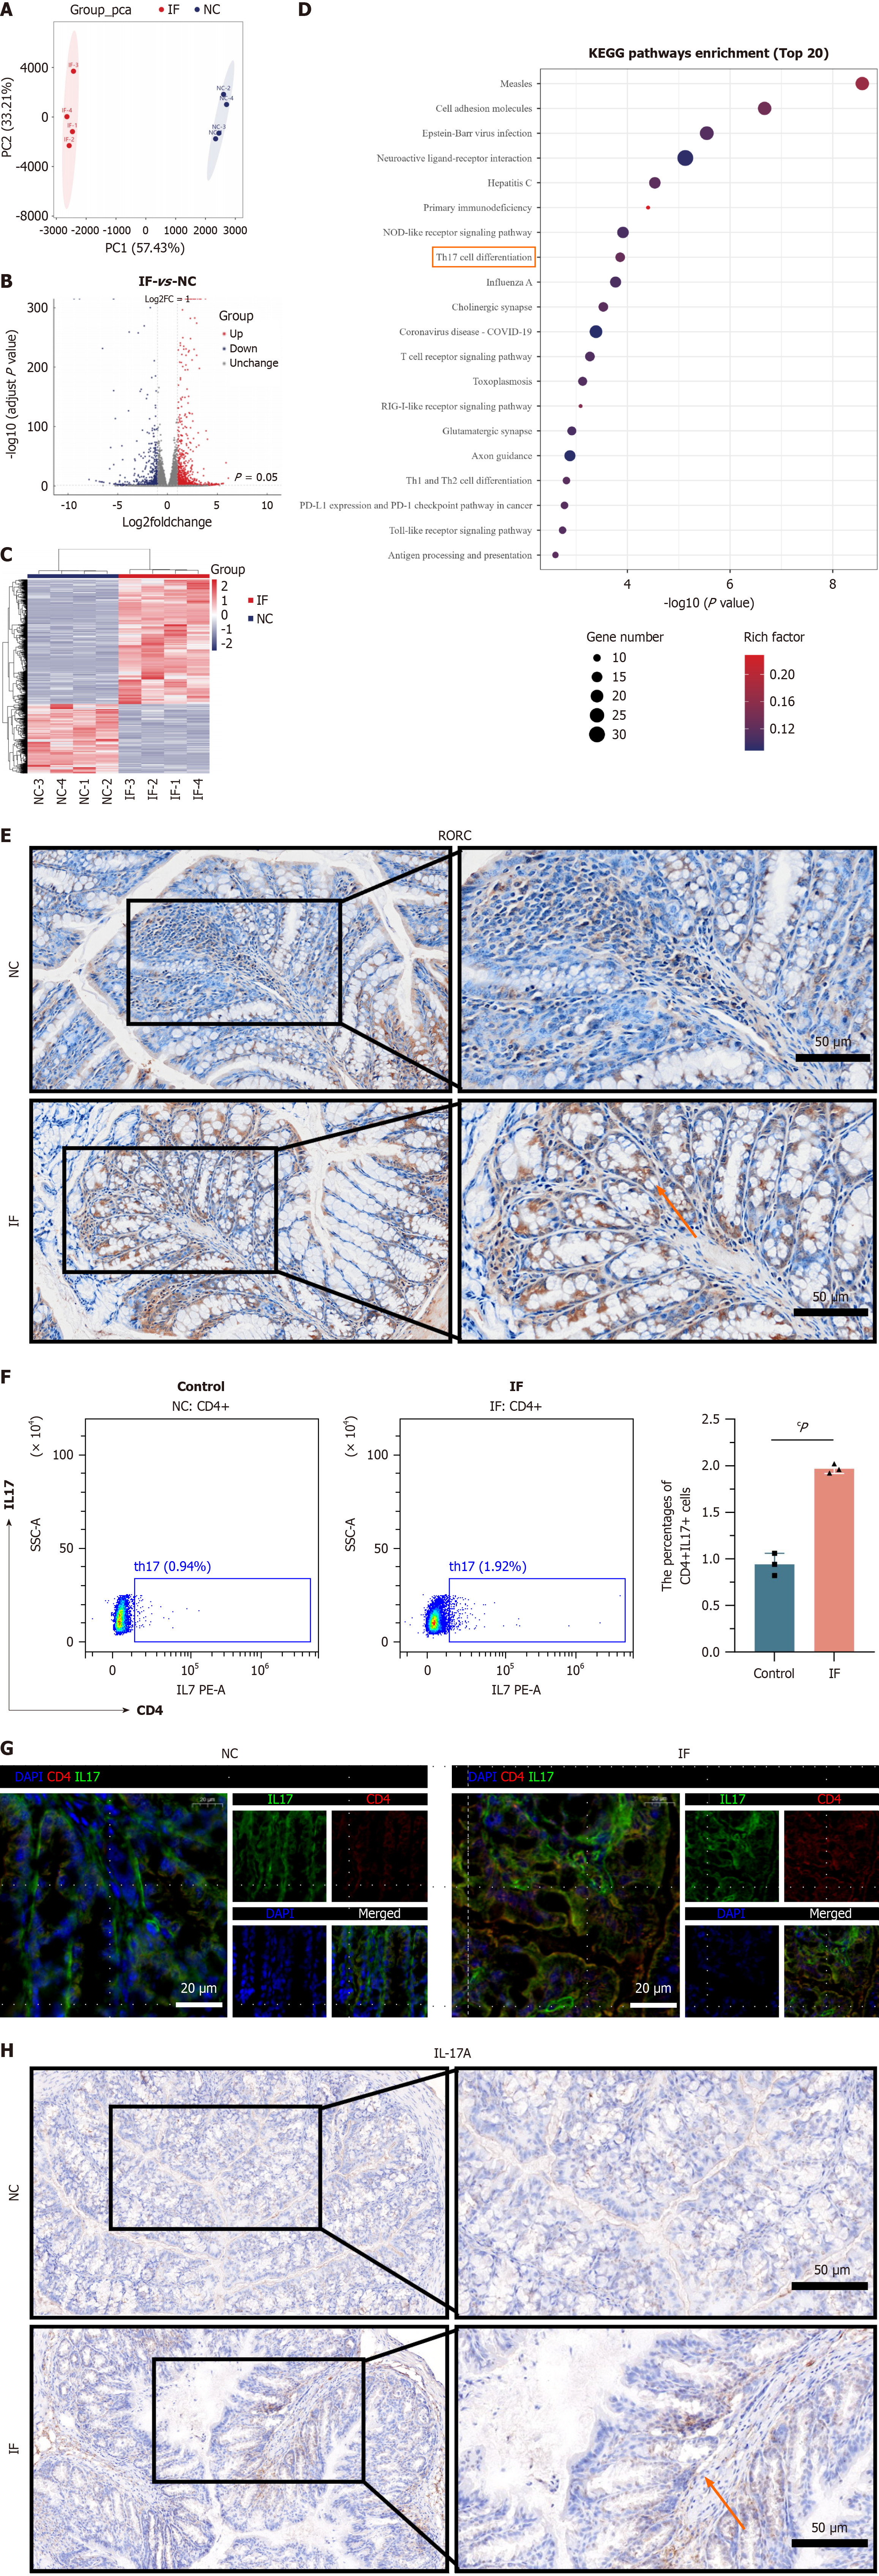
Figure 5 Transcriptomics reveals that intermittent fasting is associated with increased differentiation of Th17 cells.
A: Principal component analysis showed a significant separation of the two groups in these two principal components; B: Compared to the normal control (NC) group, 1131 up-regulated differential genes and 630 downregulated differential genes; C: Hierarchical clustering of all significantly divergent genes and made as a heat map, show a significant difference between the two groups; D: The Kyoto Encyclopedia of Genes and Genomes enrichment analysis was performed based on the differential genes. Among them, immune-related pathways such as “T cell receptor signaling pathway” and “Th 17 cell differentiation” are the most obvious; E: Mouse intestinal tissues were subjected to immunohistochemical staining, found higher RORC genes in intermittent fasting (IF) group than in NC group; F: Flow cytometry showed that Th 17 cells were significantly higher in the IF group than in the NC group; G: By multiple immunofluorescence, compared with the NC group, The expression of cluster of differentiation 4 and interleukin-17 increased in the IF group; H: By performing the histochemical staining. Also found that compared with the NC group, Th 17 cells were significantly increased in the IF group. cP < 0.001. NC: Normal control; IF: Intermittent fasting; PC: Principal component; KEGG: Kyoto Encyclopedia of Genes and Genomes; IL: Interleukin; CD: Cluster of differentiation.
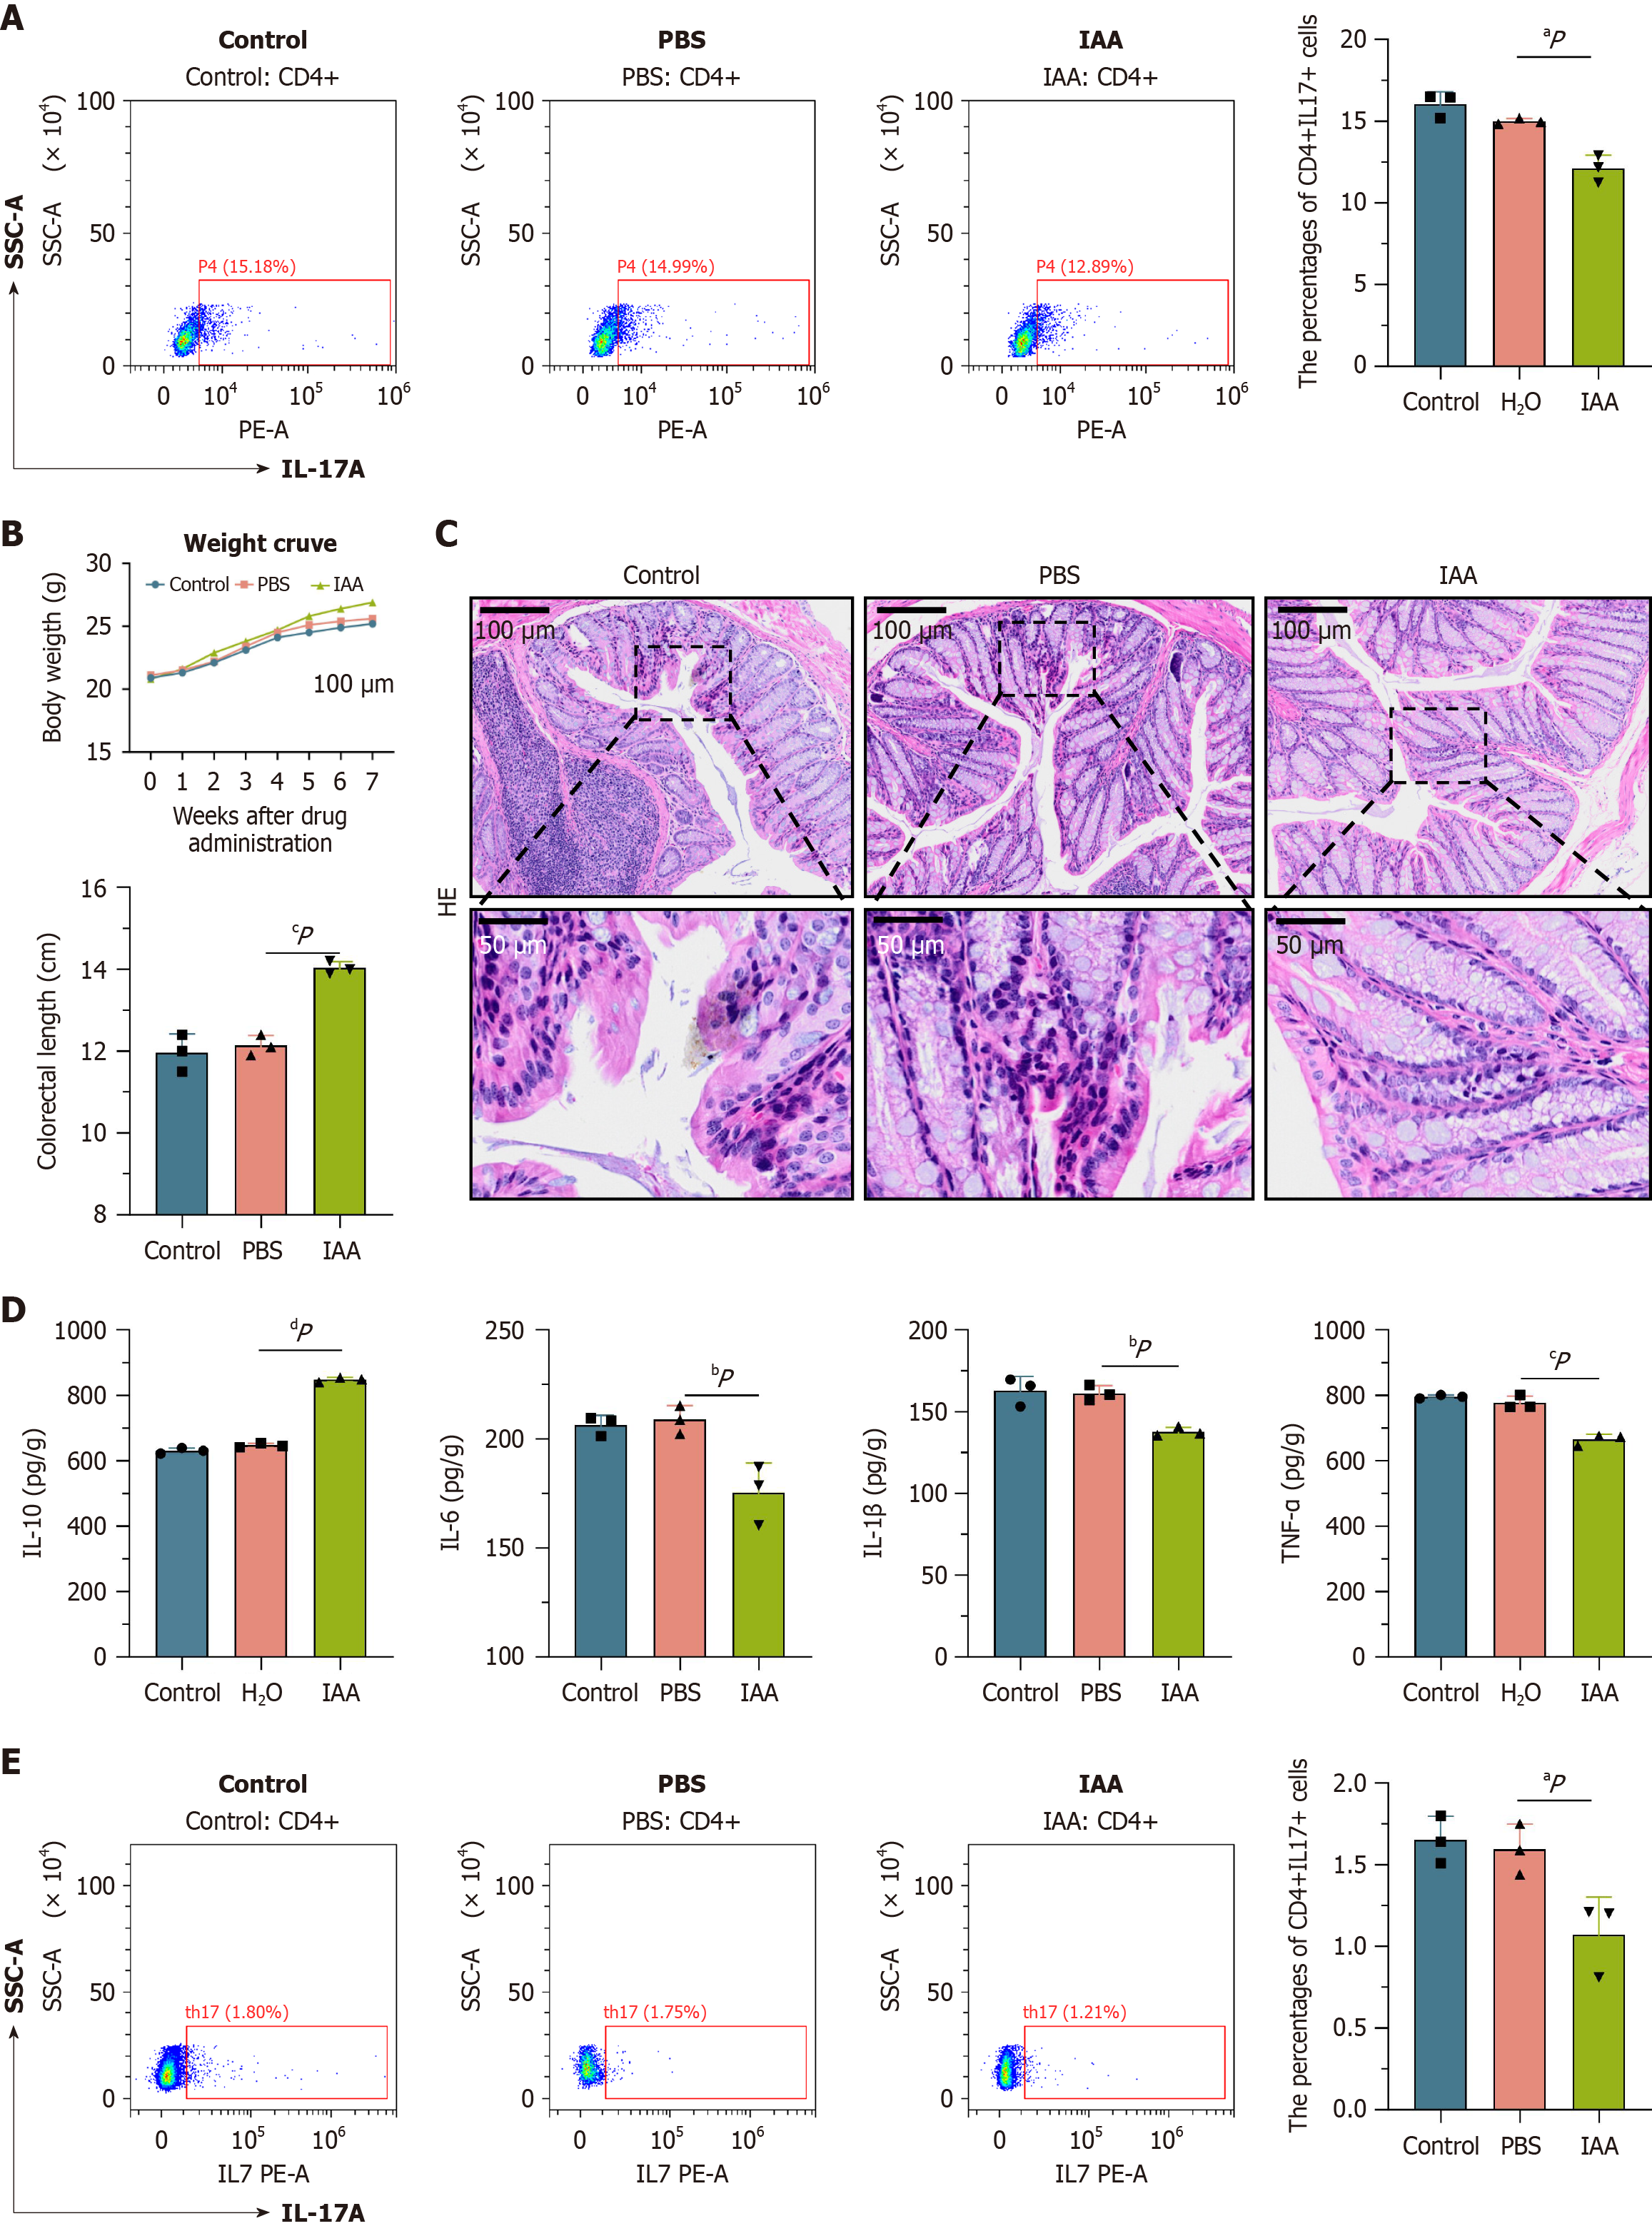
Figure 6 Mice relieved intestinal inflammation after indoleacrylic acid supplementation.
A: Flow cytometry in in vitro experiments. We found that Th17 content decreased significantly in indoleacrylic acid (IAA) group compared to control group and phosphate-buffered saline (PBS) group; B: Compared with group control and PBS mice. Mice in the IAA group had a significantly increased body weight, gut length is also significantly increased; C: The hematoxylin-eosin staining of the colonic tissue of the IAA group, significant reduction of inflammatory cell infiltration; D: The expression levels of the pro-inflammatory cytokines tumor necrosis factor (TNF)-α, TNF-β, and interleukin (IL)-6 were significantly lower in the IAA group than in the other groups. However, the expression level of the anti-inflammatory cytokine IL-10 was significantly increased; E: Detection by flow cytometry, the Th 17 cells of IAA mice were significantly reduced compared to the other two groups. aP < 0.05. bP < 0.01. cP < 0.001. dP < 0.0001. PBS: Phosphate-buffered saline; IAA: Indoleacrylic acid; IL: Interleukin; CD: Cluster of differentiation; SSC-A: Side Scatter-A; PE-A: Phycoerythrin-A; HE: Hematoxylin-eosin.
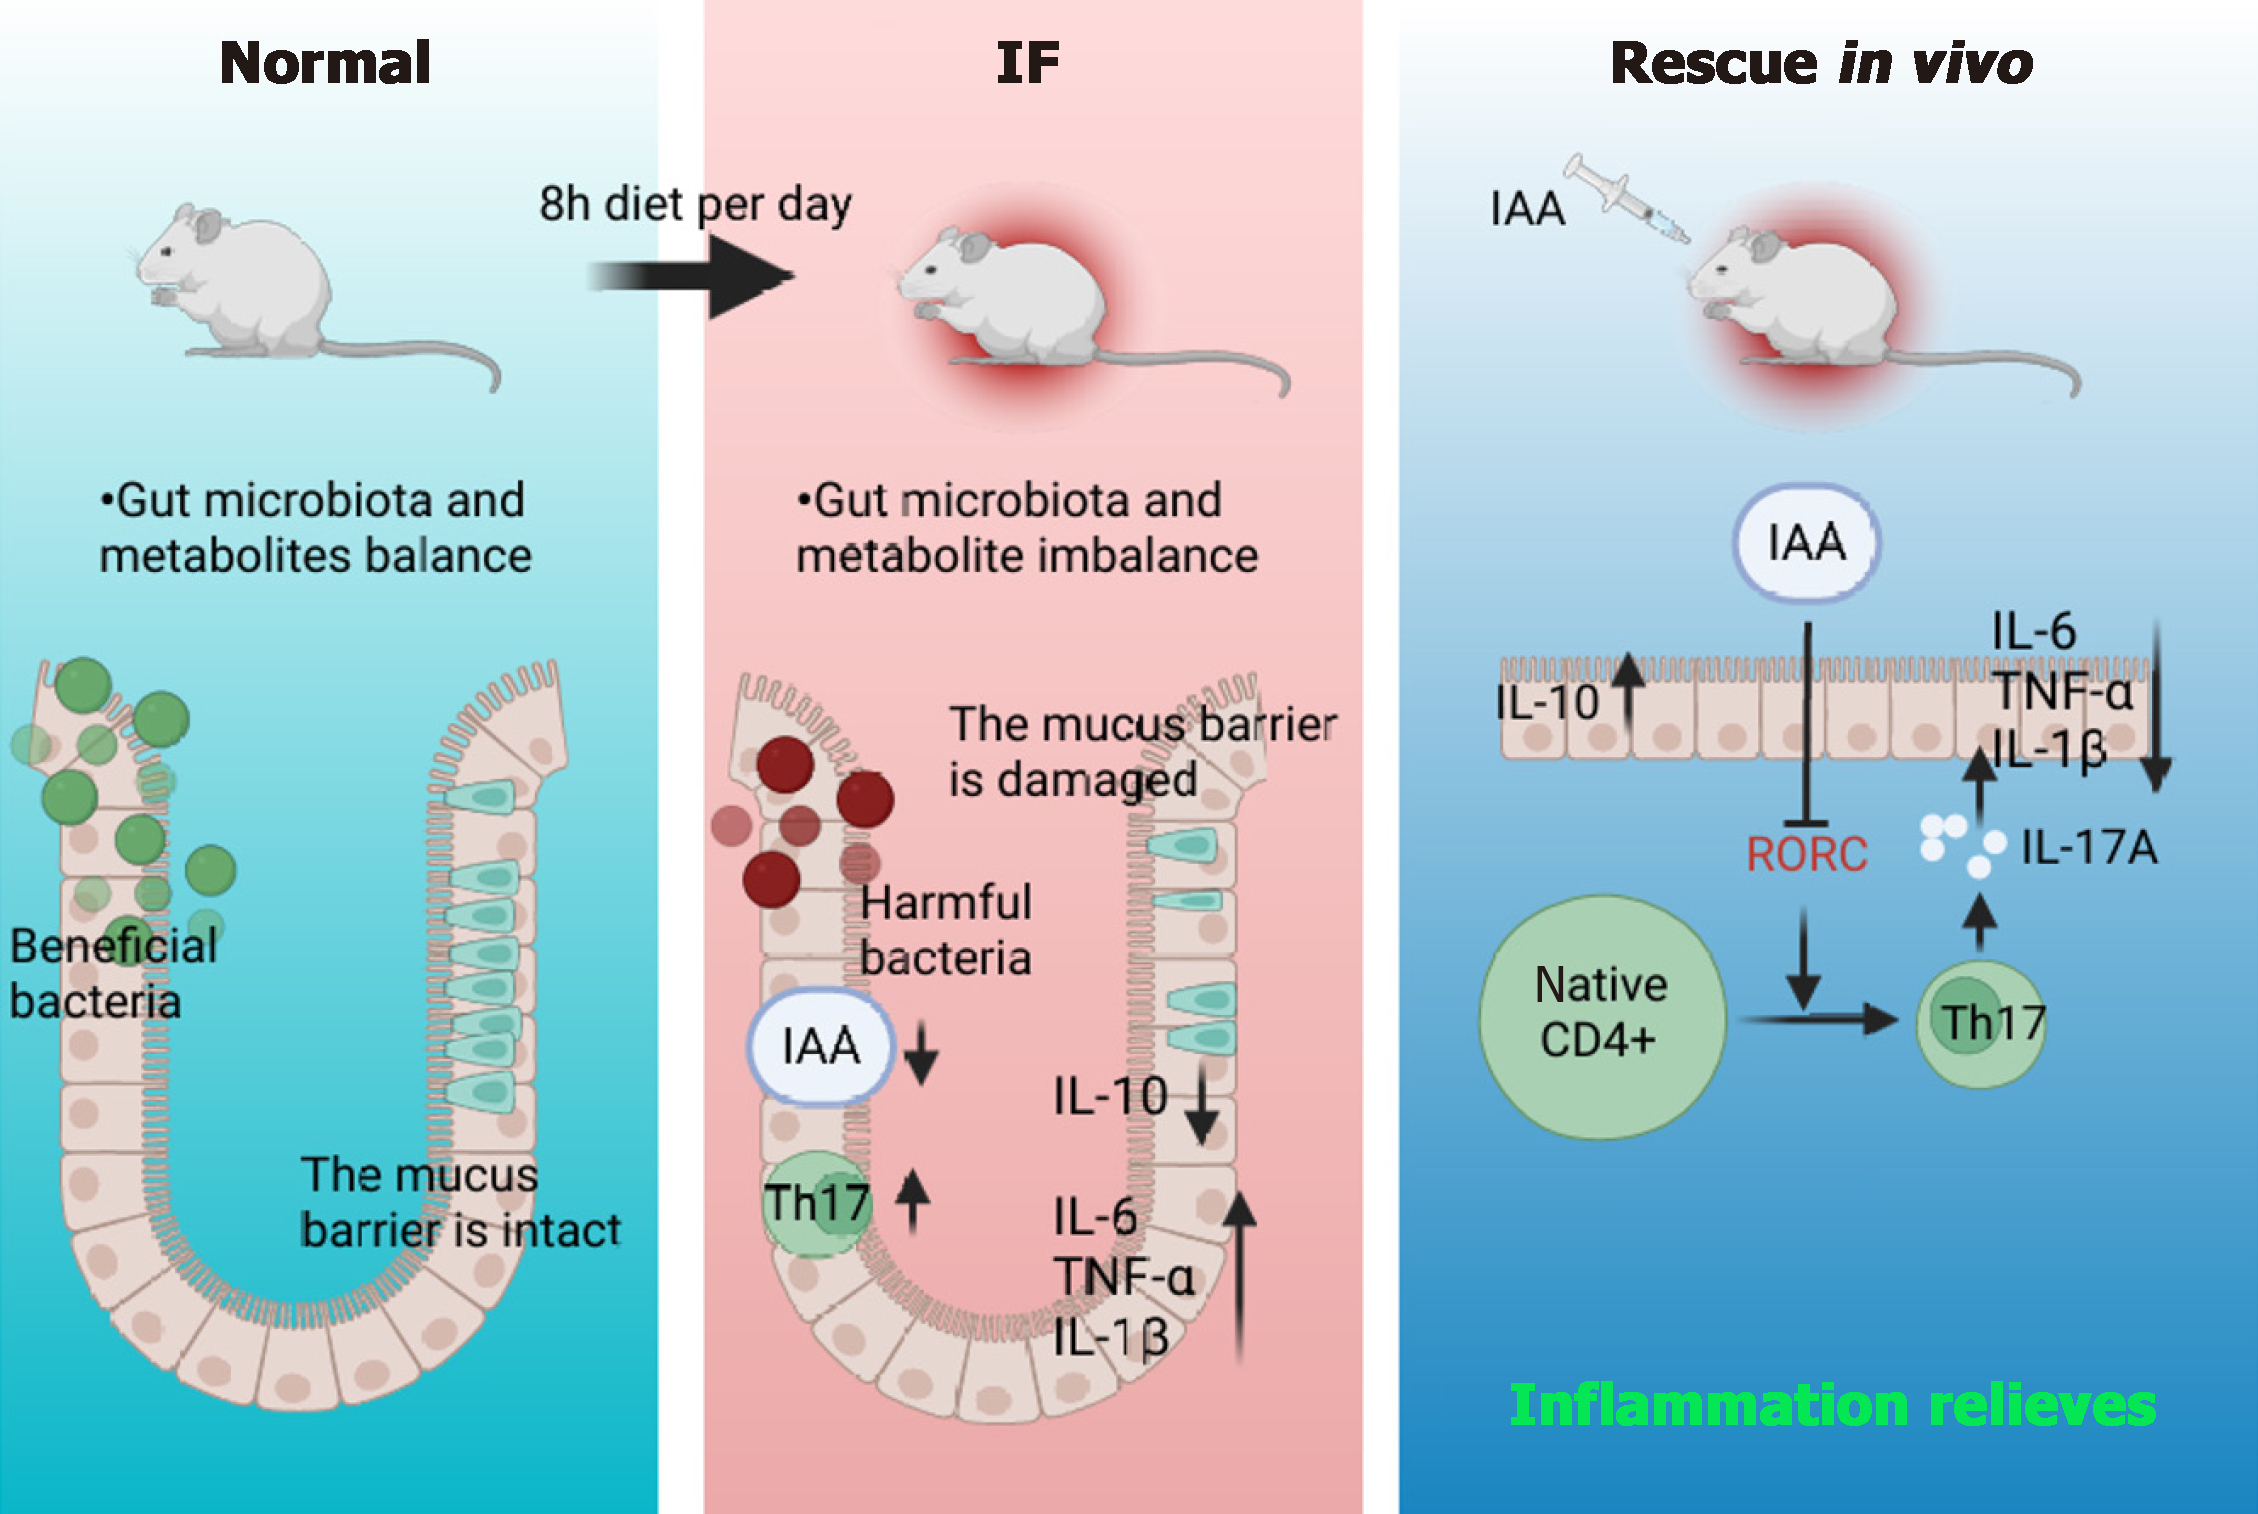
Figure 7 Intermittent fasting promotes Th17 cell differentiation by inhibiting gut microbiota-derived indole acrylic acid, thereby exacerbating the mechanism of colonic inflammation.
IAA: Indoleacrylic acid; IF: Intermittent fasting; IL: Interleukin; TNF: Tumor necrosis factor; CD: Cluster of differentiation.
- Citation: Fu R, Zhang P, Zhang JW, Hong Y, Chen B, Cao GD. Intermittent fasting exacerbates colon inflammation by promoting Th17 cell differentiation through inhibition of gut microbiota-derived indoleacrylic acid. World J Gastroenterol 2025; 31(22): 108815
- URL: https://www.wjgnet.com/1007-9327/full/v31/i22/108815.htm
- DOI: https://dx.doi.org/10.3748/wjg.v31.i22.108815


