Copyright
©The Author(s) 2025.
World J Gastroenterol. Jan 14, 2025; 31(2): 99349
Published online Jan 14, 2025. doi: 10.3748/wjg.v31.i2.99349
Published online Jan 14, 2025. doi: 10.3748/wjg.v31.i2.99349
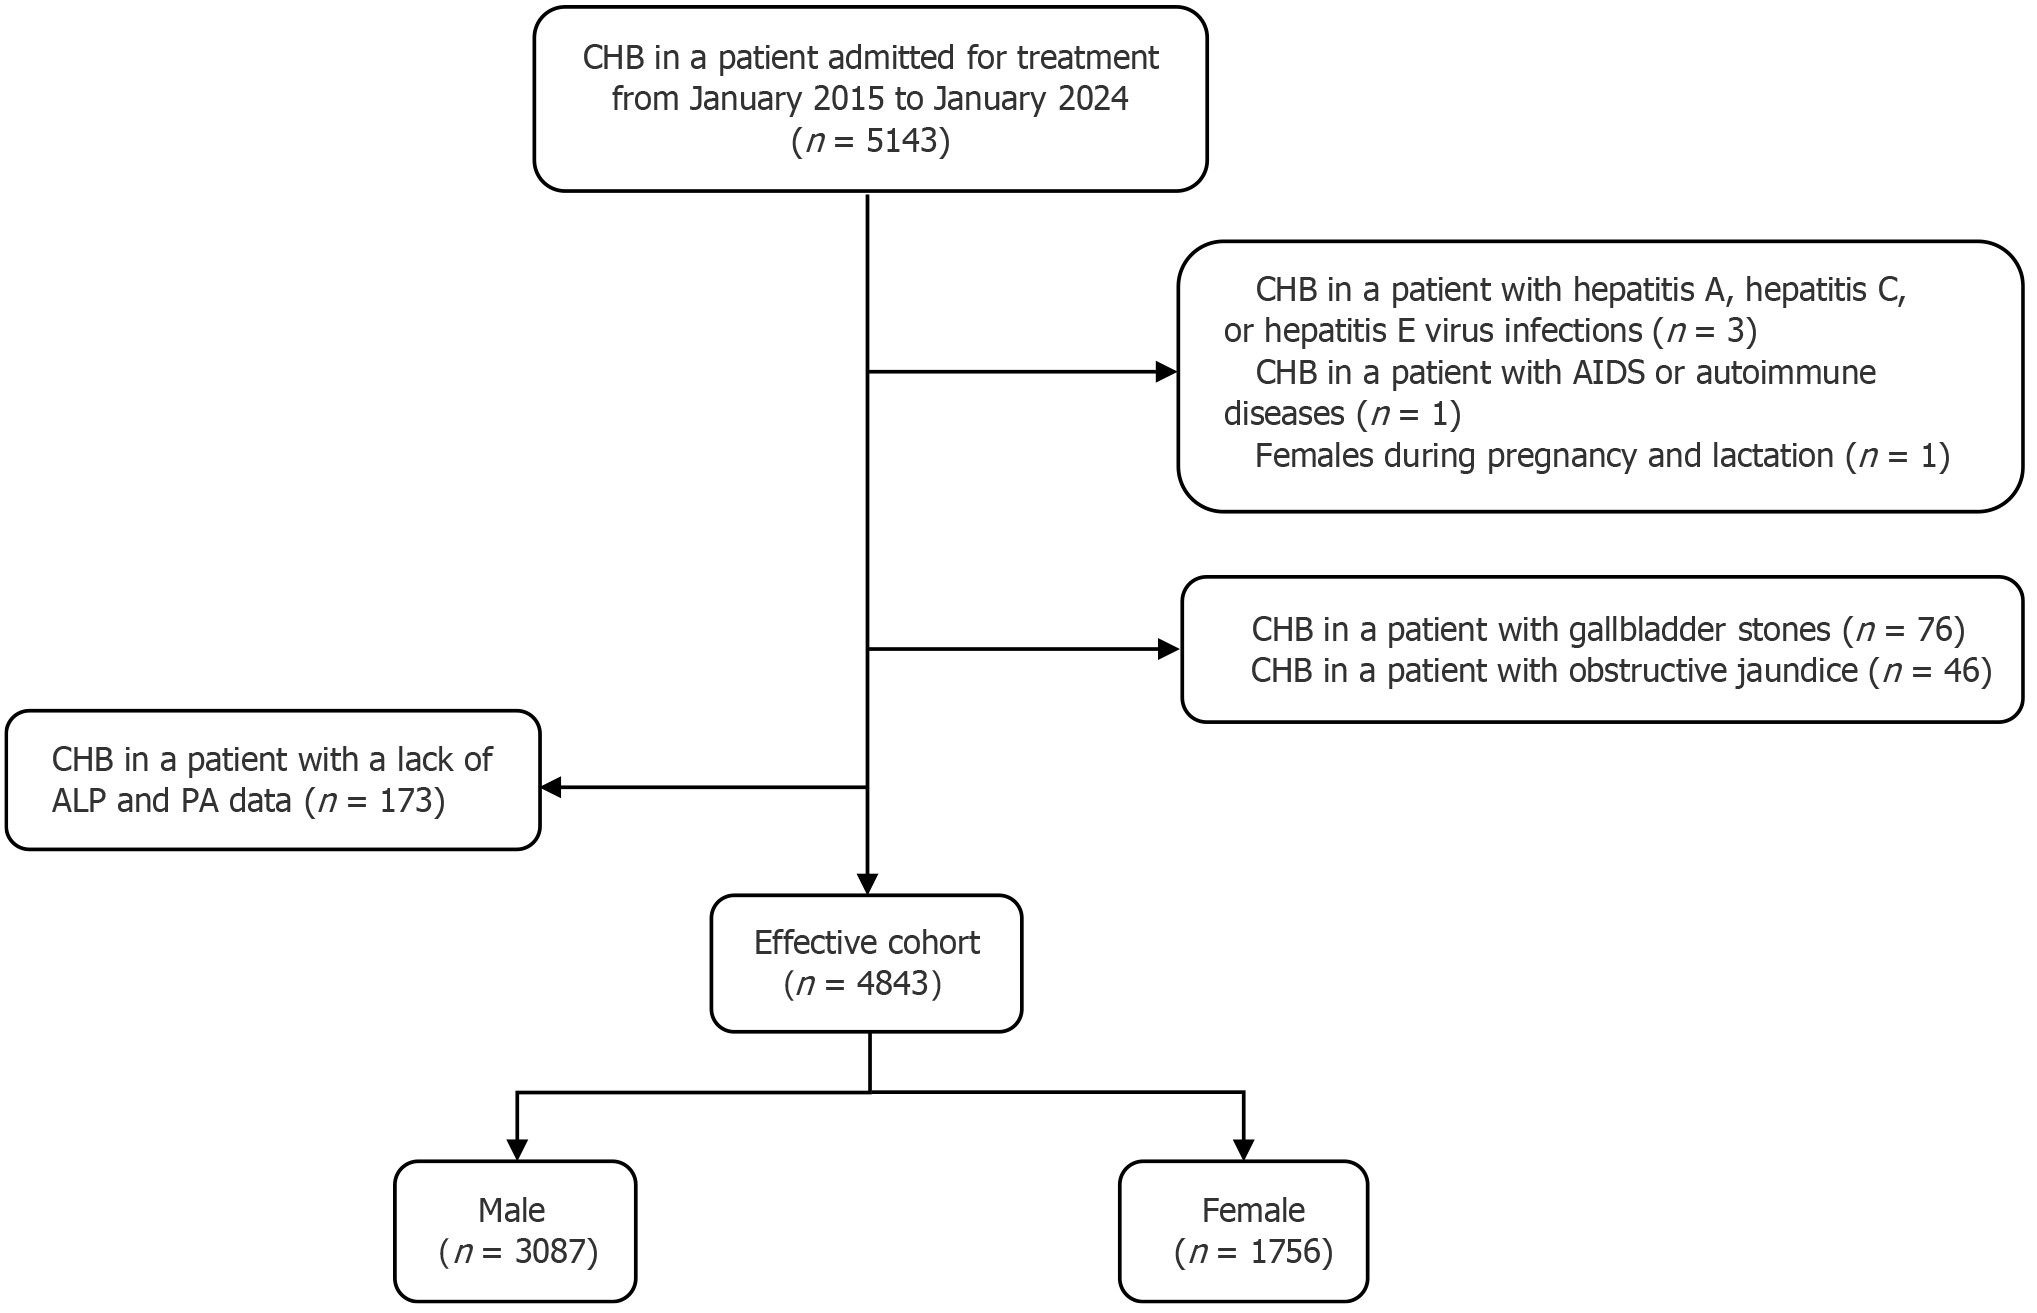
Figure 1 Effective cohort flowchart.
CHB: Chronic hepatitis B; AIDS: Acquired immunodeficiency syndrome; ALP: Alkaline phosphatase; PA: Prealbumin.
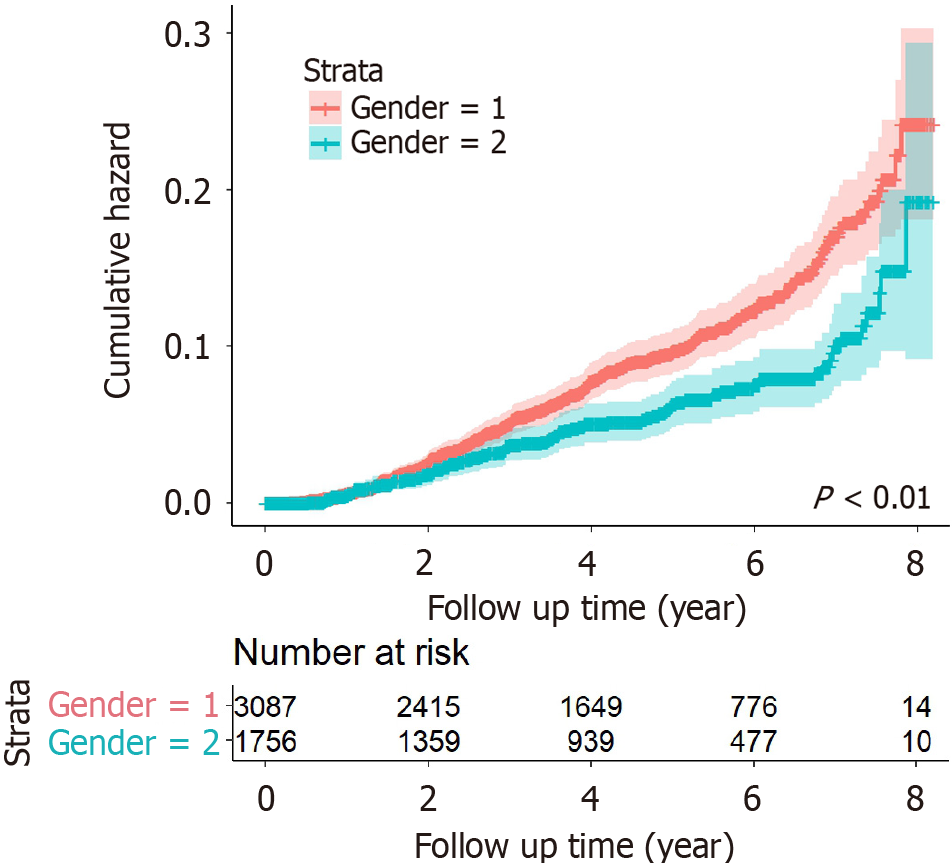
Figure 2 Cumulative incidence of hepatocellular carcinoma.
1: Males; 2: Females.
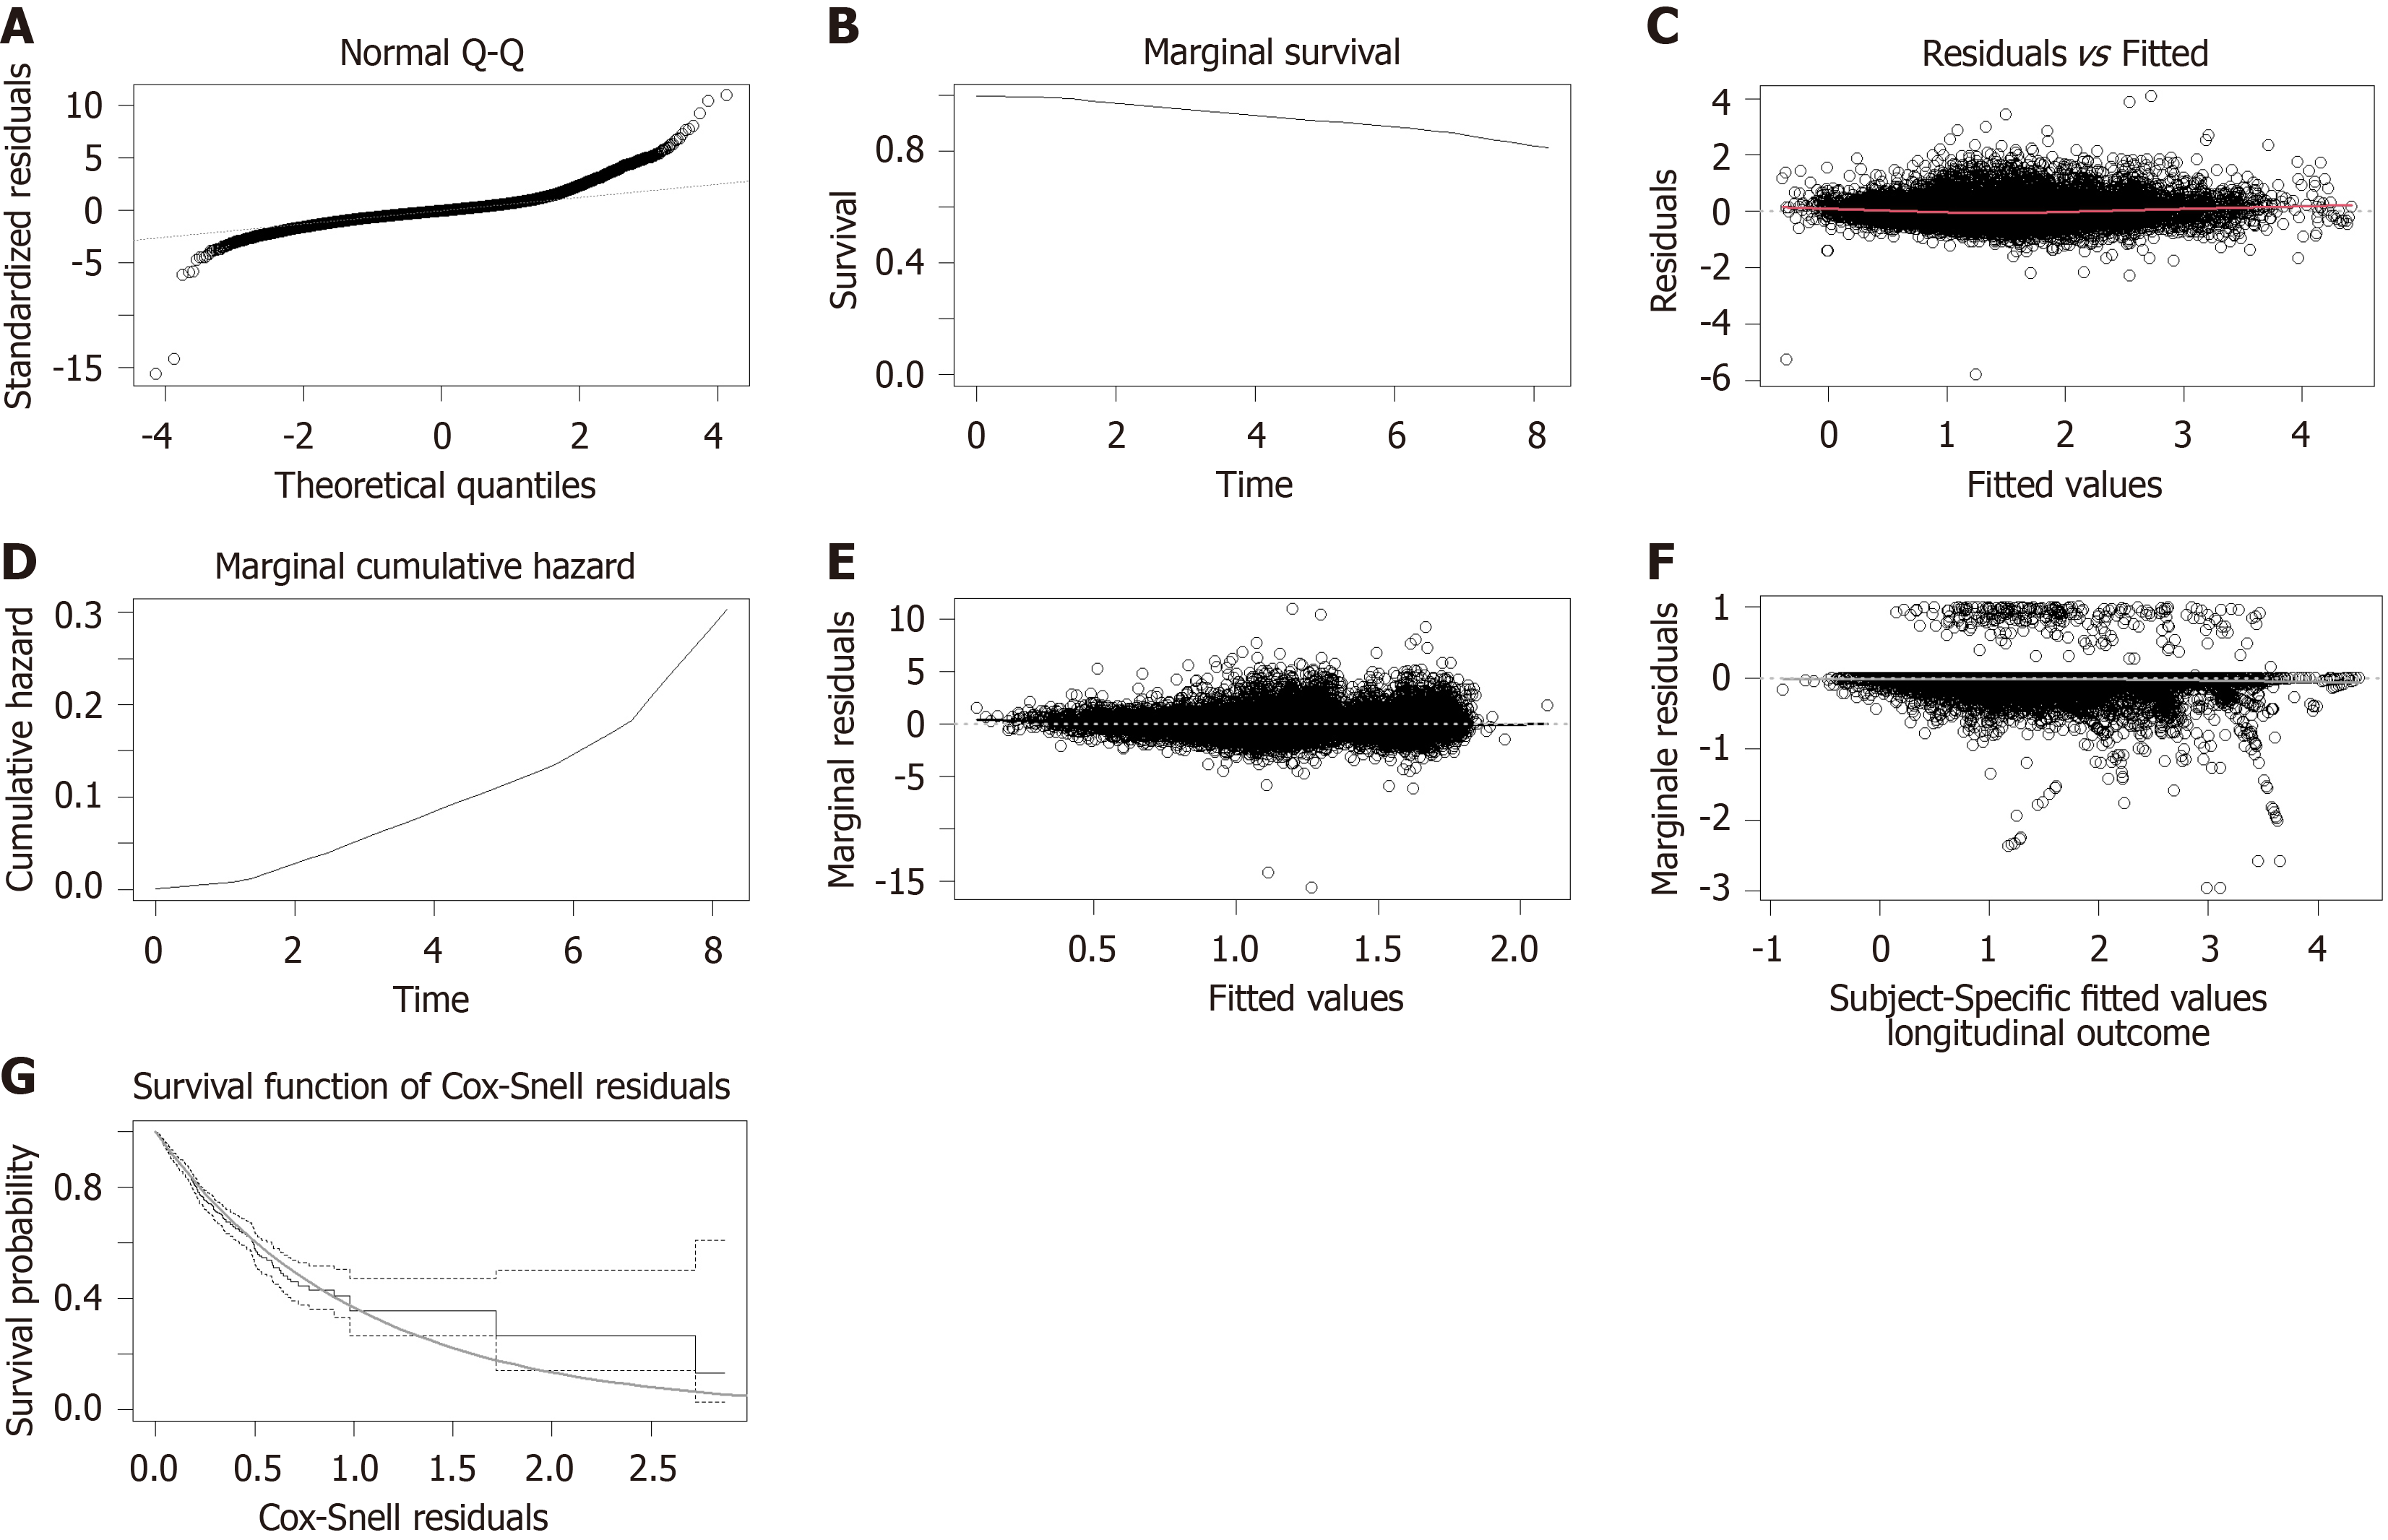
Figure 3 Analysis of the Joint Modeling of Longitudinal and Survival data for male.
A: Normal Q-Q plot of the residuals in the longitudinal process; B: Marginal survival function estimation curve during survival; C: Residuals and fitted data values in the longitudinal process; D: Marginal cumulative hazard function estimation curve throughout survival; E: Marginal residuals of the longitudinal portion of the joint model. The solid black line is the Loess smoothing curve fitted and based on standardized edge residuals, indicating a good fit as it approximates 0; F: Martingale residuals of the surviving portion of the joint model. The gray Loess smoothing curve, obtained from martingale residuals, is close to the 0 horizontal line, indicating reasonable assumptions between the time-dependent longitudinal part and the risk function; G: Cox–Snell residuals of the survival portion of the joint model. The gray curve is the cumulative risk value corresponding to the survival function. The Kaplan–Meier estimation is close to the exponential distribution of the cumulative risk function of the survival function. All diagnostic graphs showed that Joint Modeling of Longitudinal and Survival data fit well.
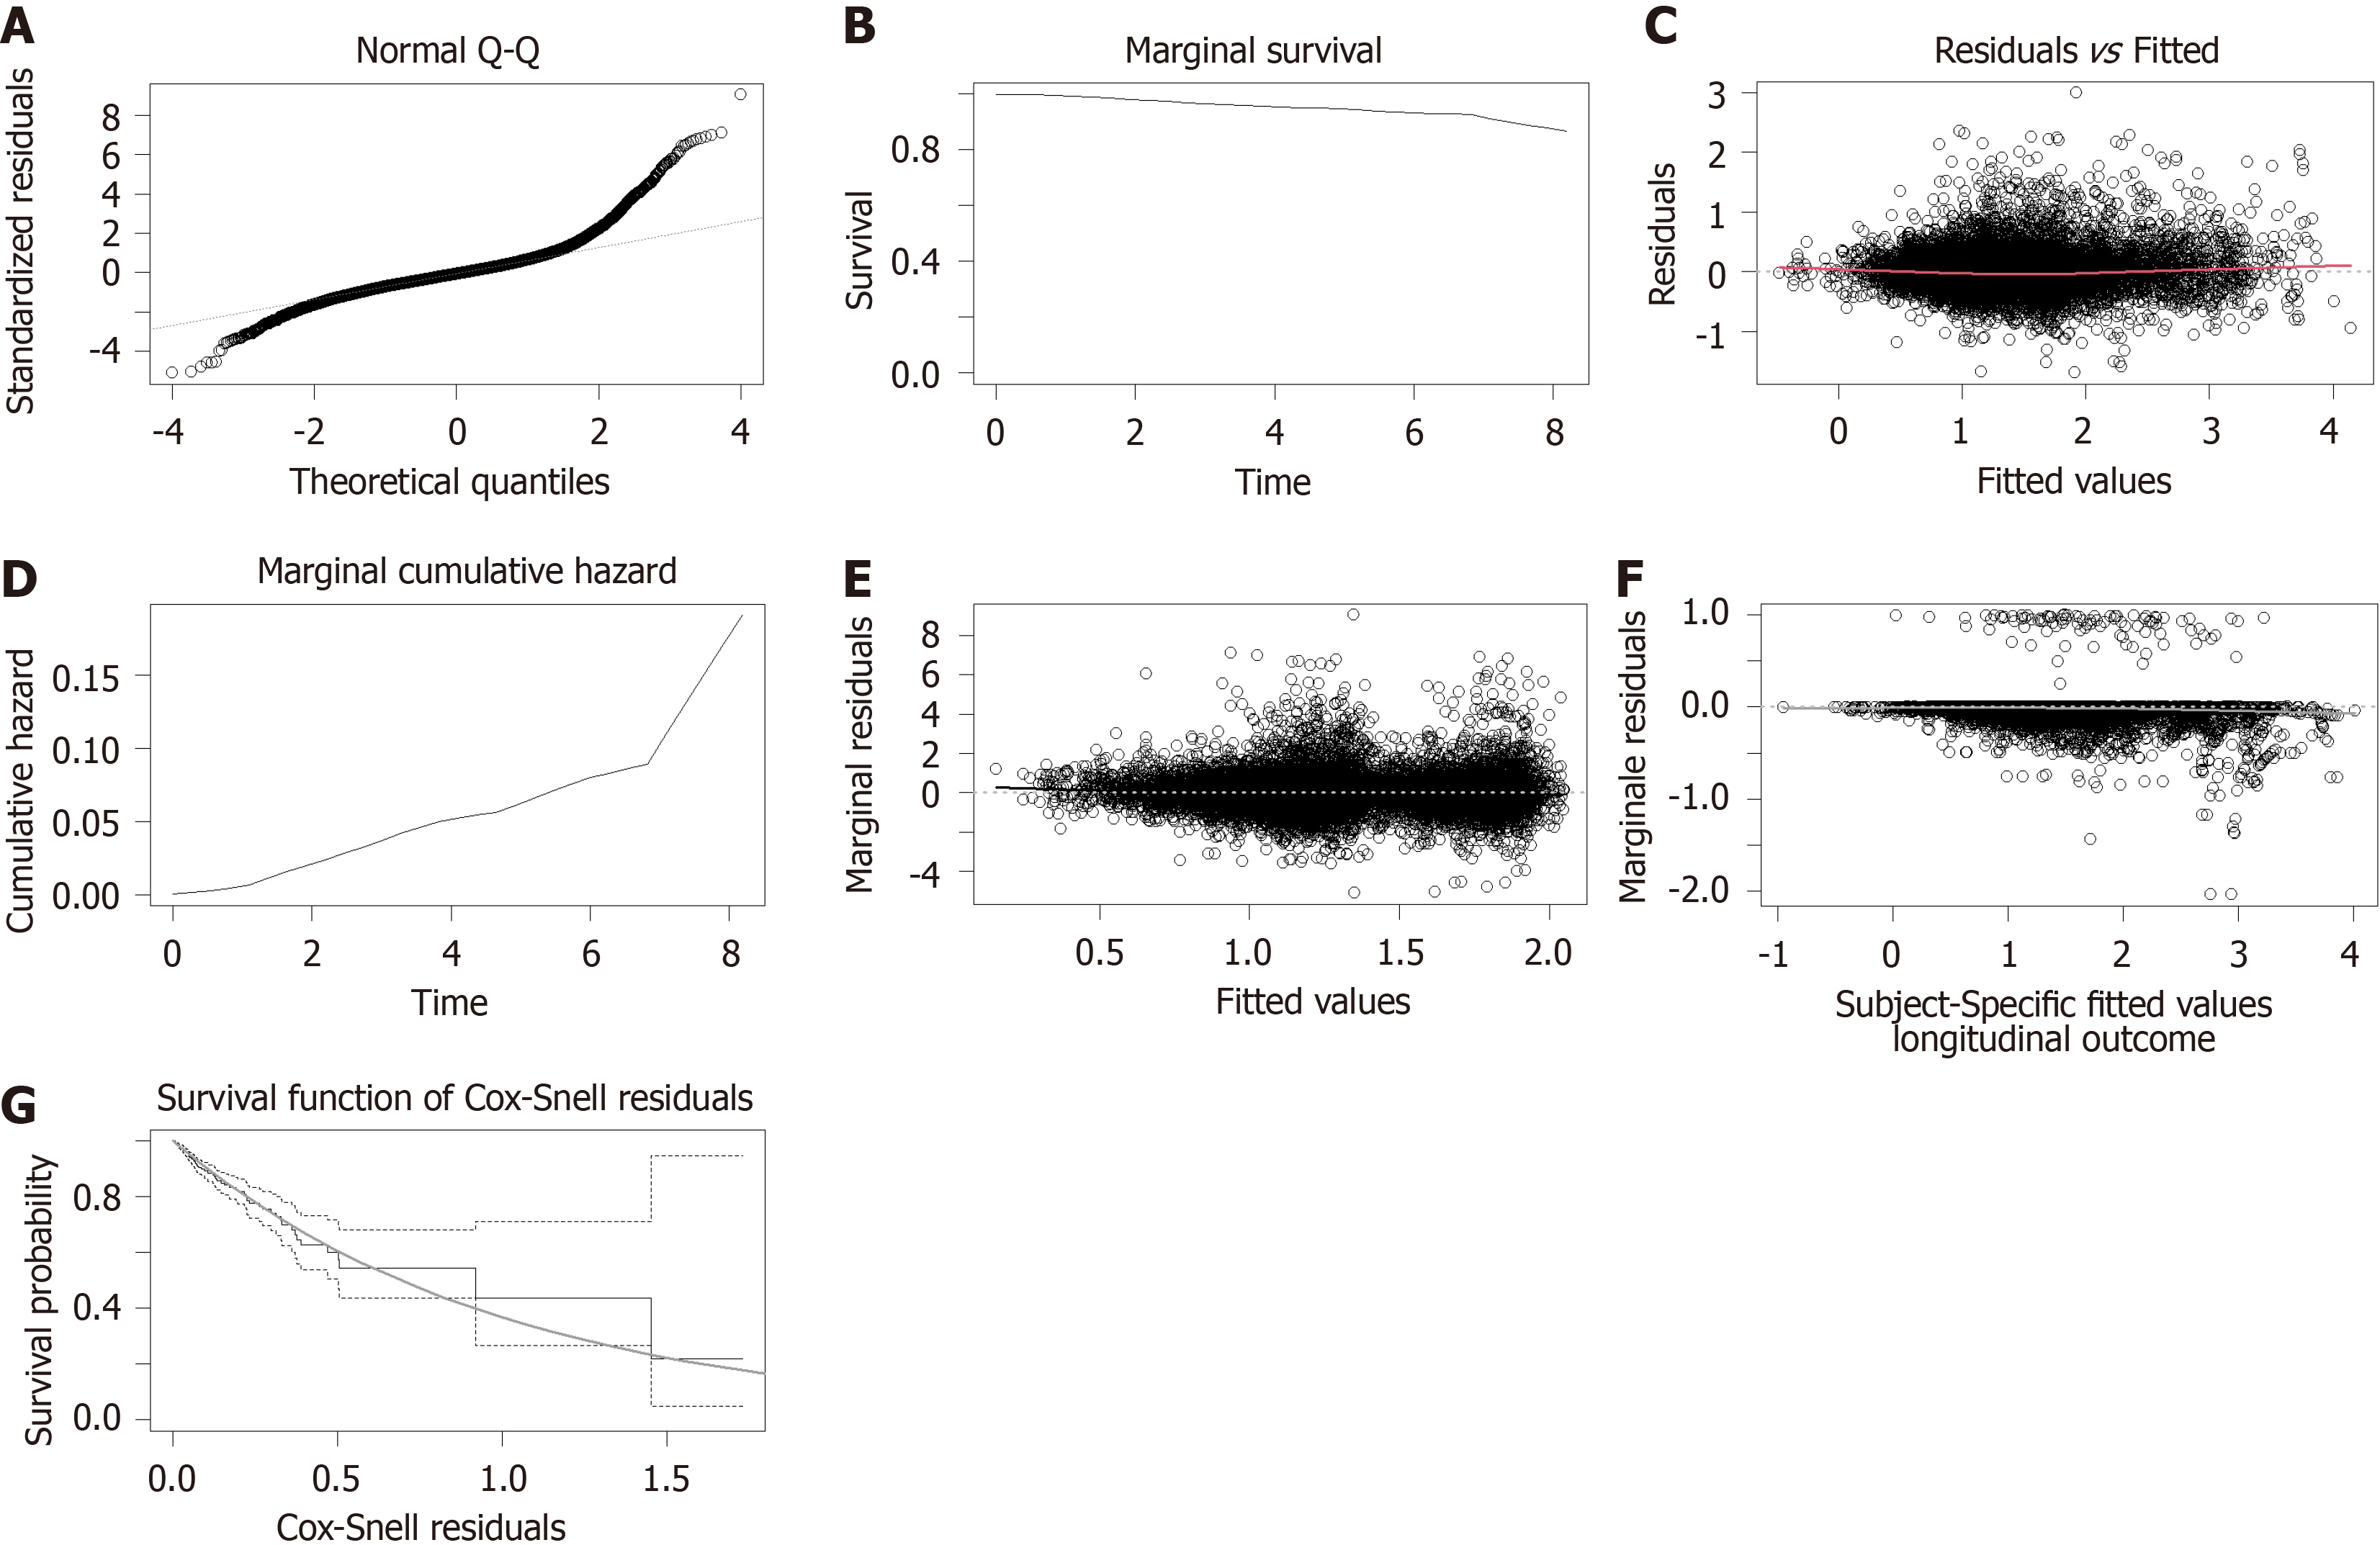
Figure 4 Analysis of the Joint Modeling of Longitudinal and Survival data for female.
A: Normal Q-Q plot of the residuals in the longitudinal process; B: Marginal survival function estimation curve during survival; C: Residuals and fitted data values in the longitudinal process; D: Marginal cumulative hazard function estimation curve throughout survival; E: Marginal residuals of the longitudinal portion of the joint model. The solid black line is the Loess smoothing curve fitted and based on standardized edge residuals, indicating a good fit as it approximates 0; F: Martingale residuals of the surviving portion of the joint model. The gray Loess smoothing curve, obtained from martingale residuals, is close to the 0 horizontal line, indicating reasonable assumptions between the time-dependent longitudinal part and the risk function; G: Cox–Snell residuals of the survival portion of the joint model. The gray curve is the cumulative risk value corresponding to the survival function. The Kaplan–Meier estimation is close to the exponential distribution of the cumulative risk function of the survival function. All diagnostic graphs showed that Joint Modeling of Longitudinal and Survival data fit well.
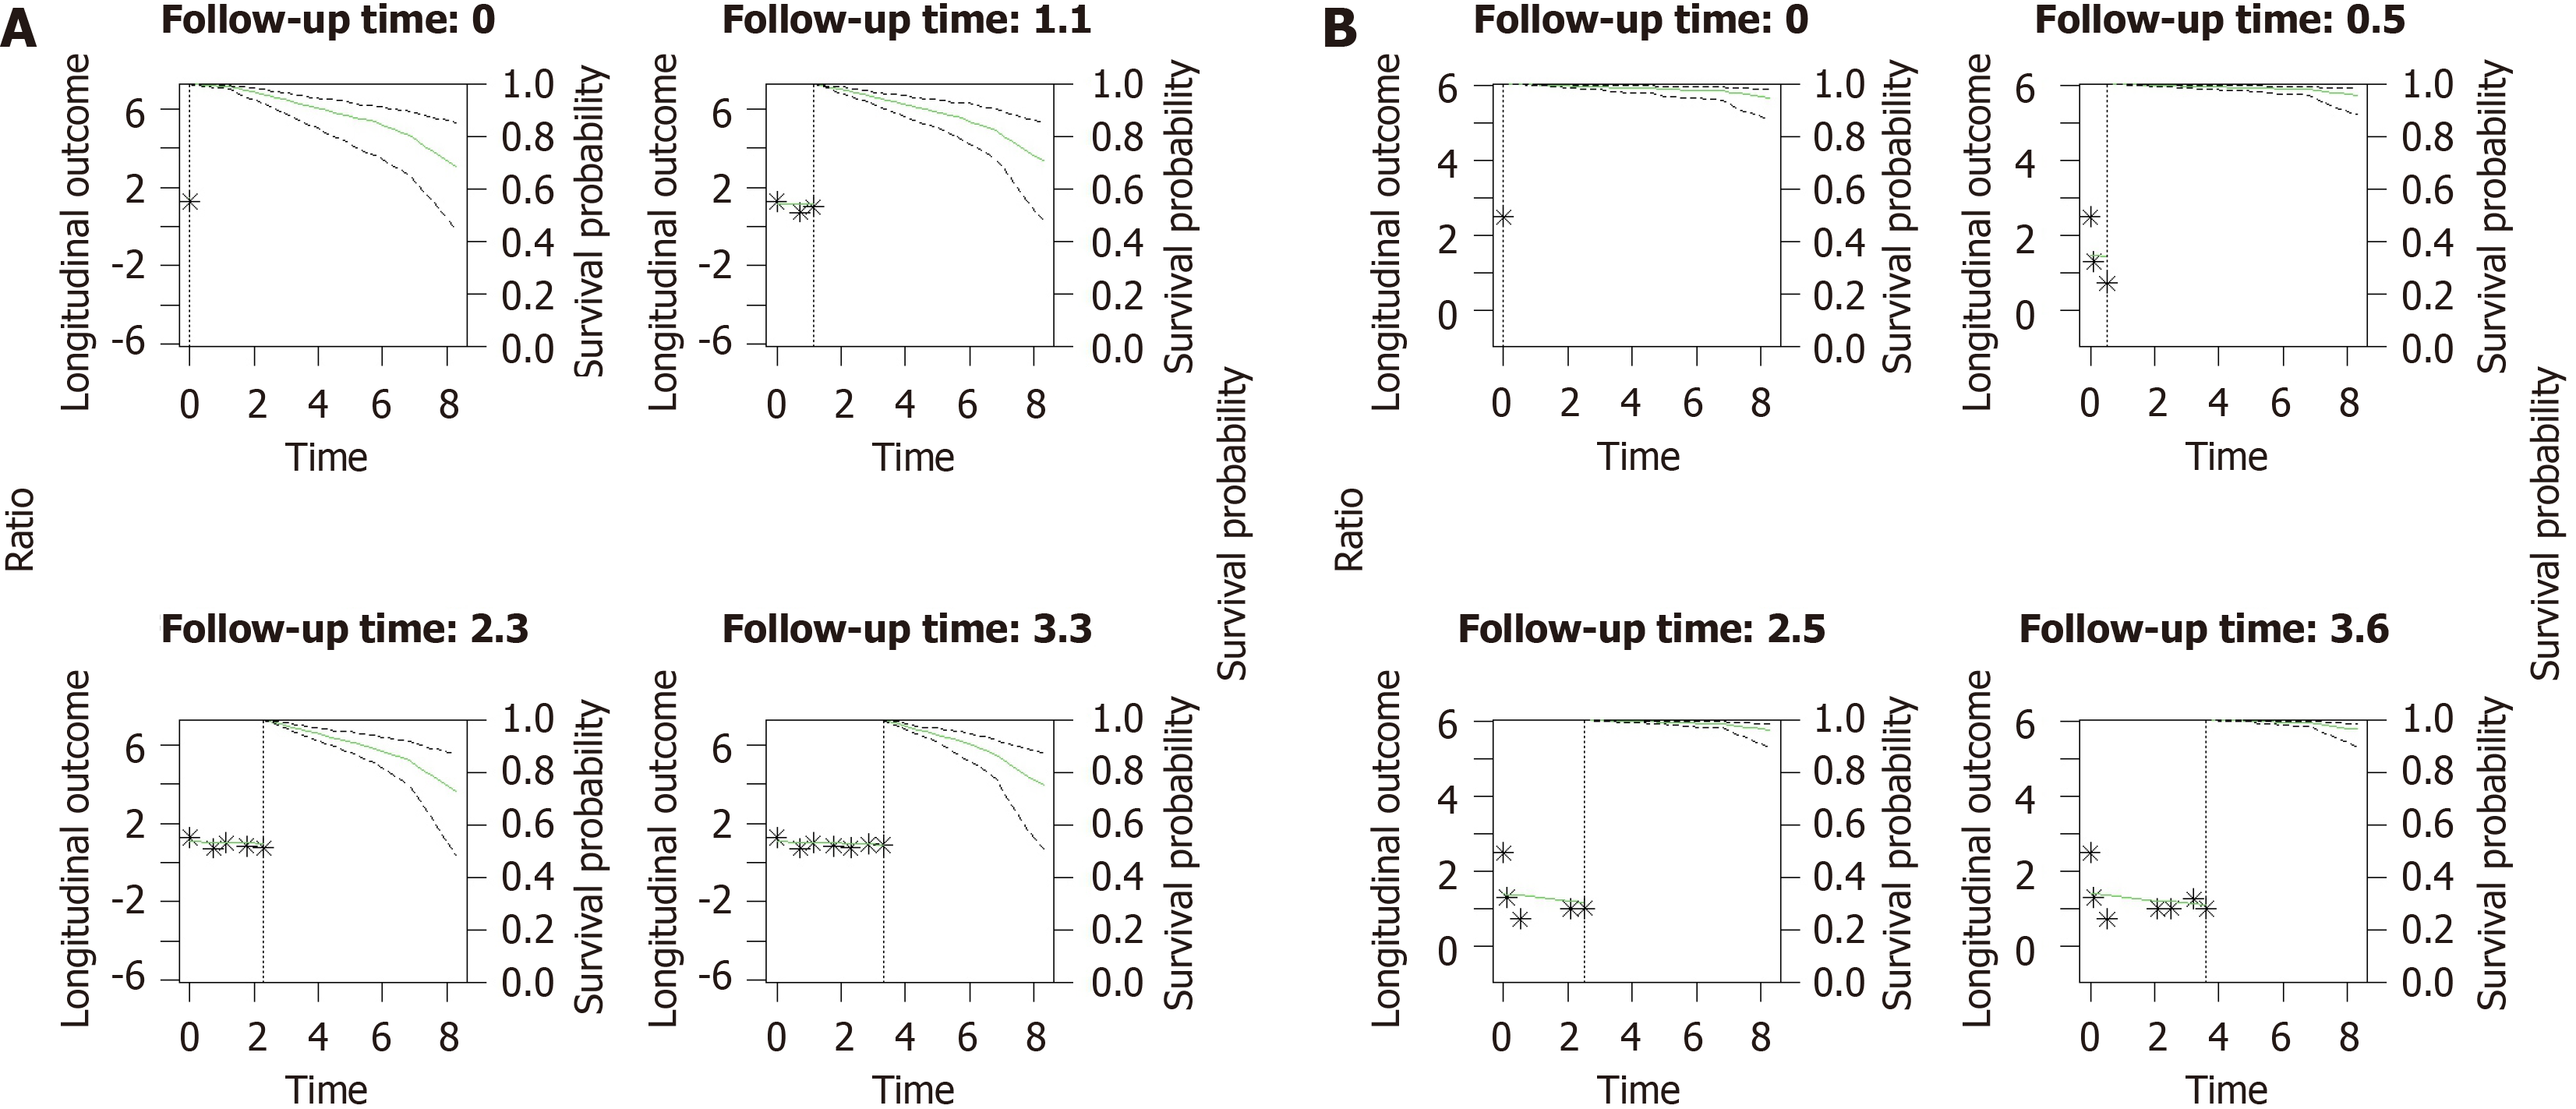
Figure 5 Prediction chart of the survival.
A: Males; B: Females. The dotted left line represents the longitudinal measurement trajectory of the patient; the solid and dashed lines on the right represent the survival predictive value and its 95%CI, respectively; ratio: Ln(10 alkaline phosphatase to prealbumin ratio).
- Citation: Zhen WC, Sun J, Bai XT, Zhang Q, Li ZH, Zhang YX, Xu RX, Wu W, Yao ZH, Pu CW, Li XF. Trends of alkaline phosphatase to prealbumin ratio in patients with hepatitis B linked to hepatocellular carcinoma development. World J Gastroenterol 2025; 31(2): 99349
- URL: https://www.wjgnet.com/1007-9327/full/v31/i2/99349.htm
- DOI: https://dx.doi.org/10.3748/wjg.v31.i2.99349


