Copyright
©The Author(s) 2025.
World J Gastroenterol. Apr 21, 2025; 31(15): 101058
Published online Apr 21, 2025. doi: 10.3748/wjg.v31.i15.101058
Published online Apr 21, 2025. doi: 10.3748/wjg.v31.i15.101058
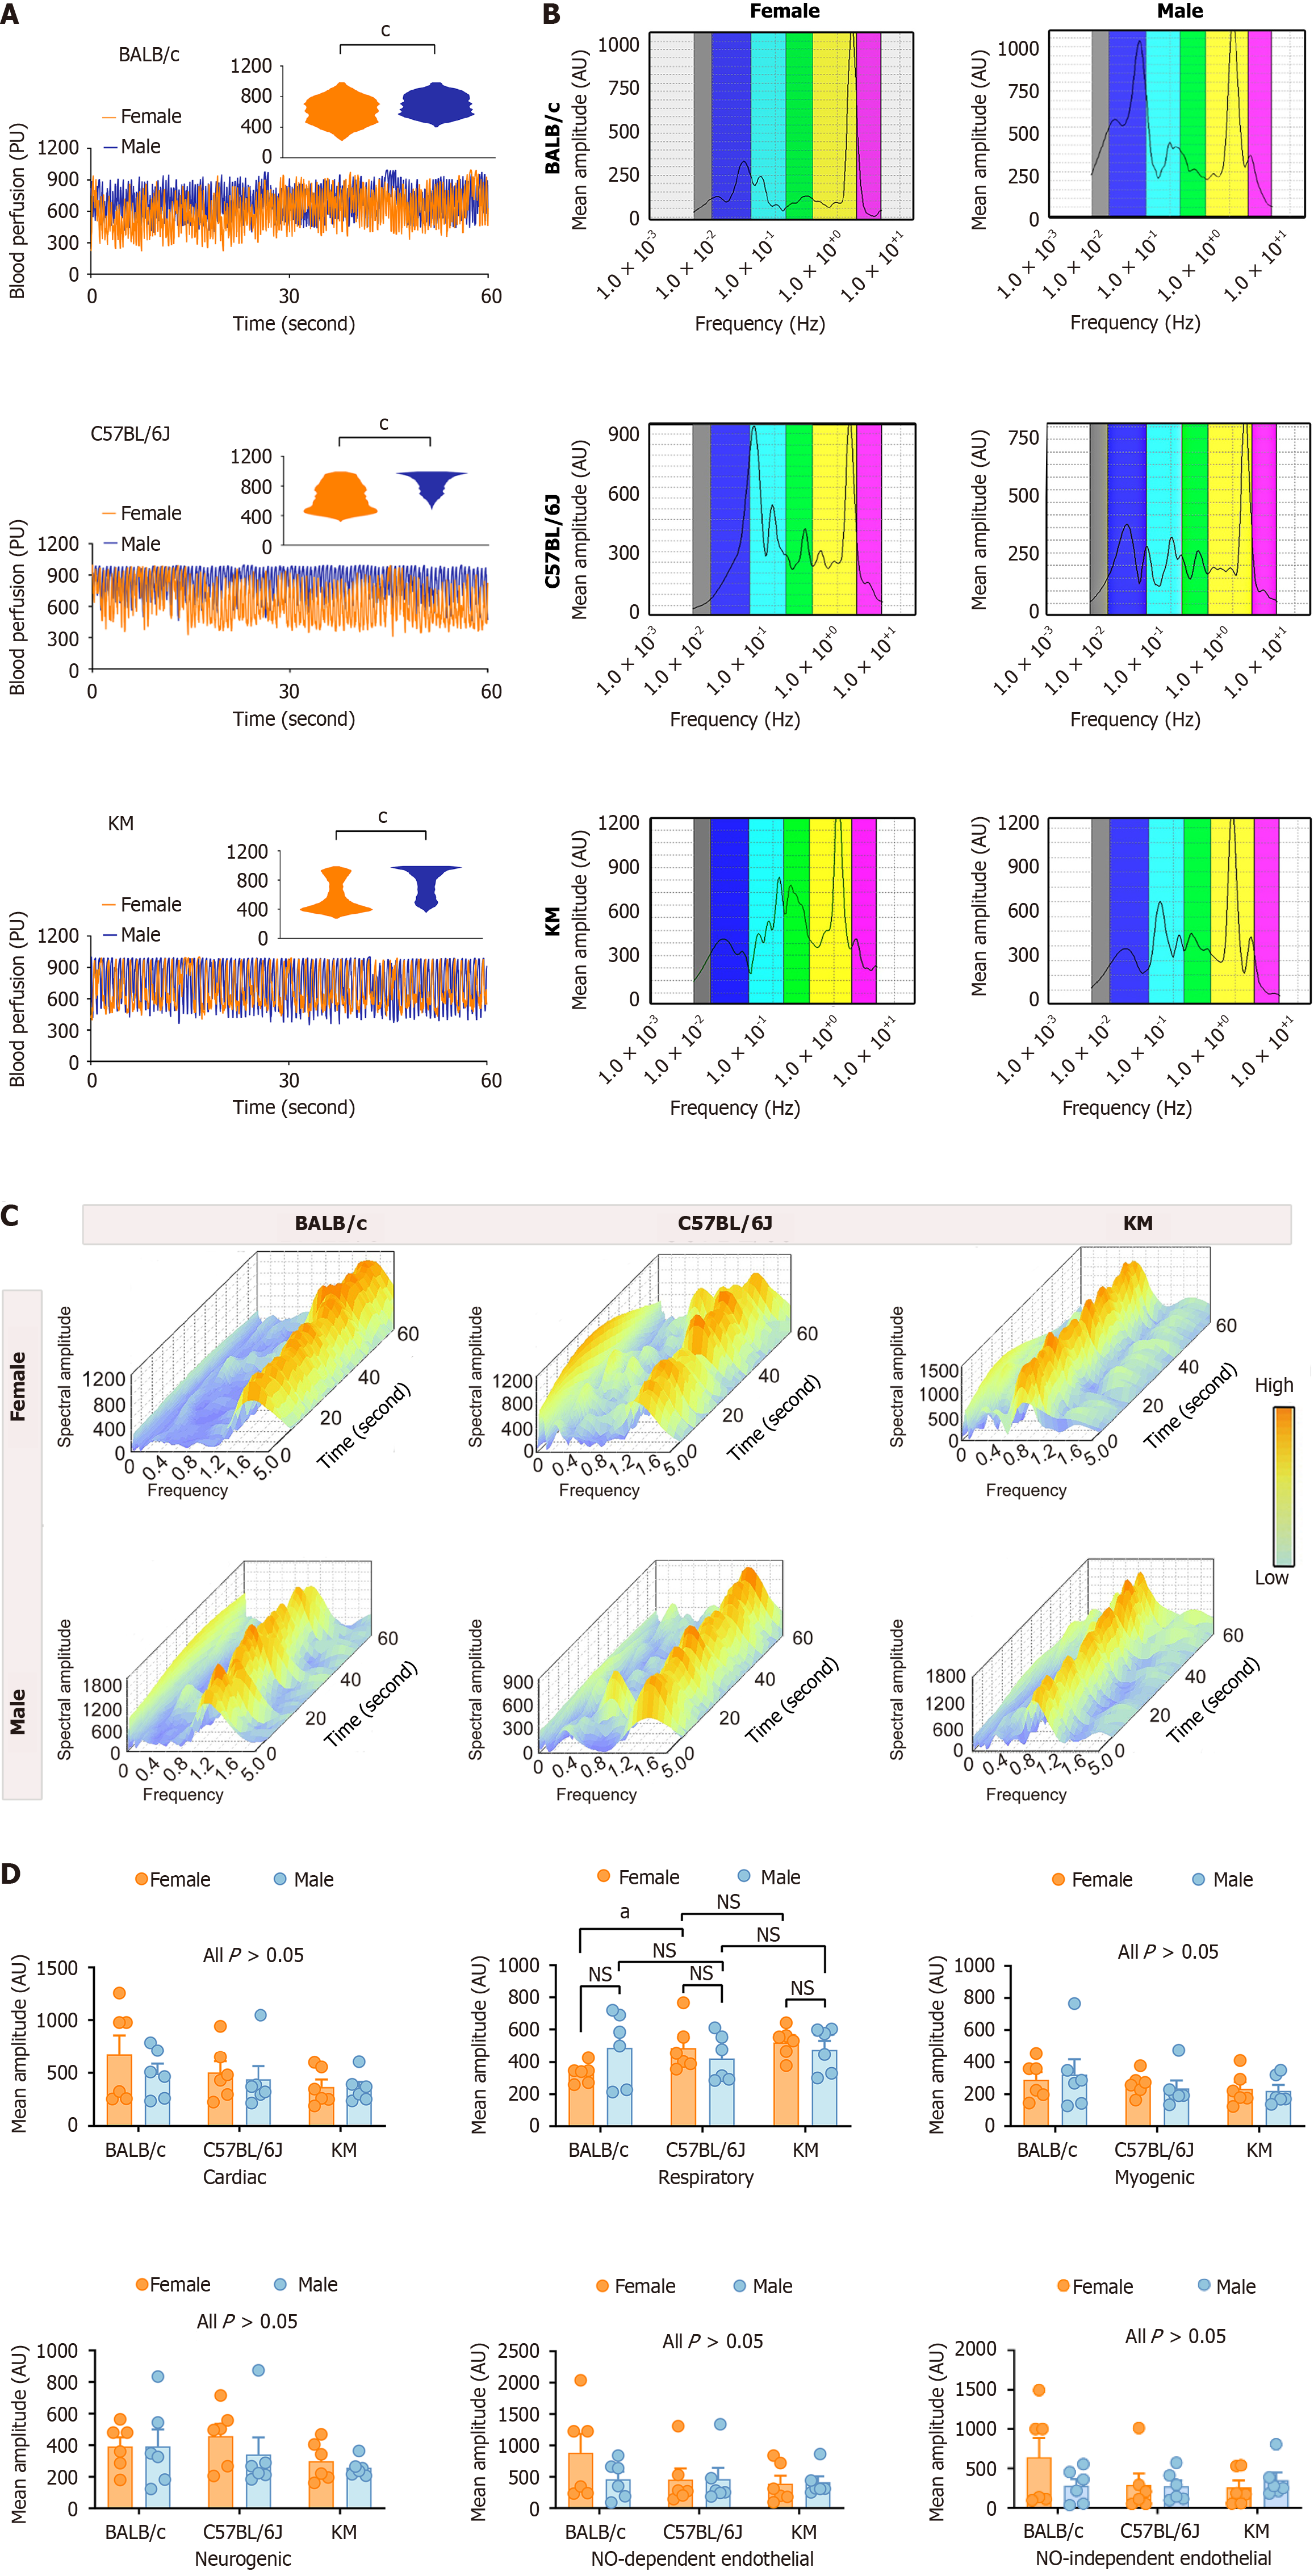
Figure 1 Comparative analysis of hepatic microcirculatory blood perfusion and characteristic oscillatory amplitudes between sexes and across three mouse strains.
A: Hepatic microcirculatory blood perfusion patterns in the BALB/c, C57BL/6J, and KM mouse strains. The rectangular insert highlights the extracted pattern of microcirculatory blood distribution; B and C: Two-dimensional and three-dimensional spectral scalograms representing the characteristic amplitudes of hepatic microcirculation profiles; D: Quantitative analysis of characteristic oscillatory amplitudes in hepatic microcirculatory blood perfusion profiles. The data are presented as the mean ± SEM. n = 6 each group. aP < 0.05. cP < 0.001. AU: Amplitude; NO: Nitric oxide; NS: Not significant; PU: Perfusion unit.
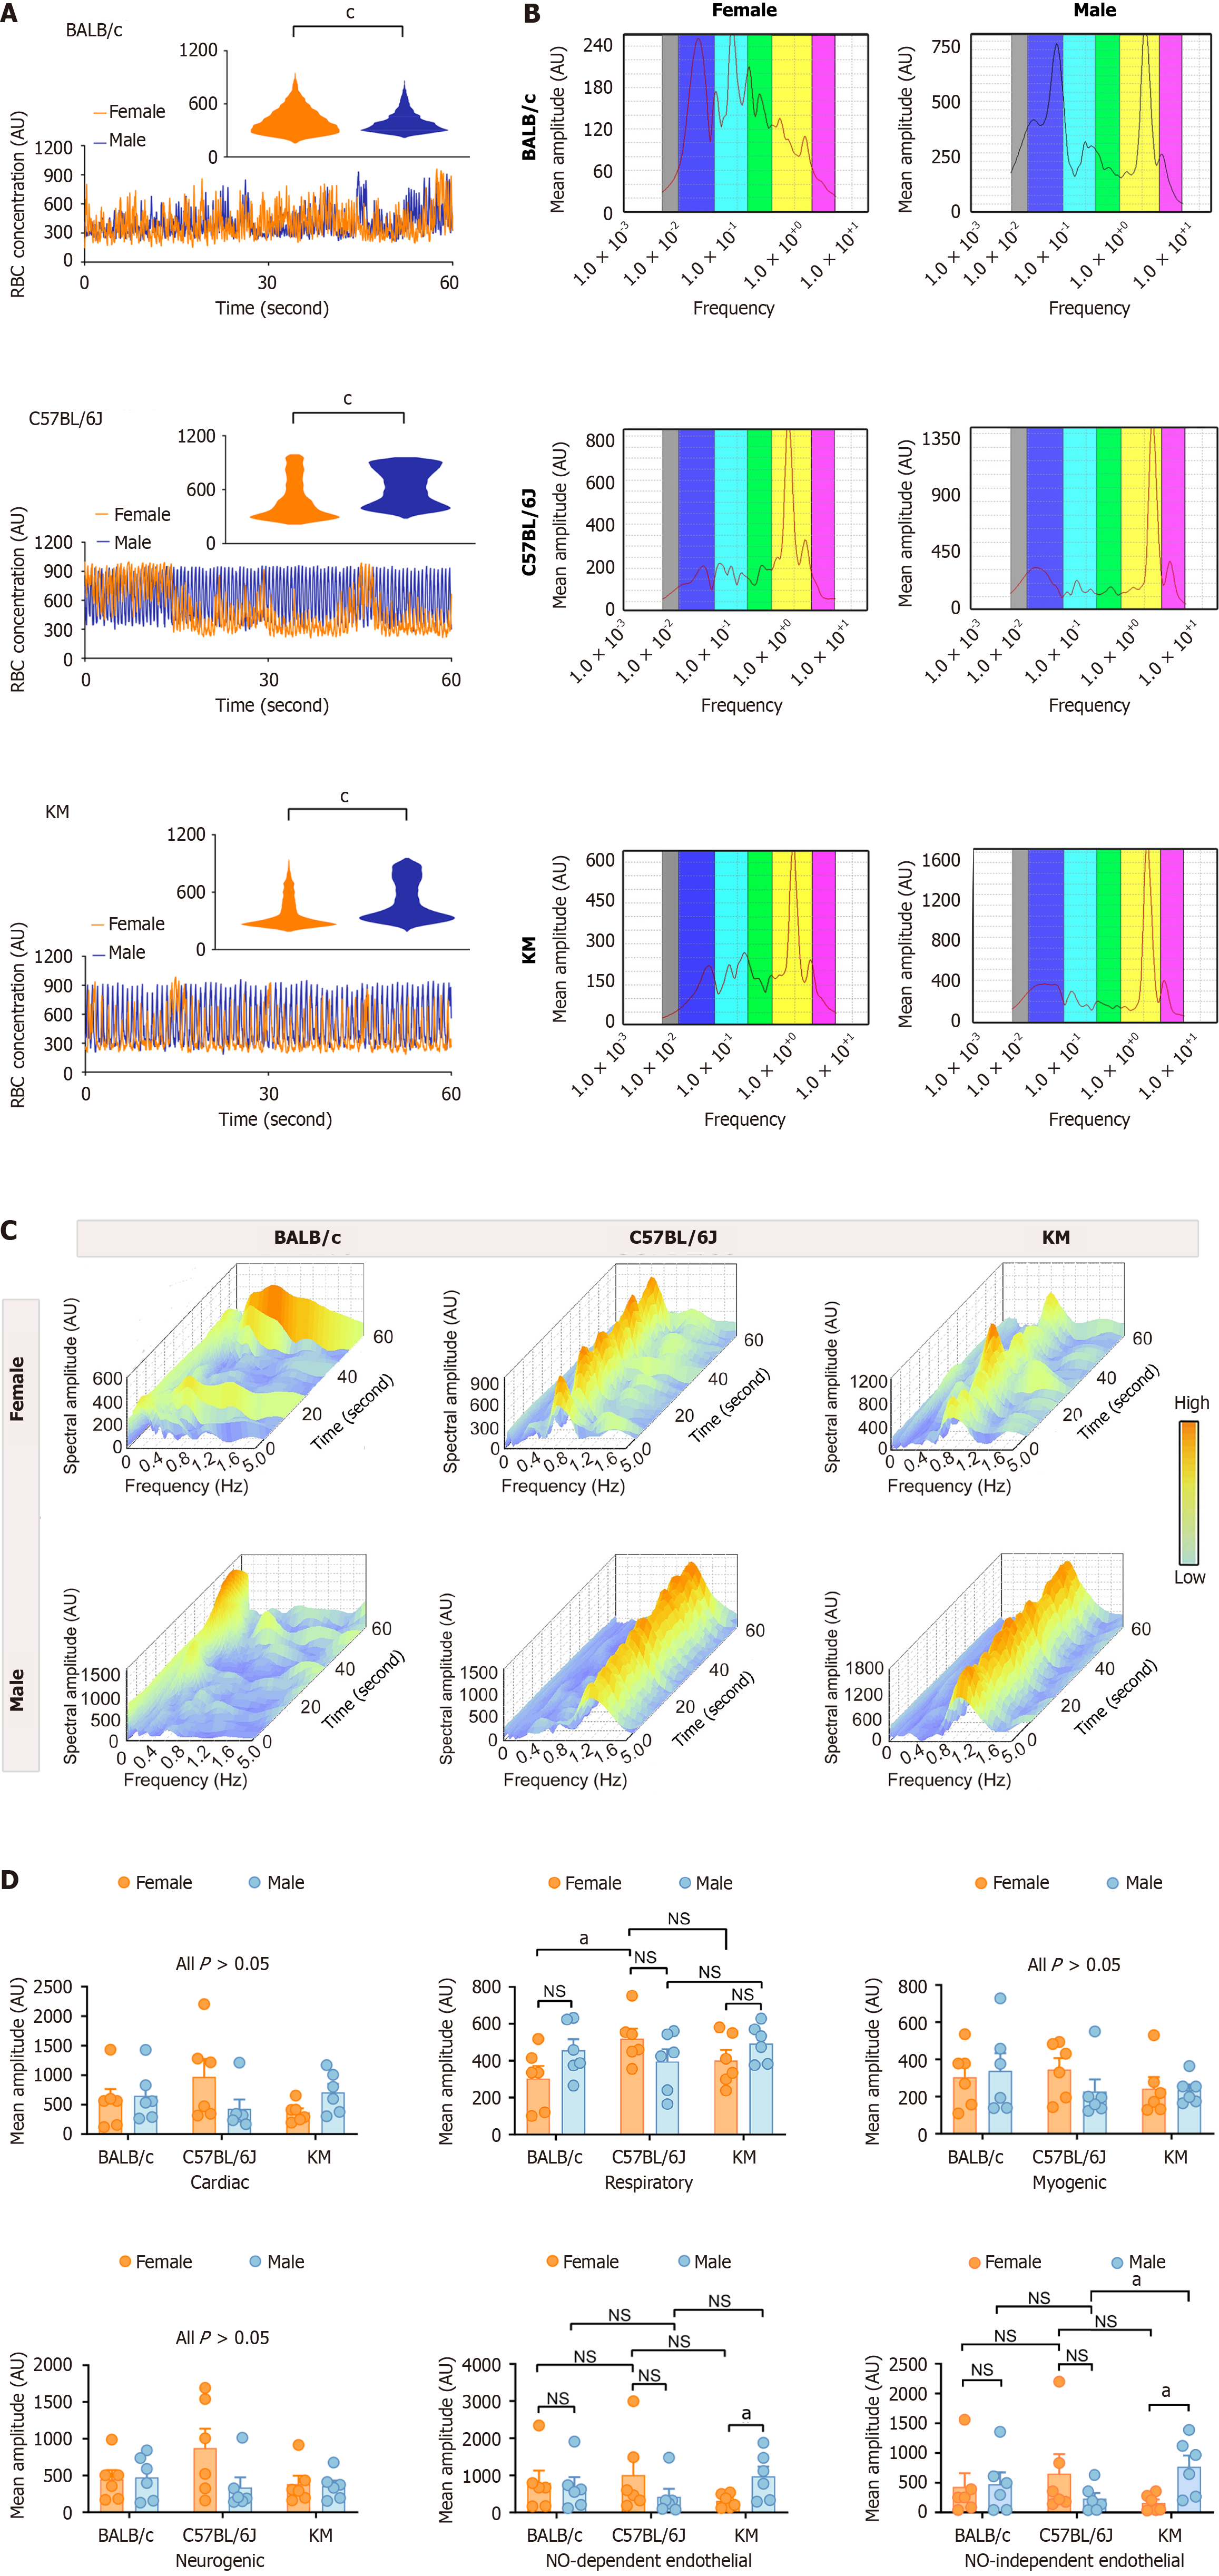
Figure 2 Comparative analysis of hepatic microcirculatory erythrocyte concentration between sexes and across three mouse strains.
A: Microcirculatory erythrocyte concentration in BALB/c, C57BL/6J, and KM mice. The distribution pattern of erythrocyte concentration is presented in the rectangular insert; B and C: Two-dimensional and three-dimensional spectral scalograms illustrating the characteristic amplitude of the hepatic microcirculatory erythrocyte concentration; D: Quantitative assessment of the characteristic oscillatory amplitudes from the hepatic microcirculatory erythrocyte concentration profiles. The data are presented as the mean ± SEM. n = 6 each group. aP < 0.05. cP < 0.001. AU: Amplitude; NO: Nitric oxide; NS: Not significant; PU: Perfusion unit.
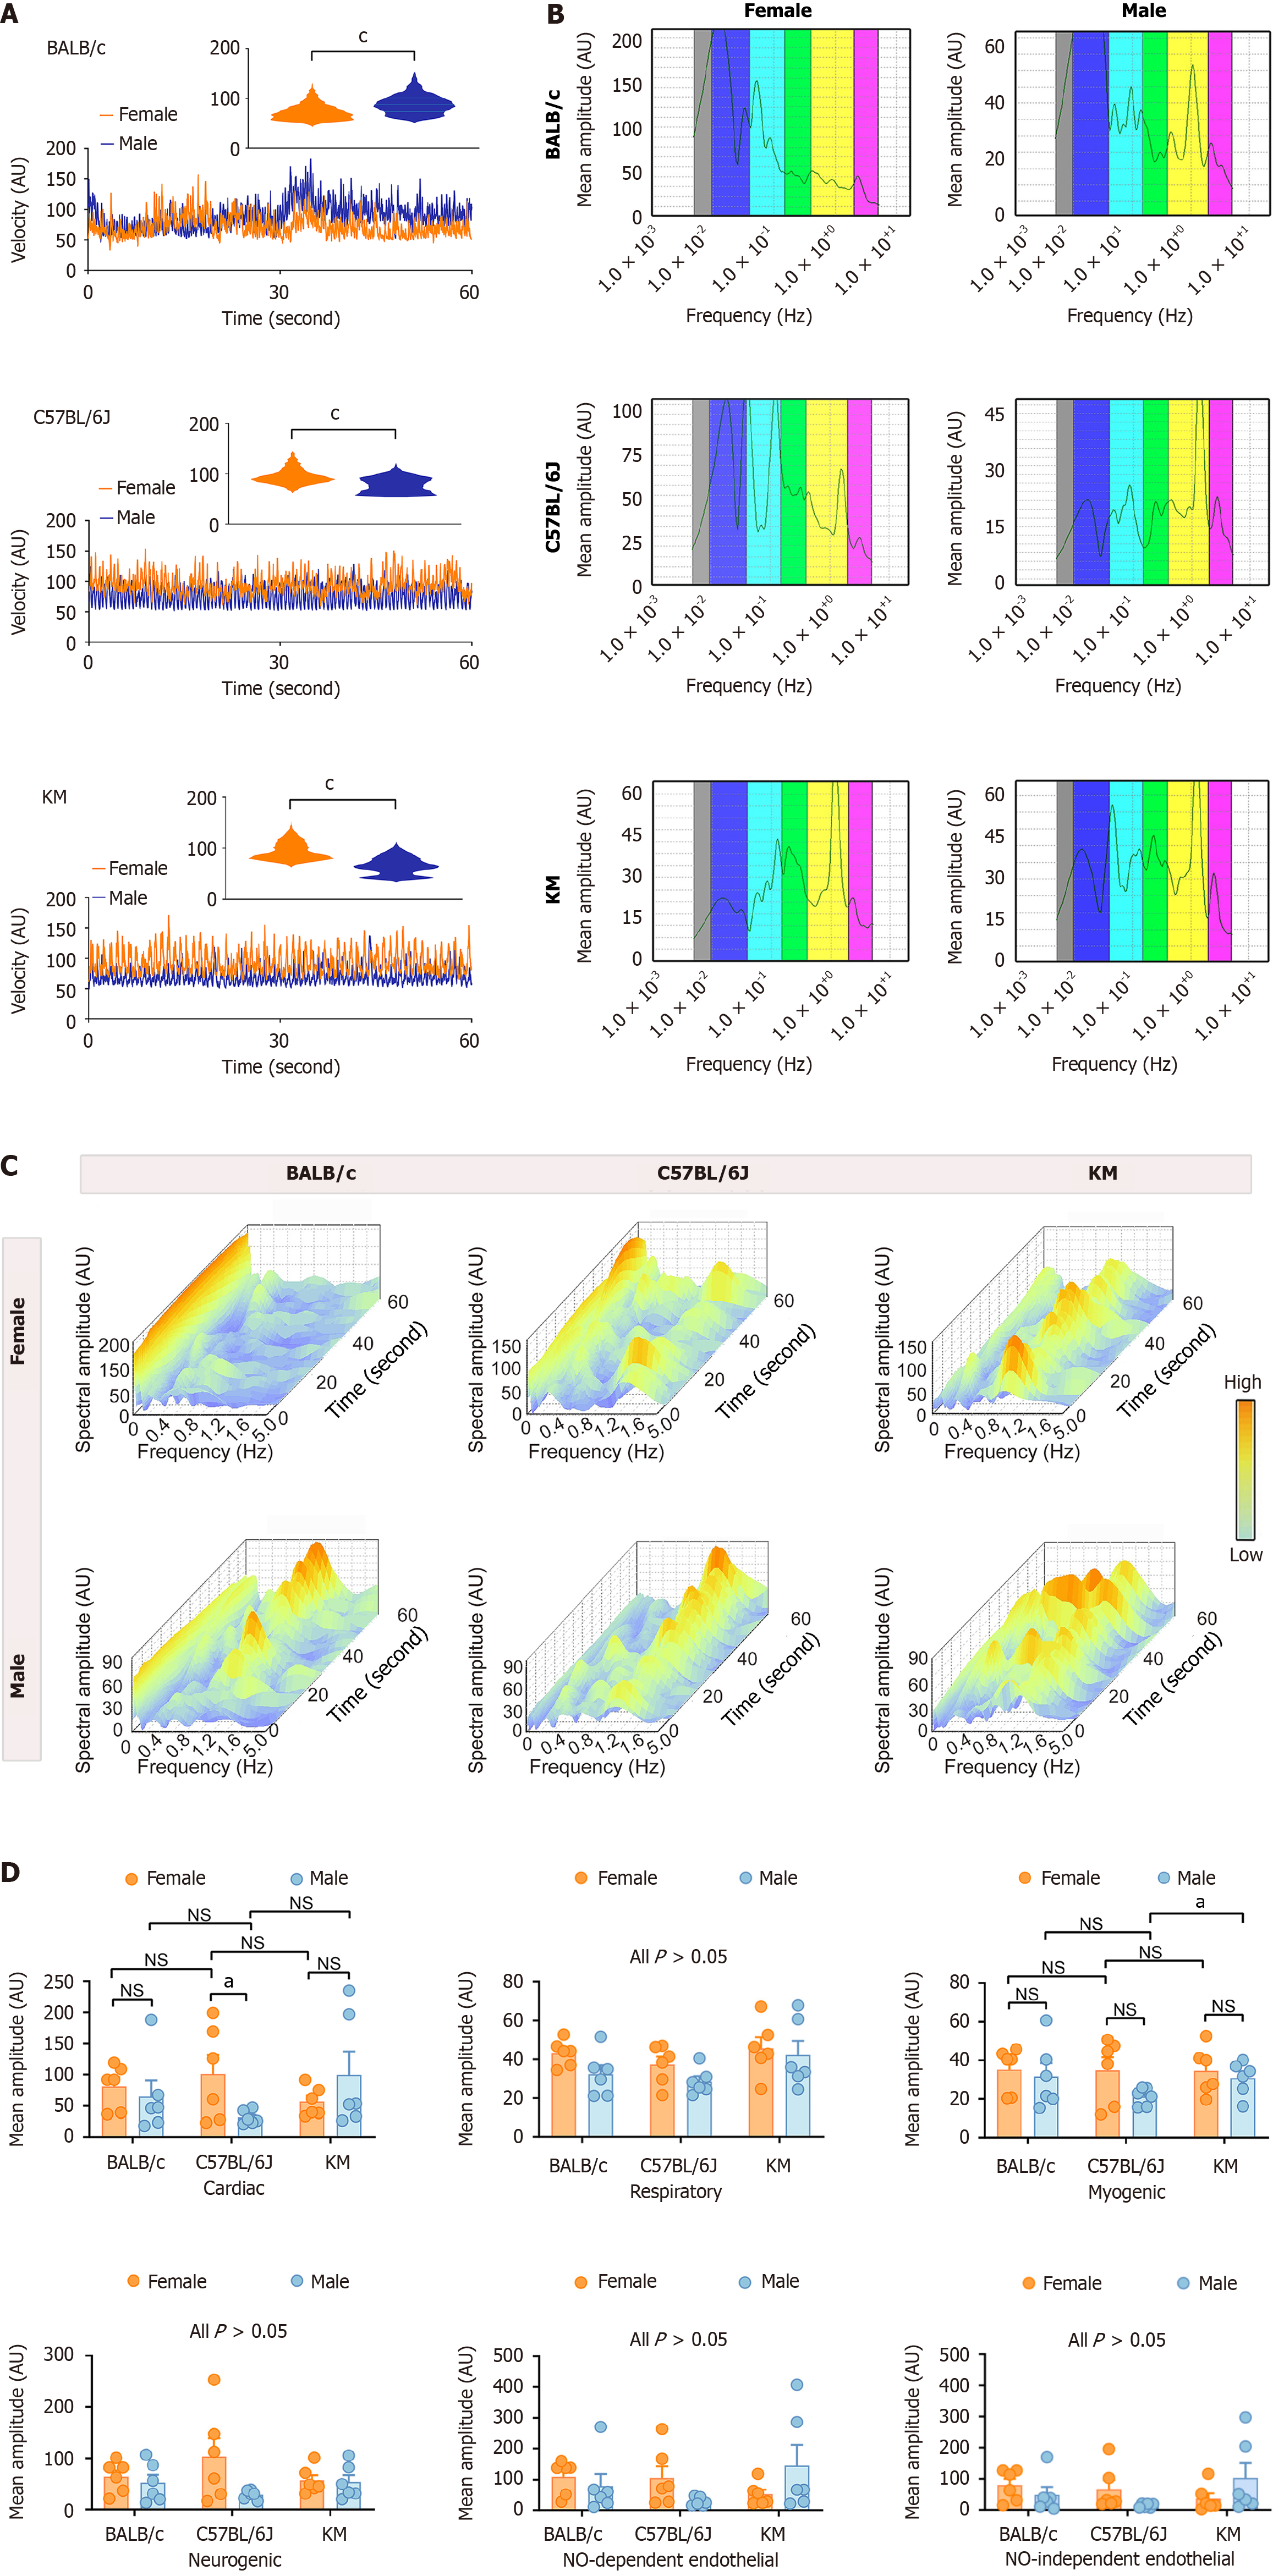
Figure 3 Comparative analysis of hepatic microcirculatory blood velocity between sexes and across three mouse strains.
A: Hepatic microcirculatory blood velocity in BALB/c, C57BL/6J, and KM mice. The rectangular insert provides a detailed view of the hepatic microcirculatory blood velocity distribution pattern; B and C: Two-dimensional and three-dimensional spectral scalograms demonstrating the characteristic amplitudes of the hepatic microcirculatory blood velocity profiles; D: Quantitative analysis of the characteristic oscillatory amplitudes in the hepatic microcirculatory blood velocity profiles. The data are presented as the mean ± SEM. n = 6 each group. aP < 0.05. cP < 0.001. AU: Amplitude; NO: Nitric oxide; NS: Not significant; PU: Perfusion unit.
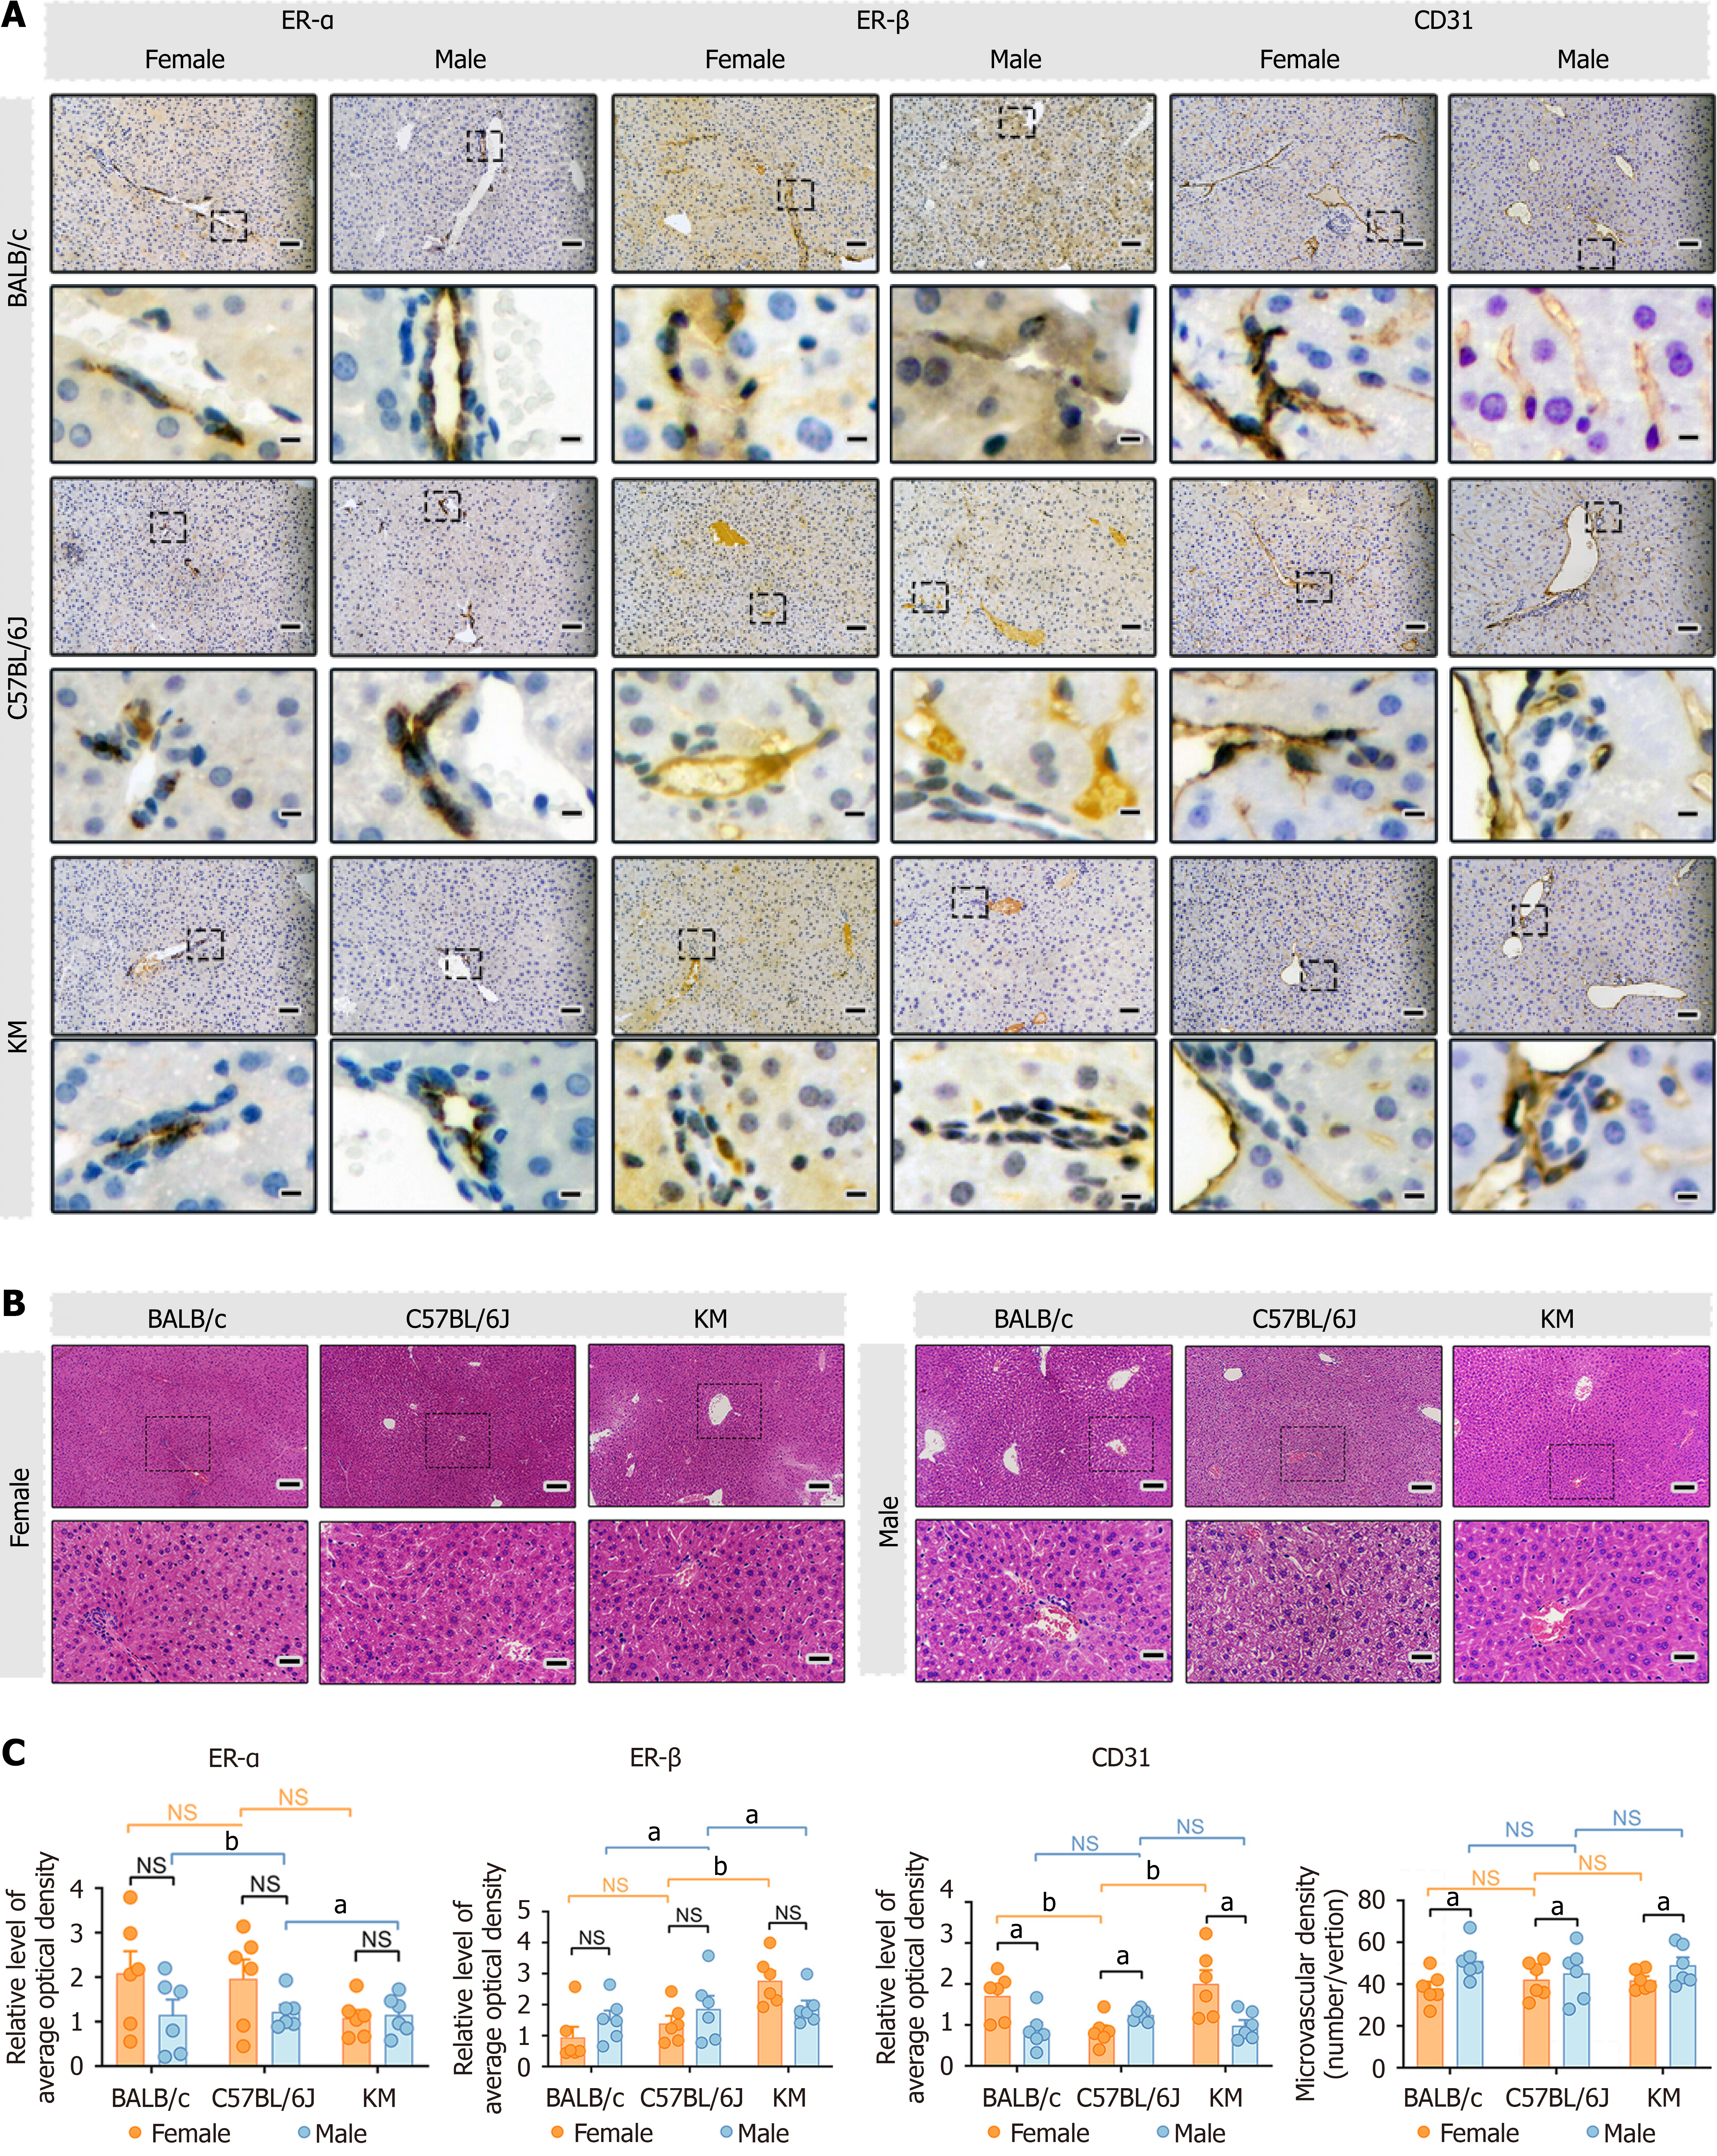
Figure 4 Hematoxylin and eosin staining and immunolabeling analysis of liver tissue from different sexes across BALB/c, C57BL/6J, and KM mice.
A: Hematoxylin and eosin (HE) and immunohistochemical staining of estrogen receptor α (ERα), and estrogen receptor β (ERβ), and cluster of differentiation (CD) 31 in the liver. The scale bar represents 50 μm. The insert in the lower panel provides a detailed representation of liver tissues at a higher magnification. Scale bar = 10 μm; B: HE staining of liver tissue sections revealing morphological details. Scale bar = 200 μm. The insert in the lower panel provides a detailed representation of liver tissues at a higher magnification. Scale bar = 50 μm; C: Quantitative analysis of the protein expression levels of ERα, ERβ, and CD31 and the microvascular density in the livers of BALB/c, C57BL/6J, and KM mice. For each group, n = 6 samples, and six microscopic fields of view were selected for each sample. The data are presented as the mean ± SEM. n = 6 each group. aP < 0.05. bP < 0.01. NS: Not significant; Erα: Estrogen receptor α; Erβ: Estrogen receptor β; CD31: Cluster of differentiation 31.
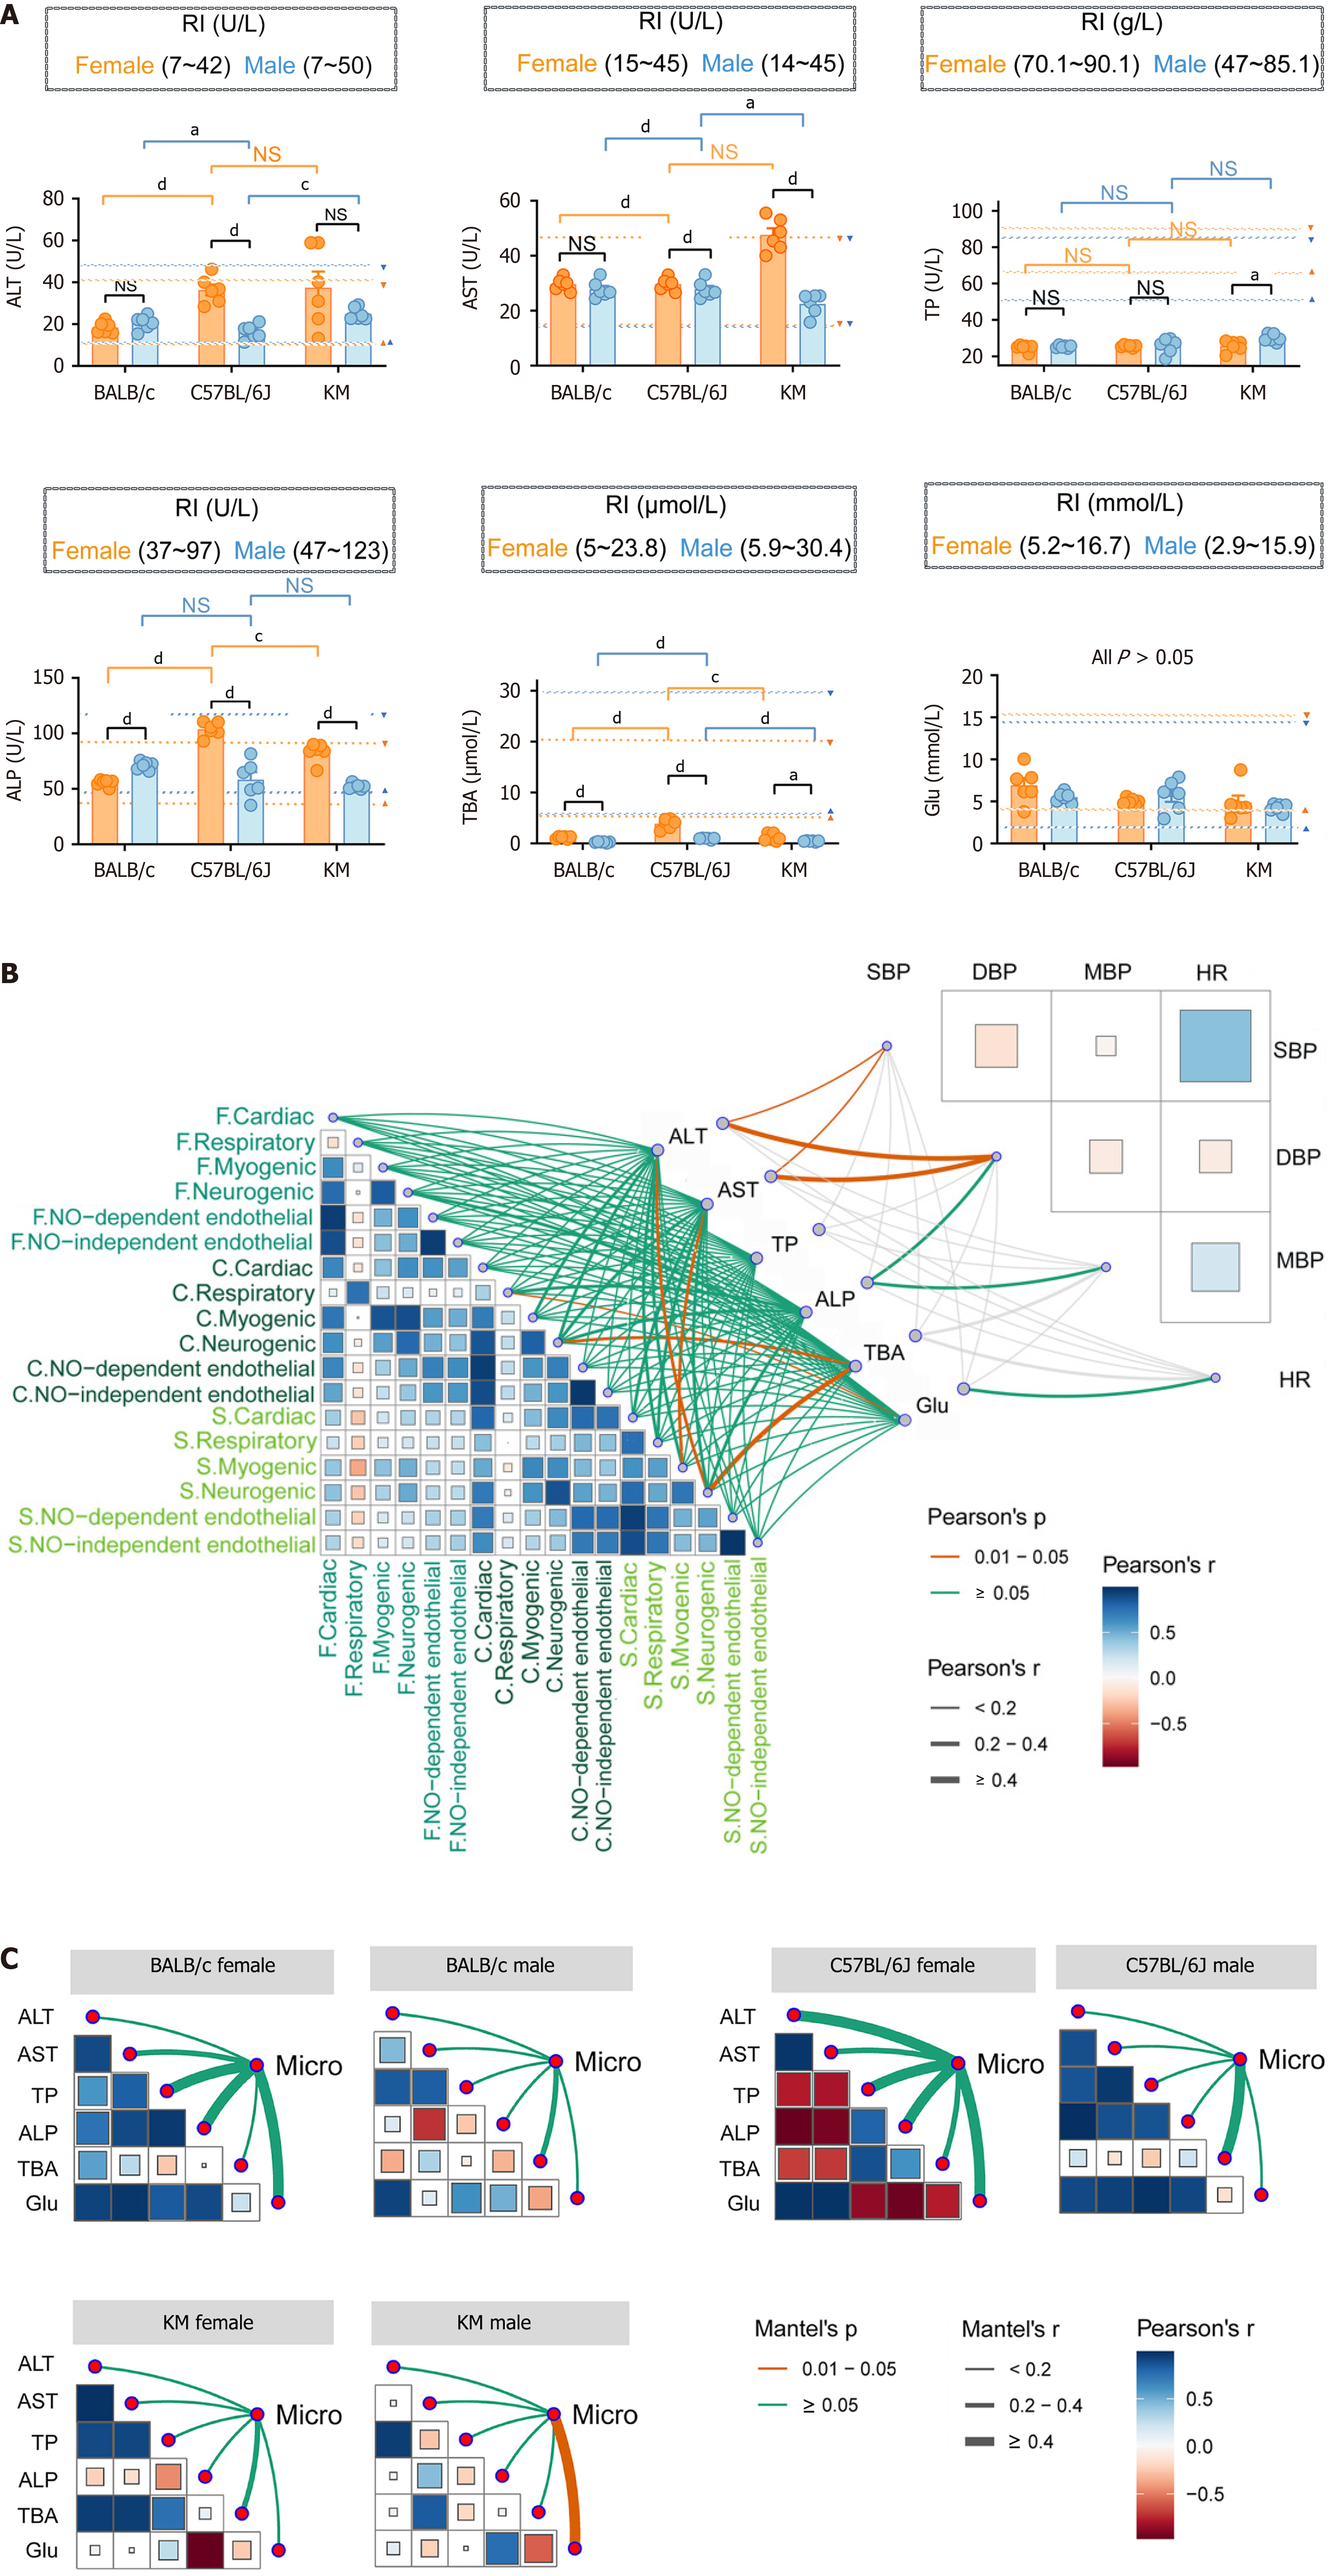
Figure 5 Relationship among hepatic microhemodynamics, liver function and macrohemodynamics.
A: Cross-comparison of liver function between different mouse strains and sexes. The established reference values for each of the five indicators are marked with dashed lines, with triangles serving as indicating markers. Yellow represents females, whereas blue signifies males; B: Interrelationships among the mean amplitudes of the three microhemodynamic indicators and macrohemodynamic indicators were analyzed using Pearson correlation analysis. The correlations among liver function indicators, hepatic microhemodynamics, and blood pressure and heart rate were shown respectively with connecting lines indicating these relationships. Microhemodynamics indicators: Flux, concentration, and speed; Liver function indicators: Alanine aminotransferase, aspartate aminotransferase, total protein, alkaline phosphatase, total bile acid, and glucose; Macrohemodynamics indicators: Heart rate, systolic blood pressure, mean arterial pressure, and diastolic blood pressure. P values are represented by the color, and r values are represented by the line thickness; C: The relationships between microhemodynamics and liver function, across different mouse strains and between sexes, were independently analyzed using the Mantel test (n = 6 each group). The edge width signifies the correlation strength, while the edge color indicates statistical significance. “Micro” indicates the mean amplitude of the five characteristic frequencies of flux, concentration, and speed. The data are presented as the mean ± SEM. n = 6 each group. aP < 0.05. cP < 0.001. dP < 0.0001. RI: Respiratory index; ALT: Alanine aminotransferase; AST: Aspartate aminotransferase; TP: Total protein; ALP: Alkaline phosphatase; TBA: Total bile acid; Glu: Glucose; SBP: Systolic blood pressure; HR: Heart rate; DBP: Diastolic blood pressure; MBP: Mean arterial pressure.
- Citation: Wang B, Li Y, Ouyang Q, Xu MT, Wang YY, Fu SJ, Liu WQ, Liu XT, Ling H, Zhang X, Xiu RJ, Liu MM. Strain- and sex-dependent variability in hepatic microcirculation and liver function in mice. World J Gastroenterol 2025; 31(15): 101058
- URL: https://www.wjgnet.com/1007-9327/full/v31/i15/101058.htm
- DOI: https://dx.doi.org/10.3748/wjg.v31.i15.101058


