Copyright
©The Author(s) 2024.
World J Gastroenterol. Mar 7, 2024; 30(9): 1177-1188
Published online Mar 7, 2024. doi: 10.3748/wjg.v30.i9.1177
Published online Mar 7, 2024. doi: 10.3748/wjg.v30.i9.1177
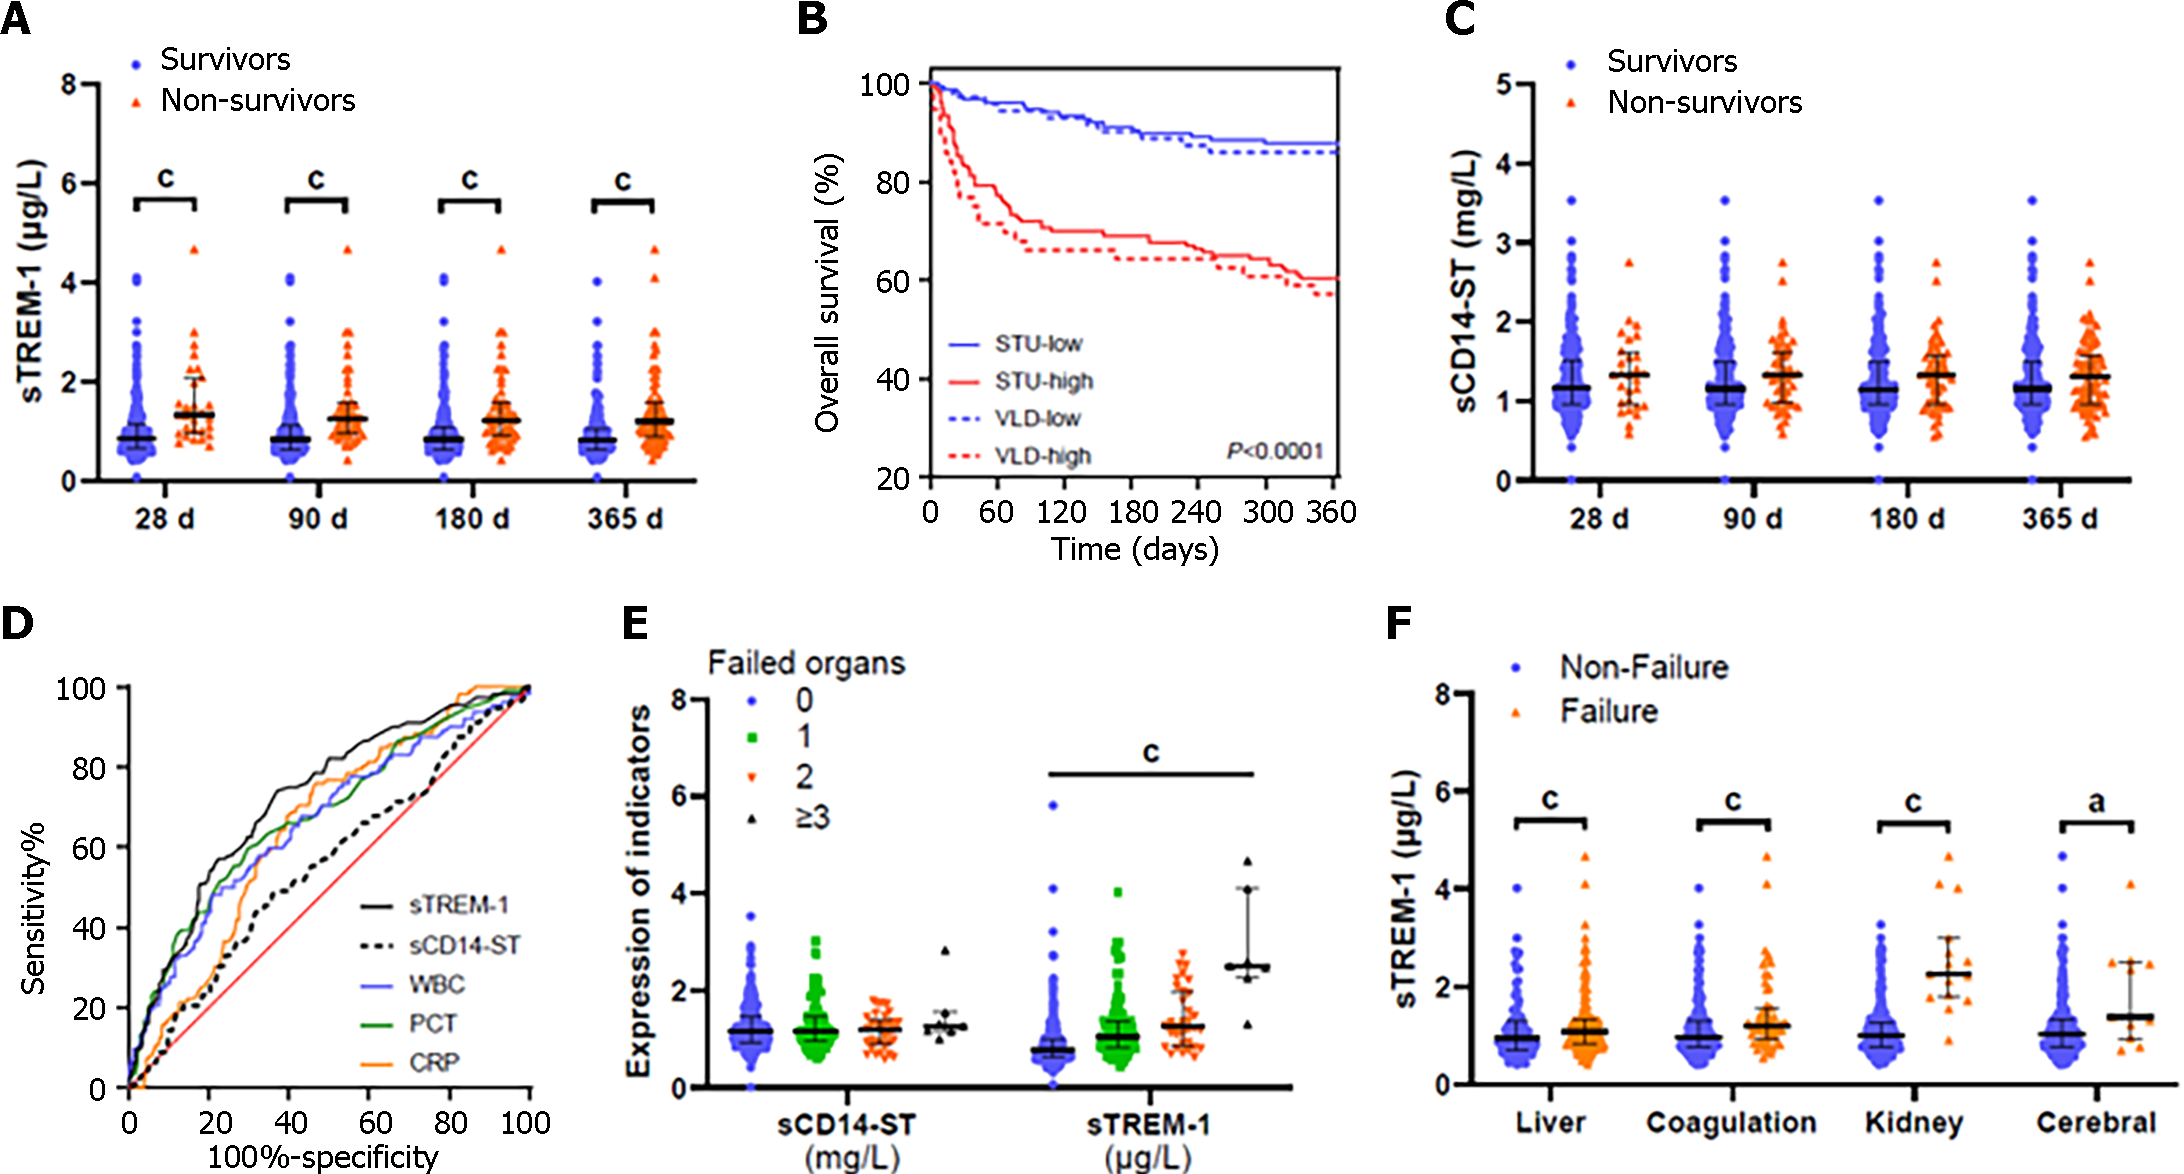
Figure 1 Association of soluble triggering receptor expressed on myeloid cell-1 at admission with prognosis and organ failure in patients with acute decompensation of cirrhosis.
A: Soluble triggering receptor expressed on myeloid cell-1 (sTREM-1) distribution in study cohort (median with interquartile range); B: Survival rates after 1-year (365-d) of patients in the “high” and “low” sTREM-1 groups in the study and validation cohorts; C: Soluble CD14 subtype (sCD14-ST) distribution in study cohort (median with interquartile range); D: Prediction of 1-year mortality according to sTREM-1, sCD14-ST, white blood cell, C-reactive protein and procalcitonin; E: sCD14-ST or sTREM-1 Levels according to the numbers of failed organs; F: sTREM-1 distribution of patients with and without liver, coagulation, kidney, or cerebral failure. aP < 0.05, cP < 0.001. ACLF: Acute-on-chronic liver failure; CRP: C-reactive protein; PCT: Procalcitonin; sCD14-ST: Soluble CD14 subtype; sTREM-1: Soluble triggering receptor expressed on myeloid cell-1; STU: Study; VLD: Validation; WBC: White blood cell.
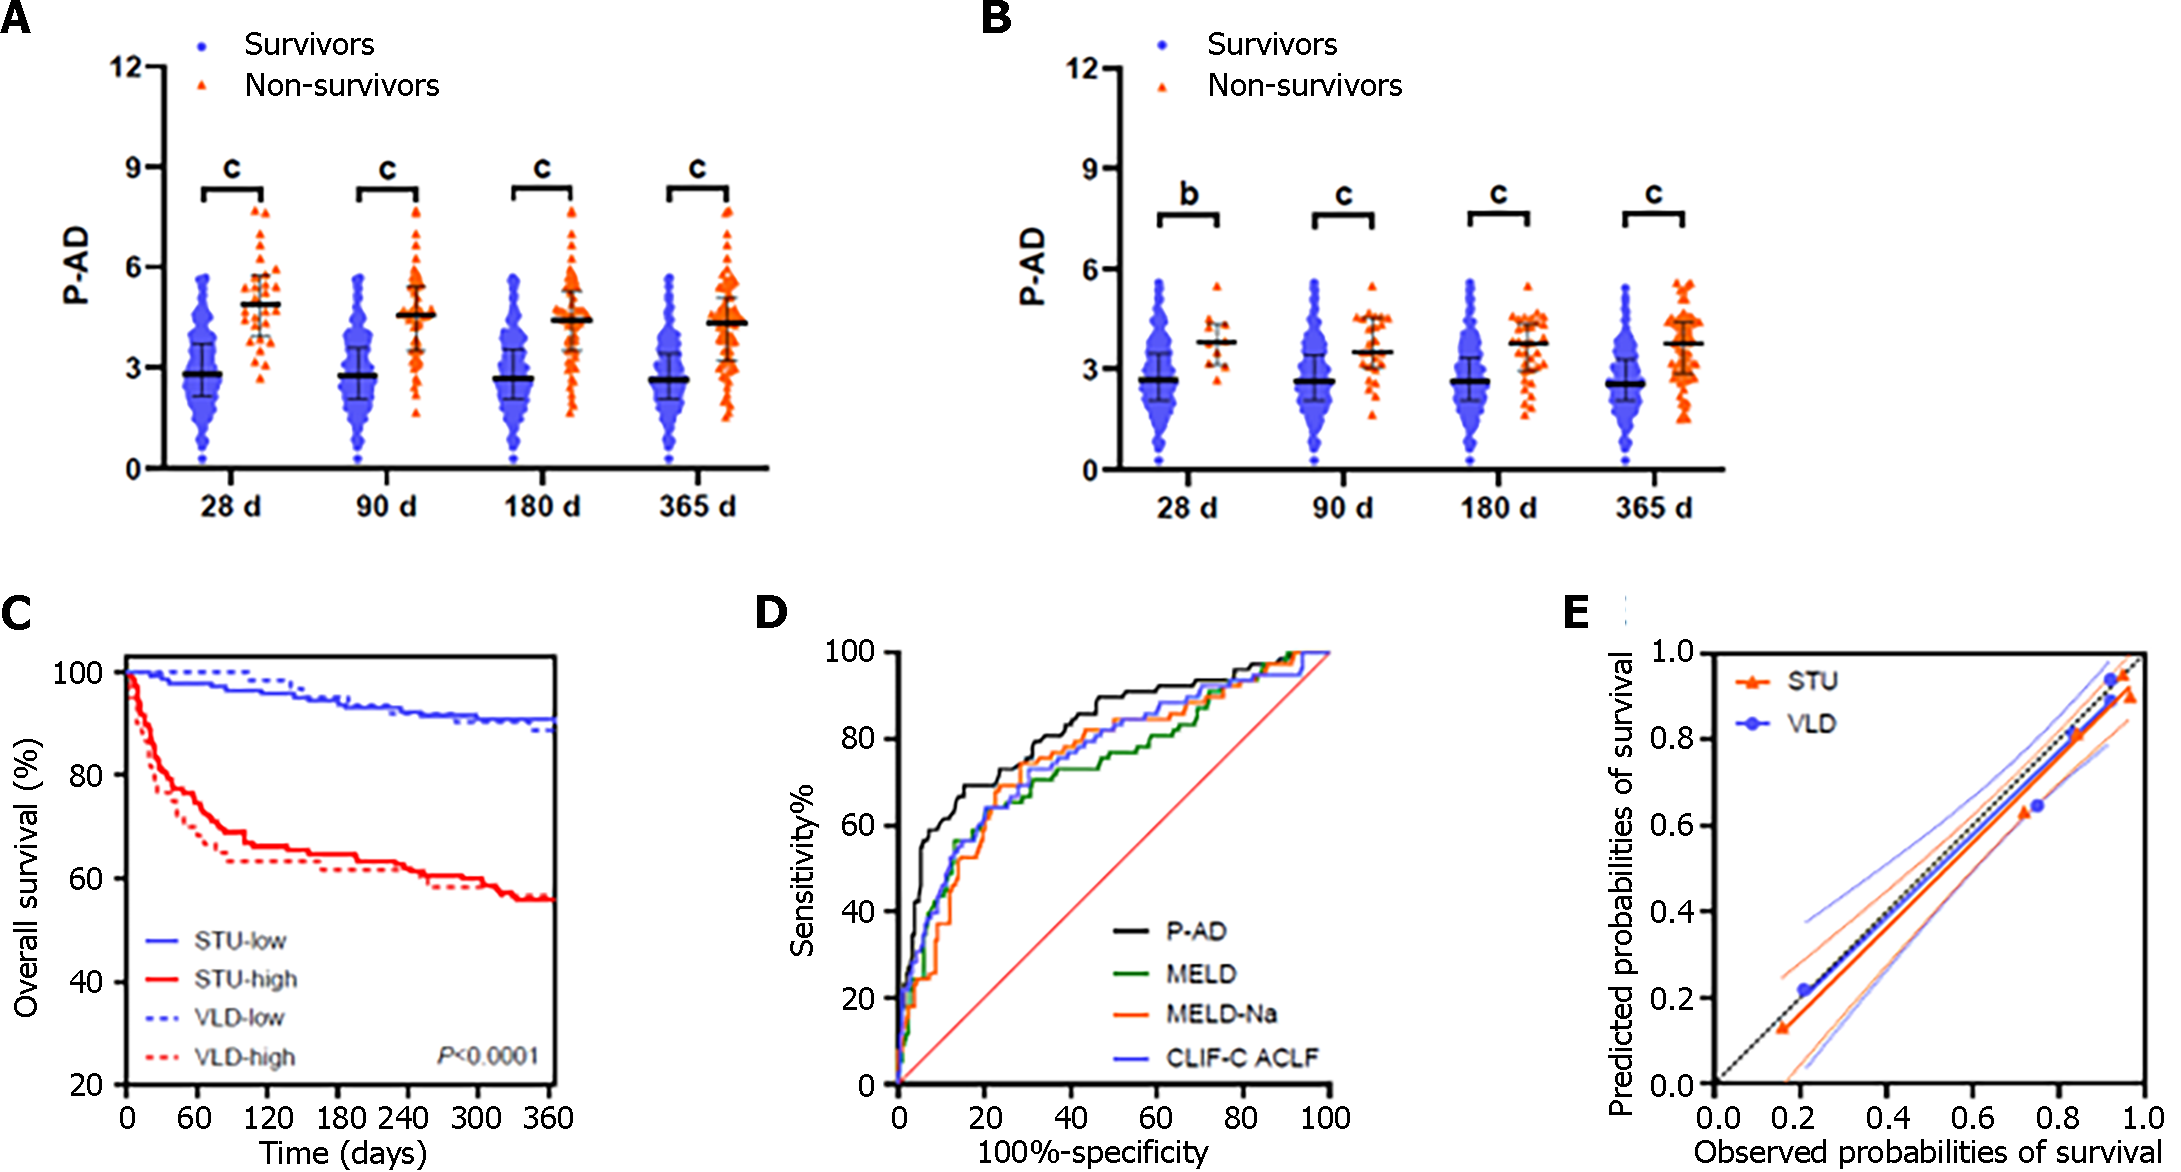
Figure 2 Prognostic model of acute decompensation score associated with prognosis of cirrhosis with acute decompensation.
A: Prognostic model of acute decompensation (P-AD) score distribution for acute decompensation (AD) patients with acute-on-chronic liver failure (ACLF) in the study cohort (median with interquartile range); B: P-AD score distribution for AD patients without ACLF in the study cohort (median with interquartile range); C: 1-year (365-d) survival rates of AD patients belonging “high” and “low” P-AD groups in both cohorts; D: Prediction of 1-year mortality for patients according to P-AD and other scores in study cohort; E: Calibration plot comparing the observed and predicted probabilities of survival from the Kaplan-Meier and P-AD model in AD patients. bP < 0.01, cP < 0.001. STU: Study; VLD: Validation; P-AD: Prognostic model of acute decompensation; MELD: Model for end-stage liver disease; CLIF-C ACLF: Chronic liver failure-consortium acute-on-chronic liver failure score.
Figure 3 Acute-on-chronic liver failure risk score associated with acute-on-chronic liver failure development in cirrhosis with acute decompensation.
A: In bacterial infections (BI) or non-BI group, Soluble triggering receptor expressed on myeloid cell-1 Levels at admission were higher in patients with acute-on-chronic liver failure (ACLF) than those without; B: Prediction development of ACLF during 28-d follow-up for patients with acute decompensation according to ACLF risk score (ACLF-R) and other models; C: Calibration plot comparing the observed and predicted probabilities of ACLF from the Kaplan-Meier and ACLF-R. cP < 0.001. sTREM-1: Soluble triggering receptor expressed on myeloid cell-1; ACLF: Acute-on-chronic liver failure score; BI: Bacterial infections; ACLF-R: Acute-on-chronic liver failure risk score; P-AD: Prognostic model of acute decompensation; MELD: Model for end-stage liver disease; CLIF-C: Chronic liver failure-consortium; CLIF-C AD: Chronic liver failure-consortium acute decompensation score; CLIF-C ACLF: Chronic liver failure-consortium acute-on-chronic liver failure score.
- Citation: Yu SM, Li H, Deng GH, Wang XB, Zheng X, Chen JJ, Meng ZJ, Zheng YB, Gao YH, Qian ZP, Liu F, Lu XB, Shi Y, Shang J, Chen RC, Huang Y. sTREM-1 as promising prognostic biomarker for acute-on-chronic liver failure and mortality in patients with acute decompensation of cirrhosis. World J Gastroenterol 2024; 30(9): 1177-1188
- URL: https://www.wjgnet.com/1007-9327/full/v30/i9/1177.htm
- DOI: https://dx.doi.org/10.3748/wjg.v30.i9.1177


