Copyright
©The Author(s) 2024.
World J Gastroenterol. Dec 28, 2024; 30(48): 5111-5129
Published online Dec 28, 2024. doi: 10.3748/wjg.v30.i48.5111
Published online Dec 28, 2024. doi: 10.3748/wjg.v30.i48.5111
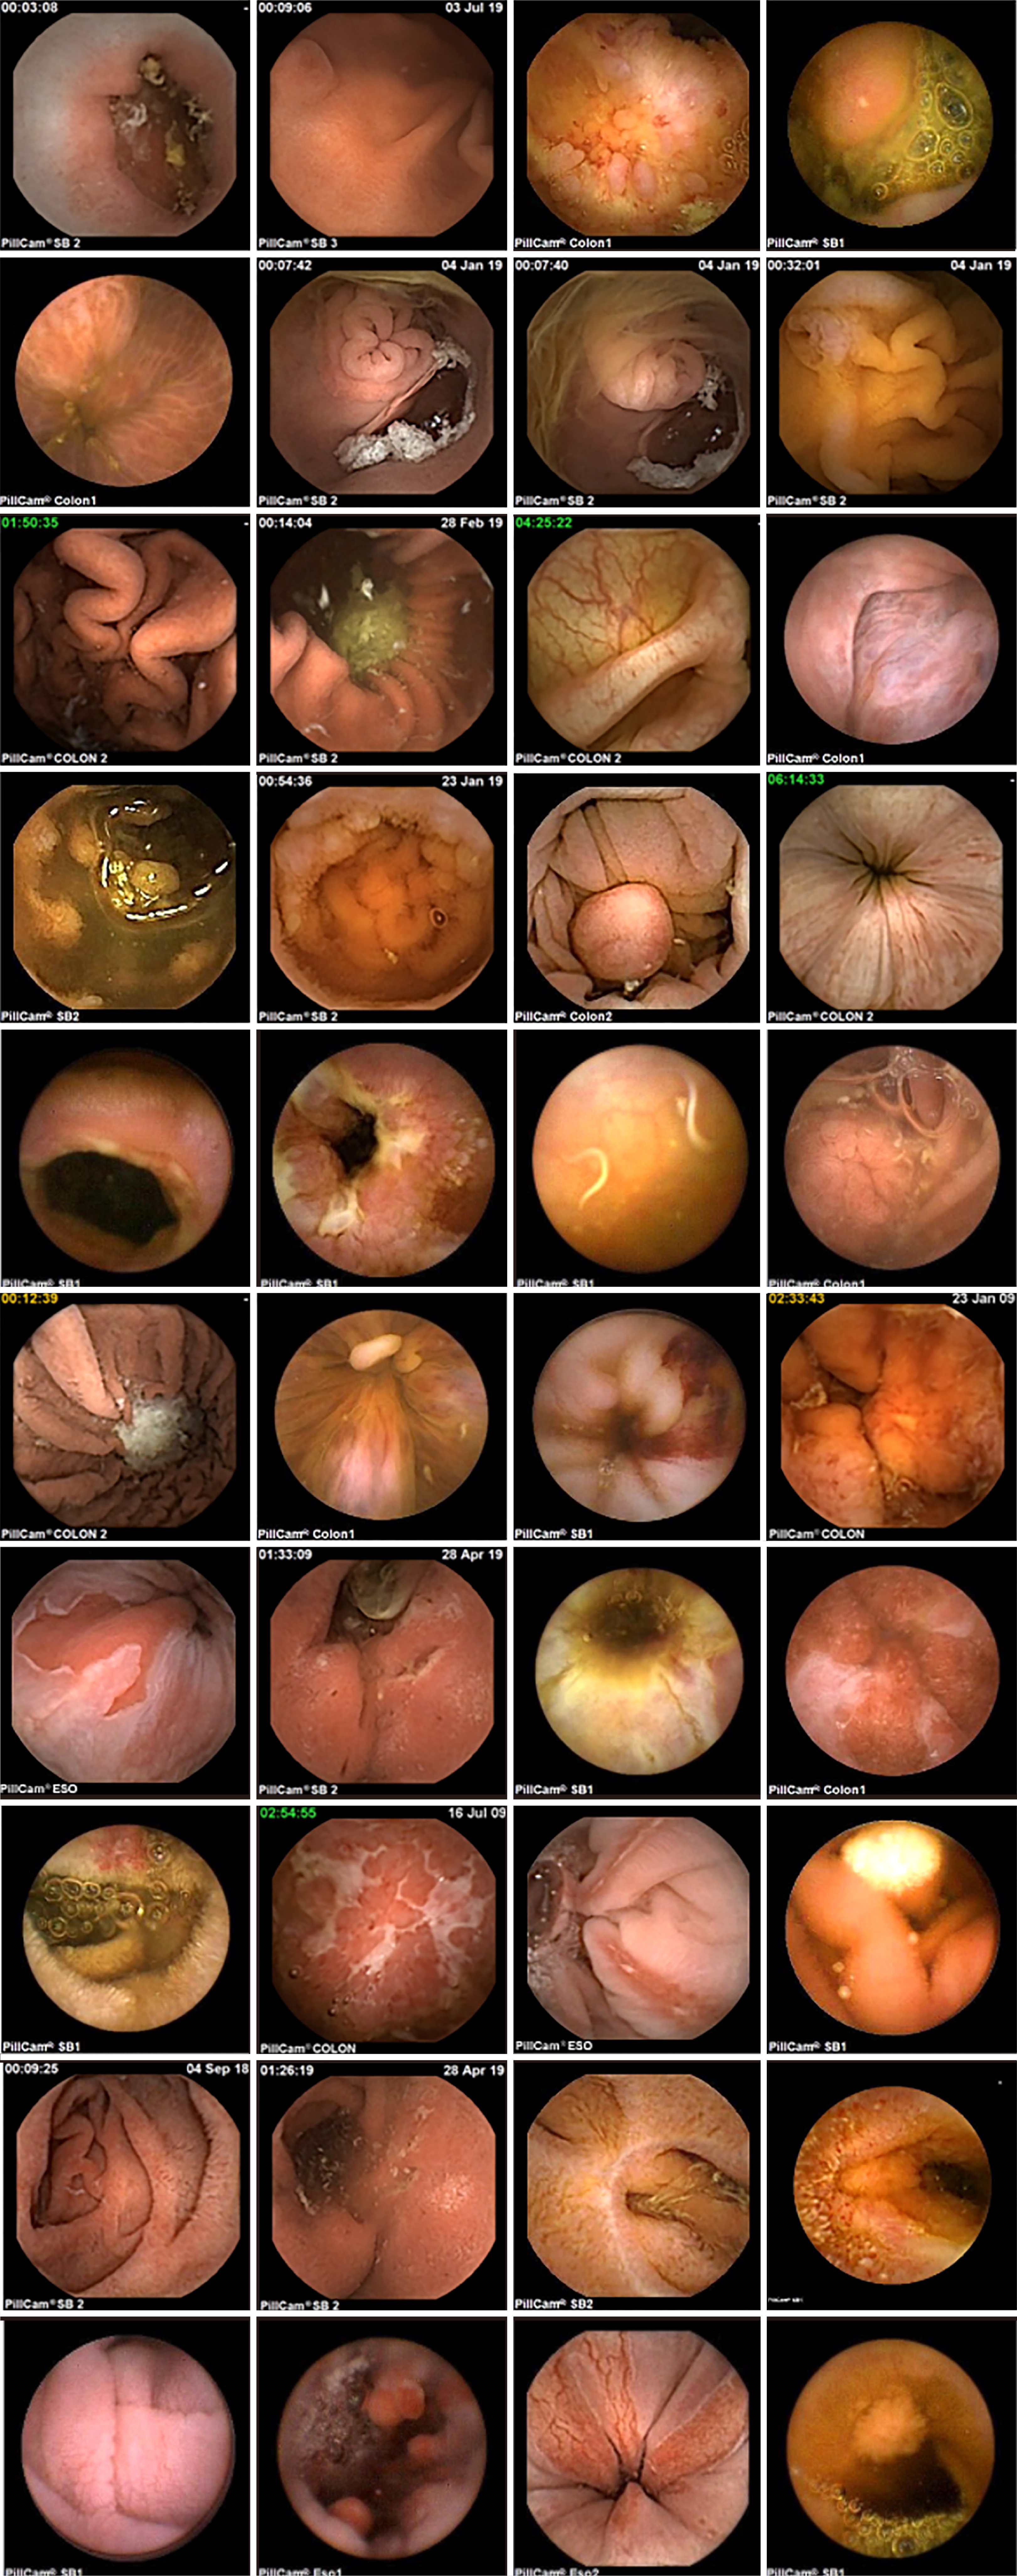
Figure 1 Dataset example.
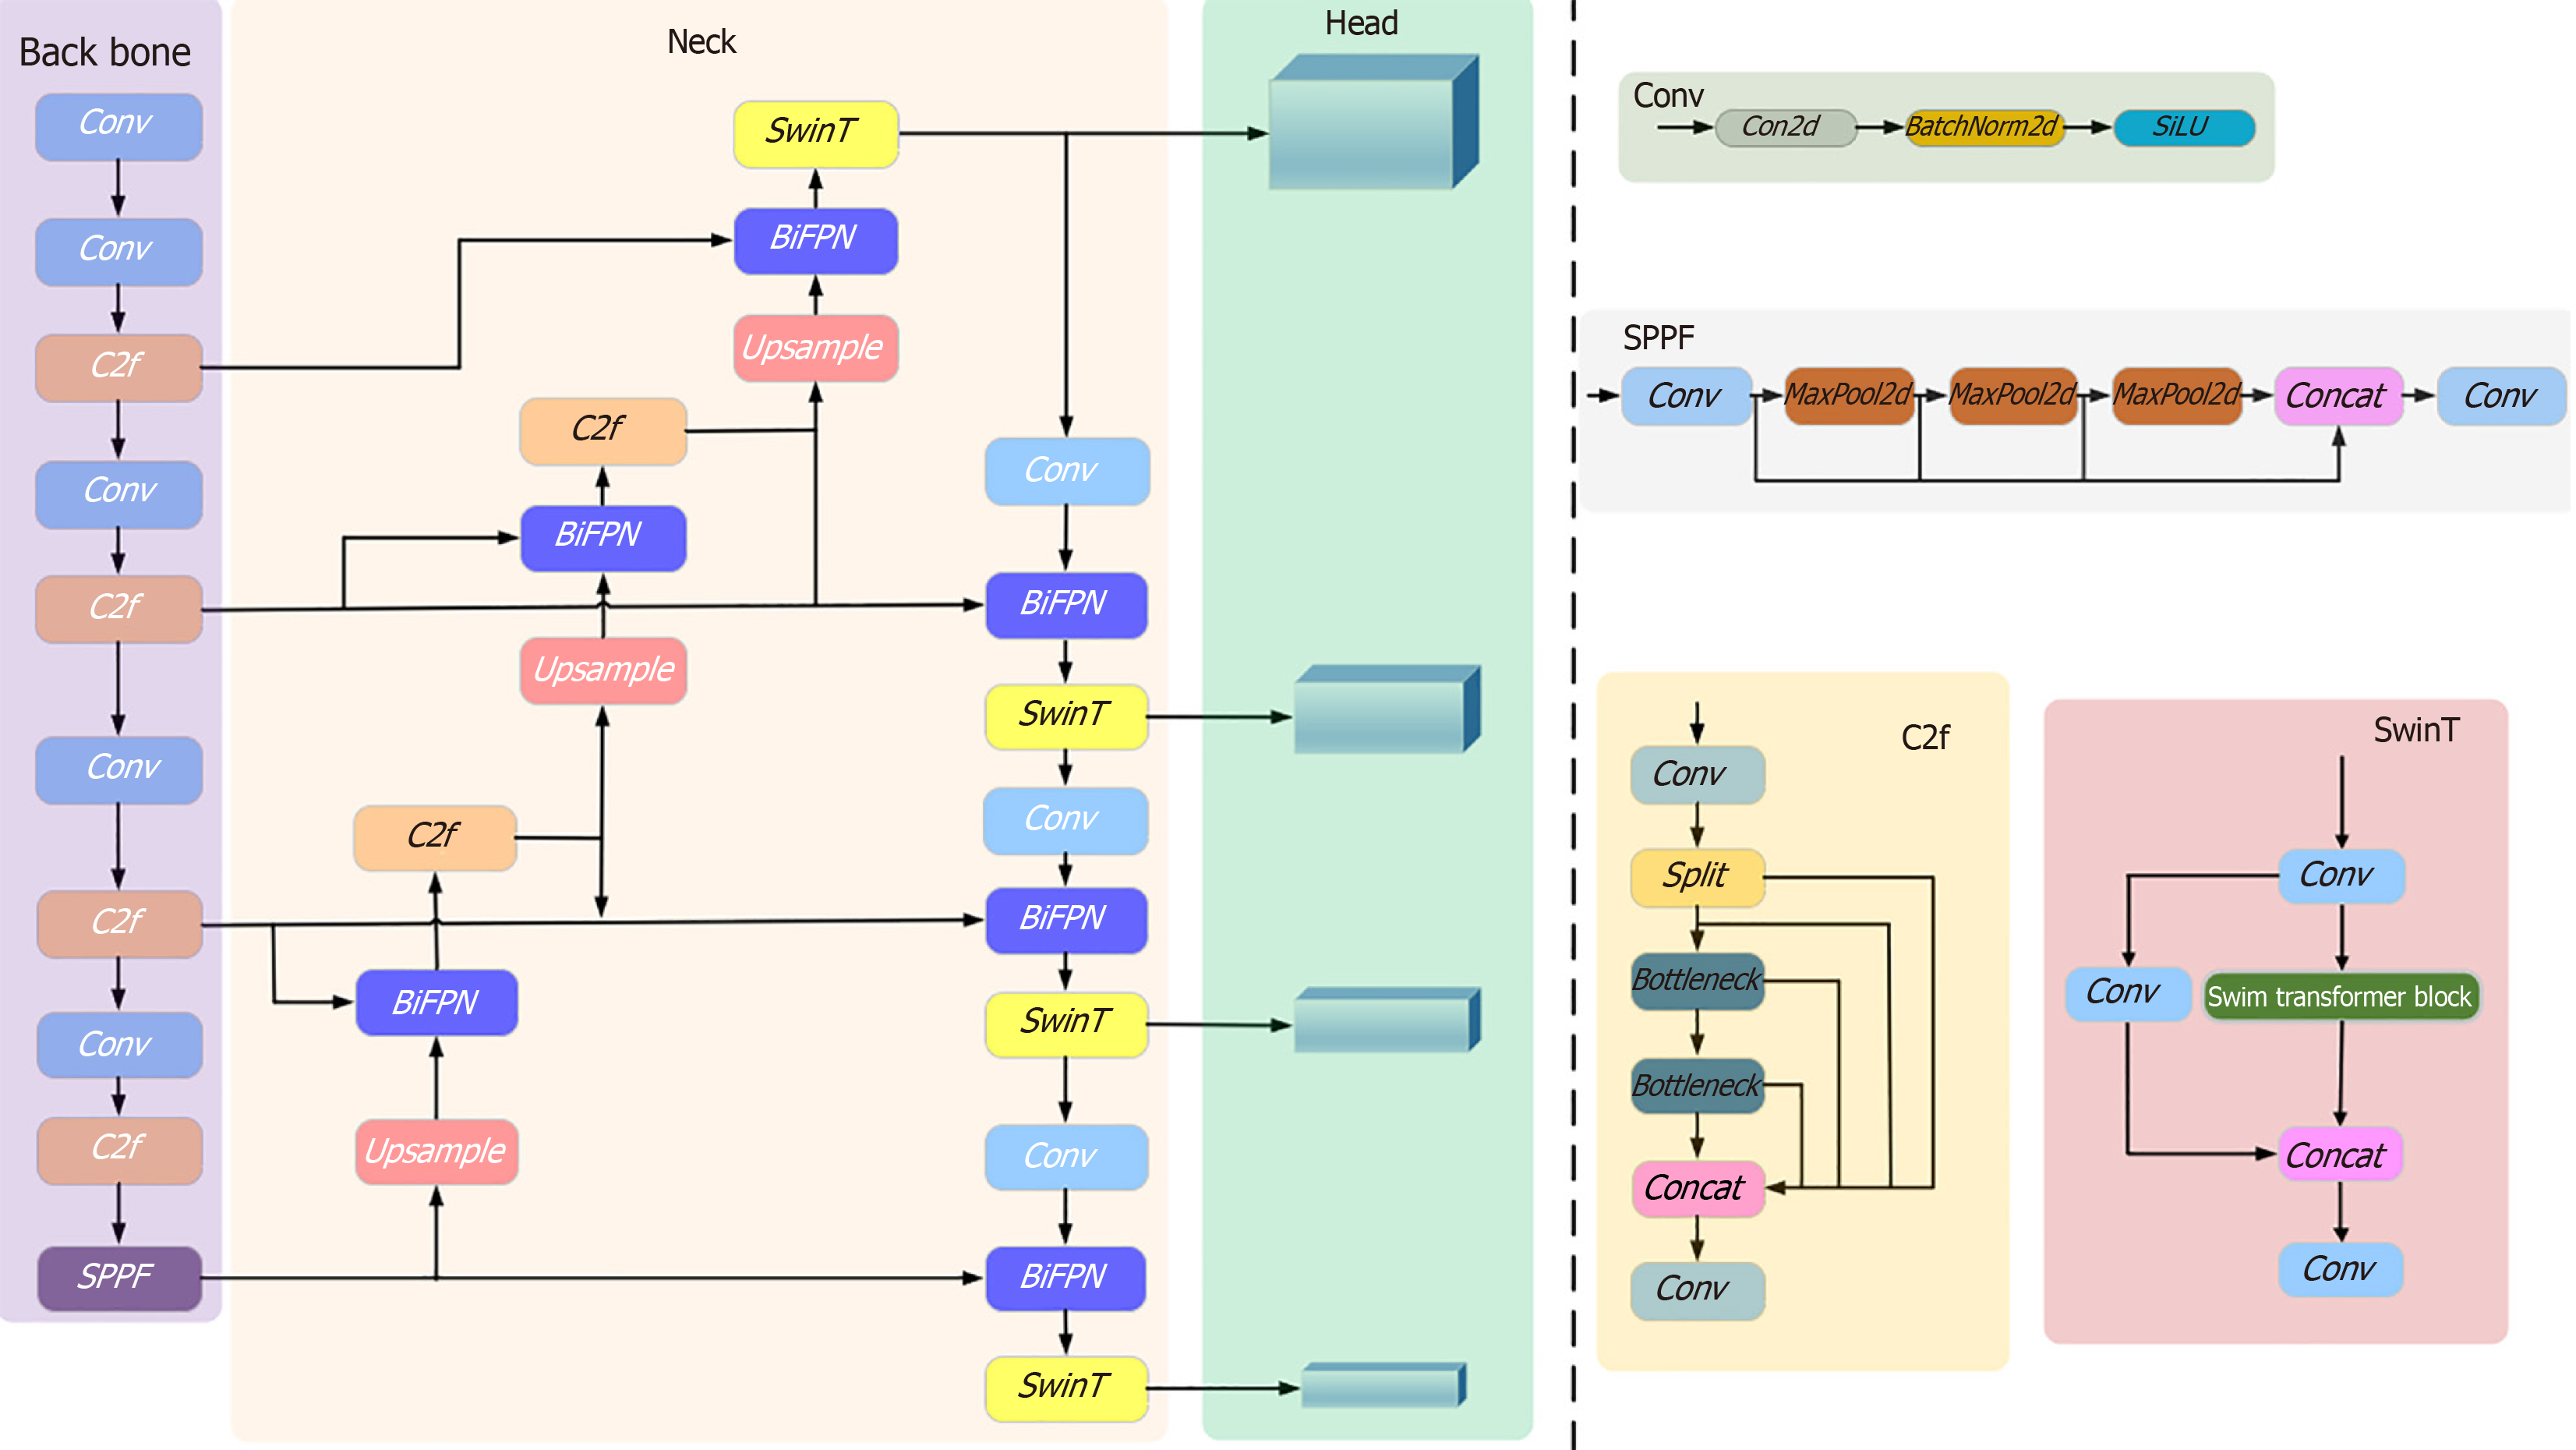
Figure 2 Wireless capsule endoscopy_Detection model structure.
Conv: Convolution; SPPF: Spatial pyramid pooling fast; SwinT: Swin transformer; SiLU: Sigmoid linear unit.
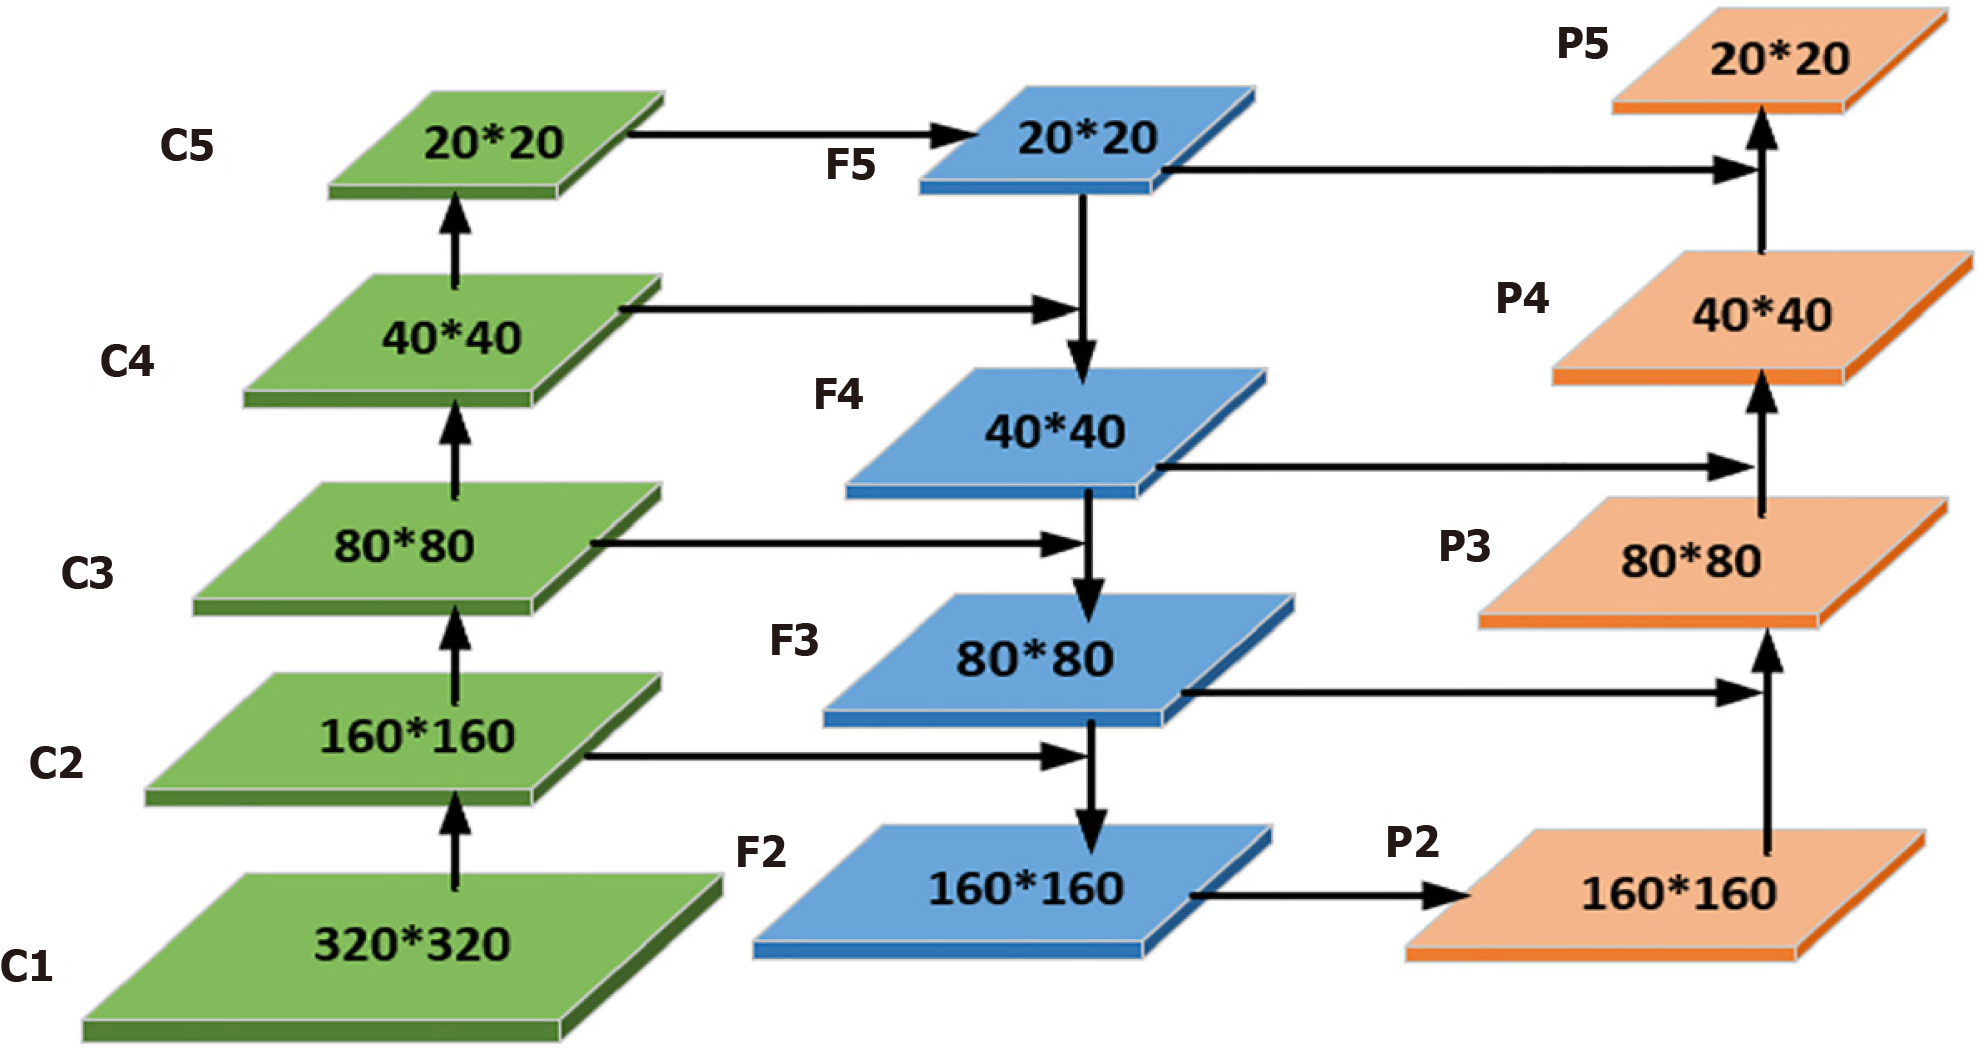
Figure 3 Wireless capsule endoscopy_Detection network structure diagram.
C1, C2, C3, C4, C5: Layers 1, 2, 3, 4, and 5 of the backbone network; F2, F3, F4, F5: Layers 2, 3, 4, and 5 of the neck network; P2, P3, P4, P5: 2nd, 3rd, 4th, 5th detection head.
Figure 4 Context information of the reflux esophagitis lesion.
A: Captured at 00:00:18, representing the earliest result; B: Captured at 00:00:19, representing an earlier frame at this time point; C: Captured at 00:00:19, representing a continued frame subsequent frame, showing further details of the lesion; D: Captured at 00:00:19, representing a later frame at this time point, where the lesion area might reveal new angles or further details due to the capsule’s movement.
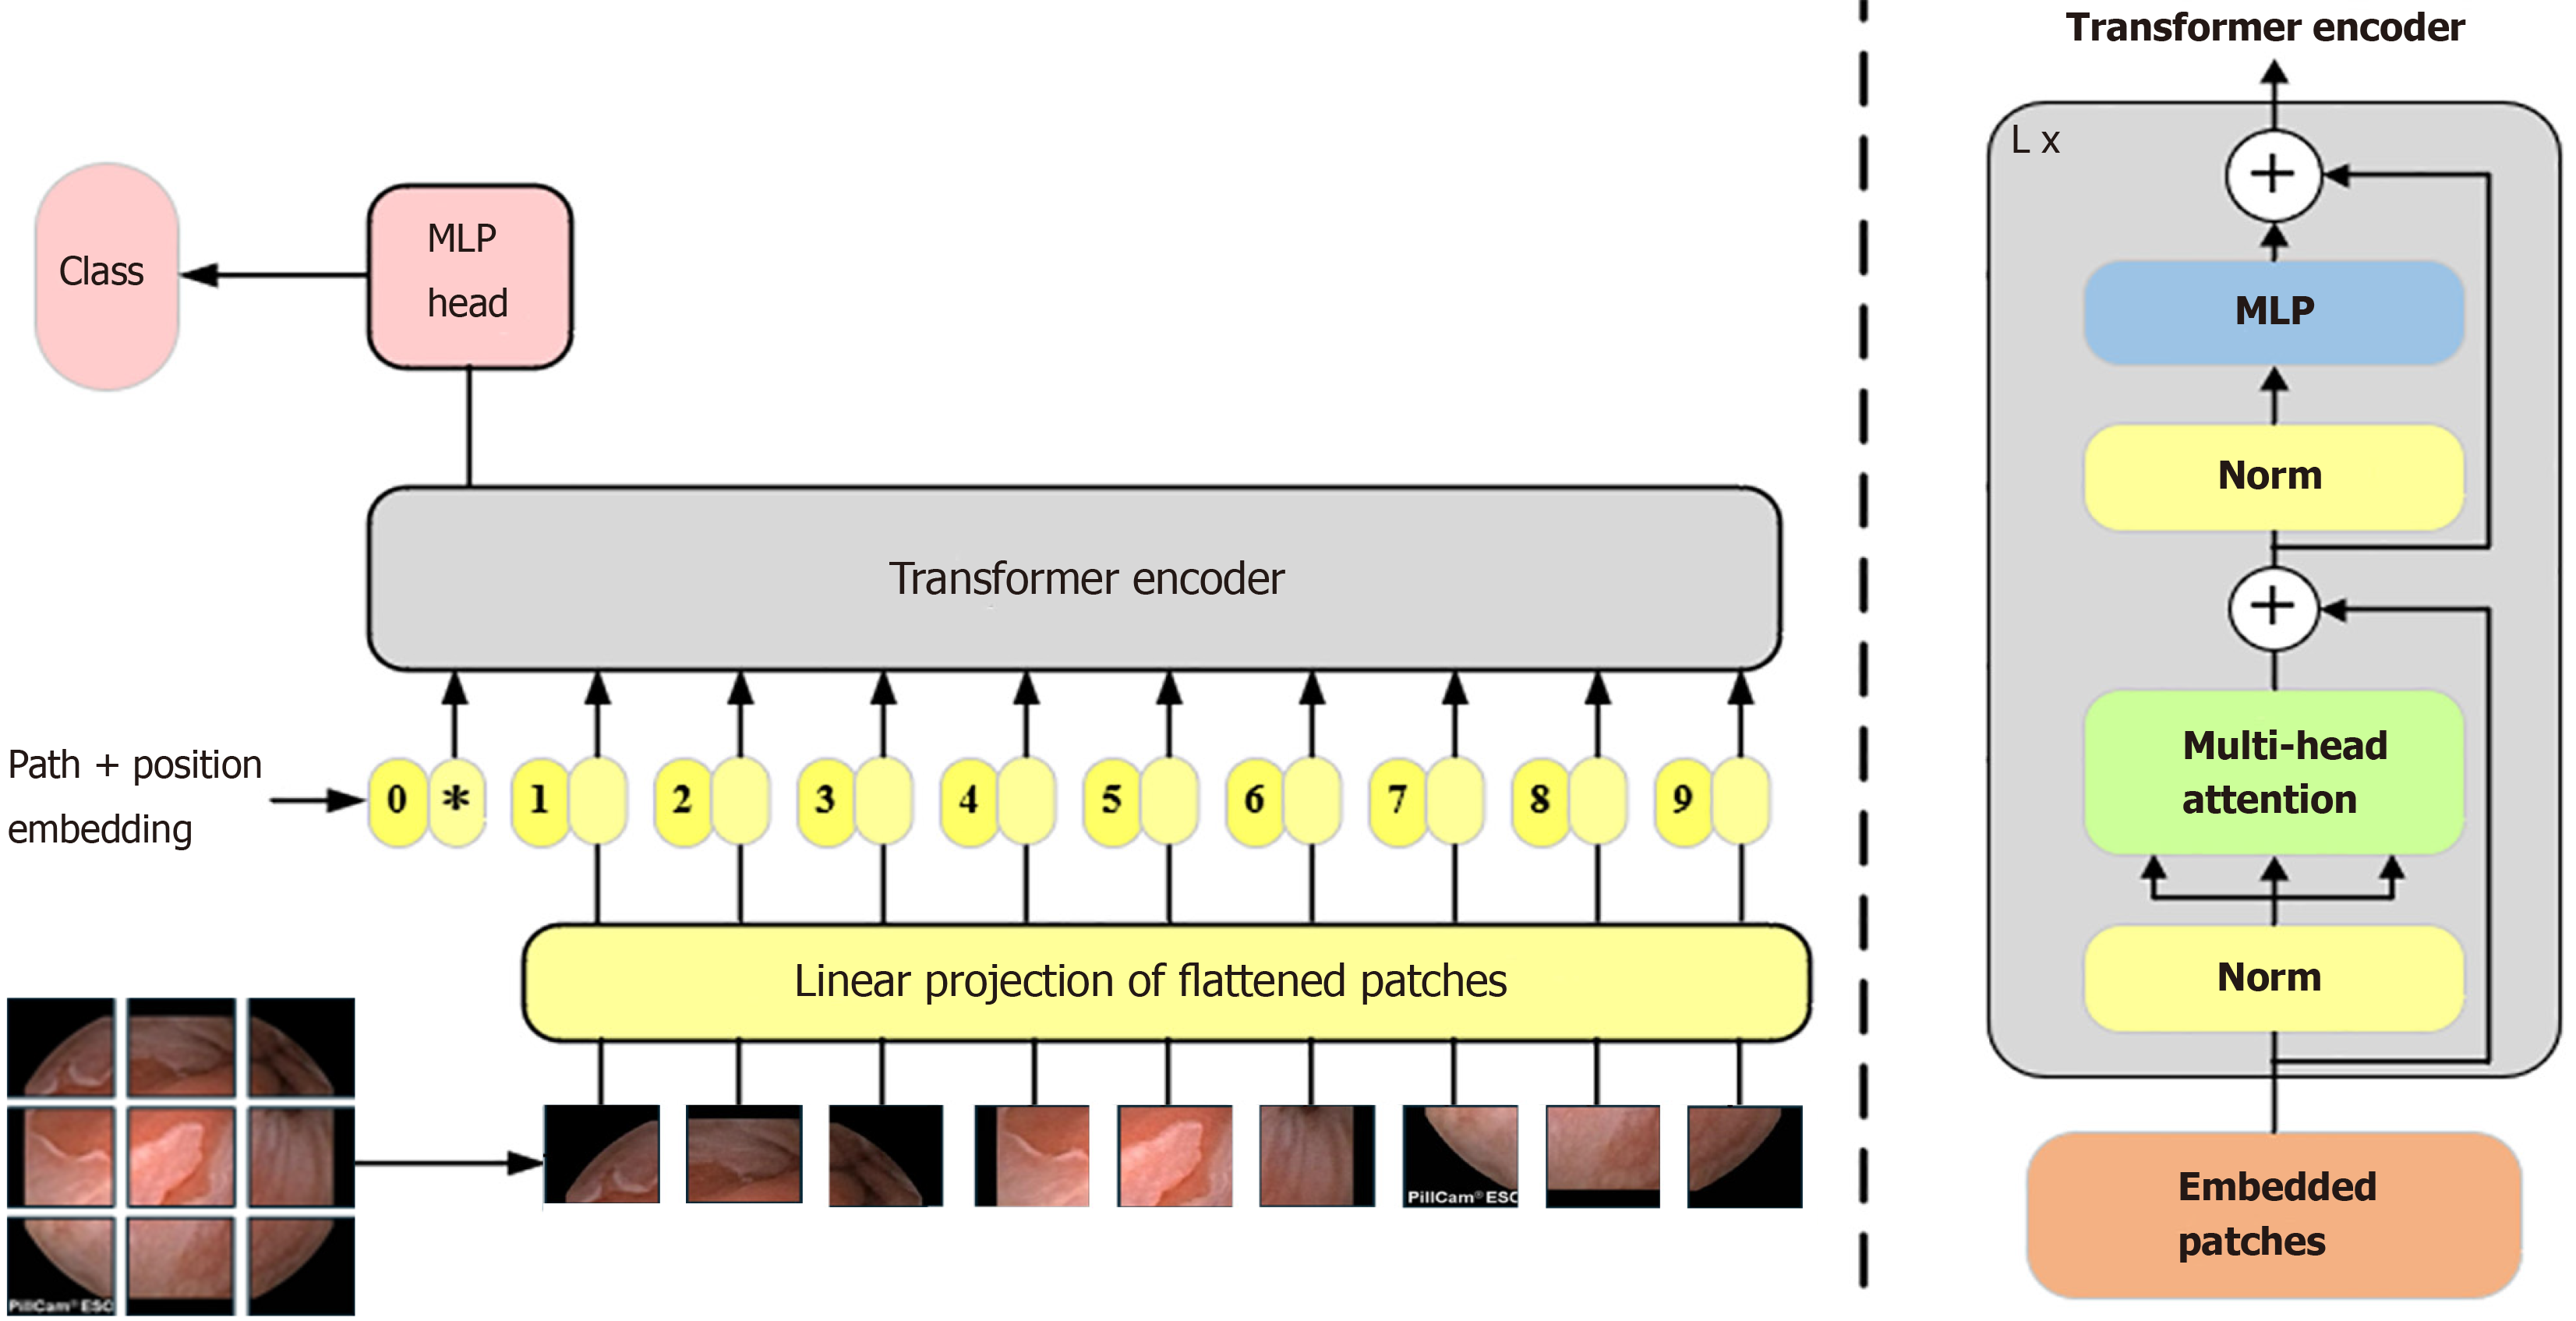
Figure 5 Vision transformer.
MLP: Multilayer perceptron; L: Layer.
Figure 6 Swin transformer model structure.
H: Height; W: Width; C: Channels.
Figure 7 Two consecutive Swin transformer blocks.
LN: Layer normalization; W-MSA: Window multihead self-attention; MLP: Multilayer perceptron; SW-MSA: Shifted window multihead self-attention.
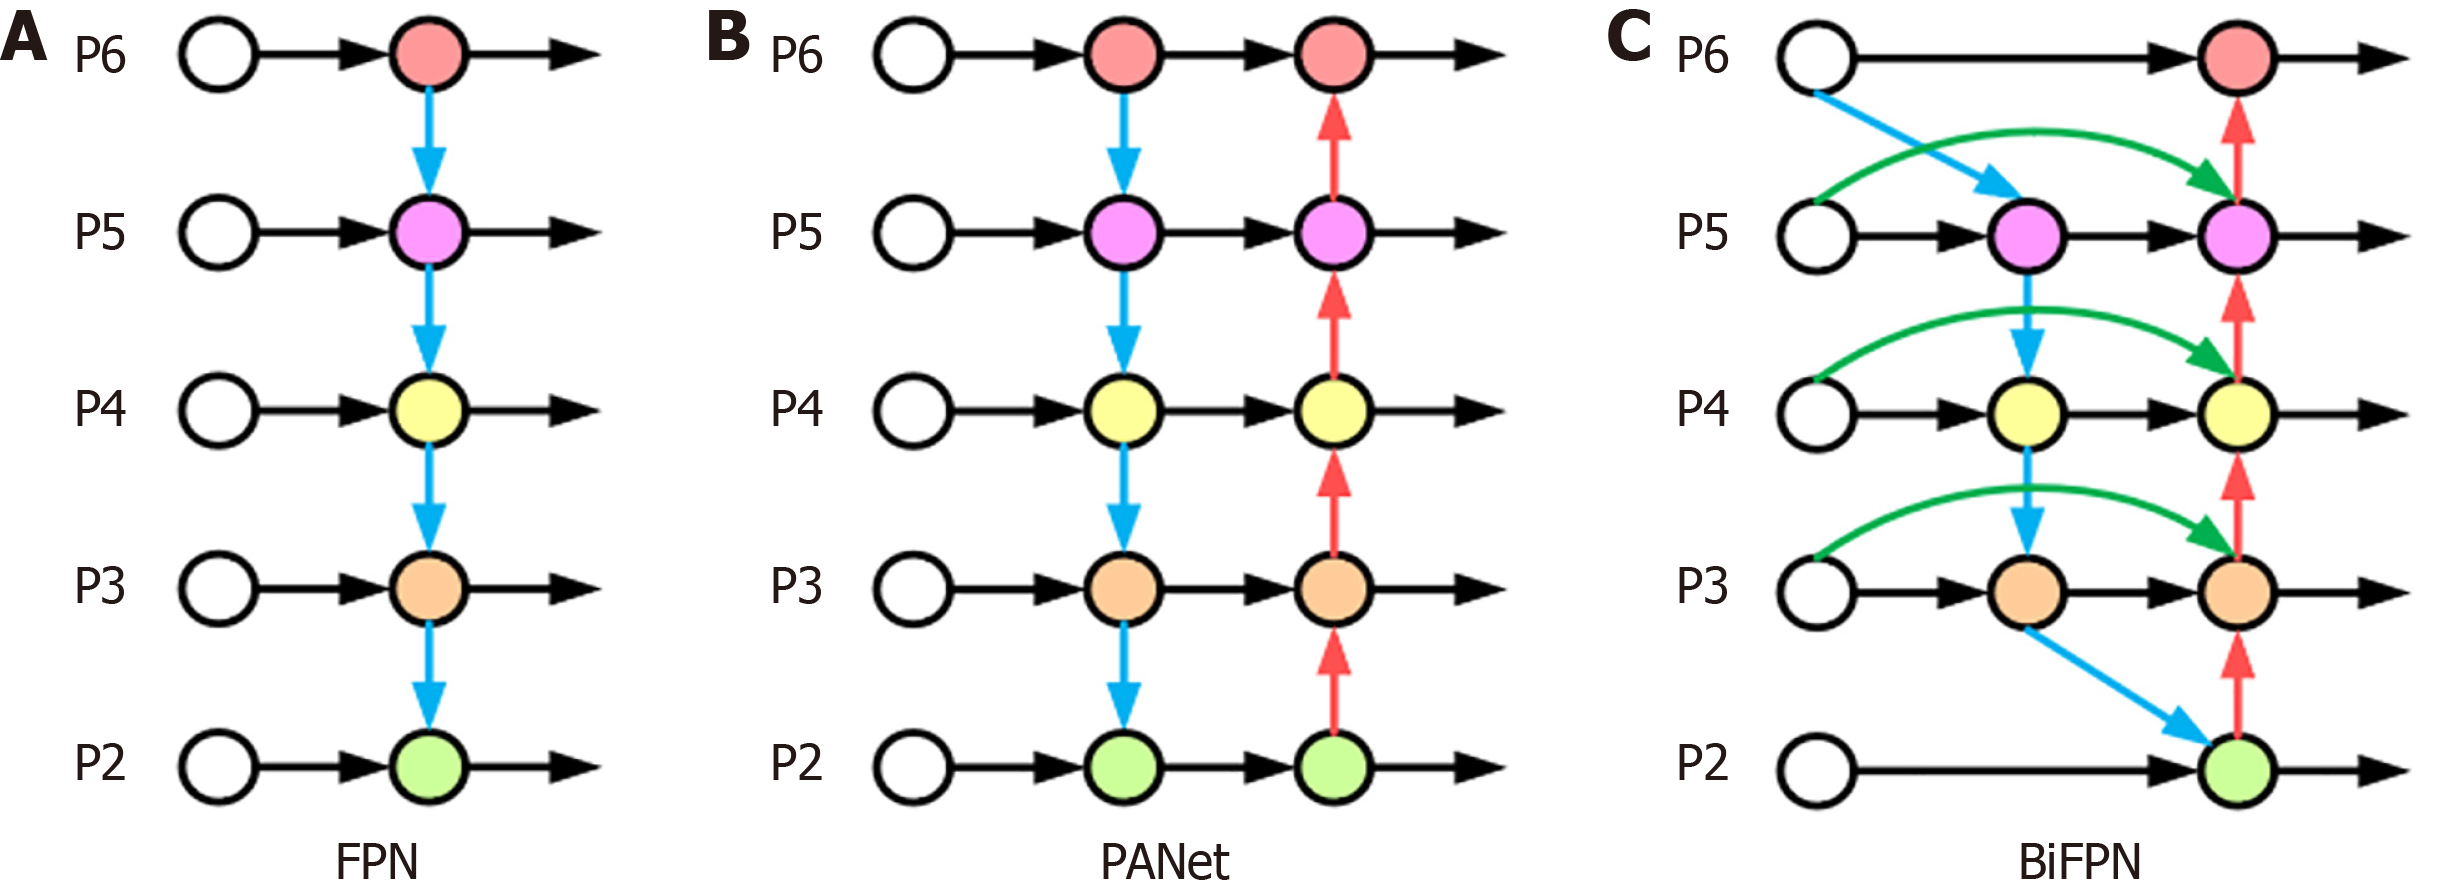
Figure 8 Different feature fusion structures.
A: Feature pyramid network (FPN); B: Path aggregation network; C: Bidirectional FPN. P2: Represents layer 2 feature maps; P3: Represents layer 3 feature maps; P4: Represents layer 4 feature maps; P5: Represents layer 5 feature maps; P6: Represents layer 6 feature maps. FPN: Feature pyramid network; PANet: Path aggregation network; BiFPN: Bidirectional feature pyramid network.
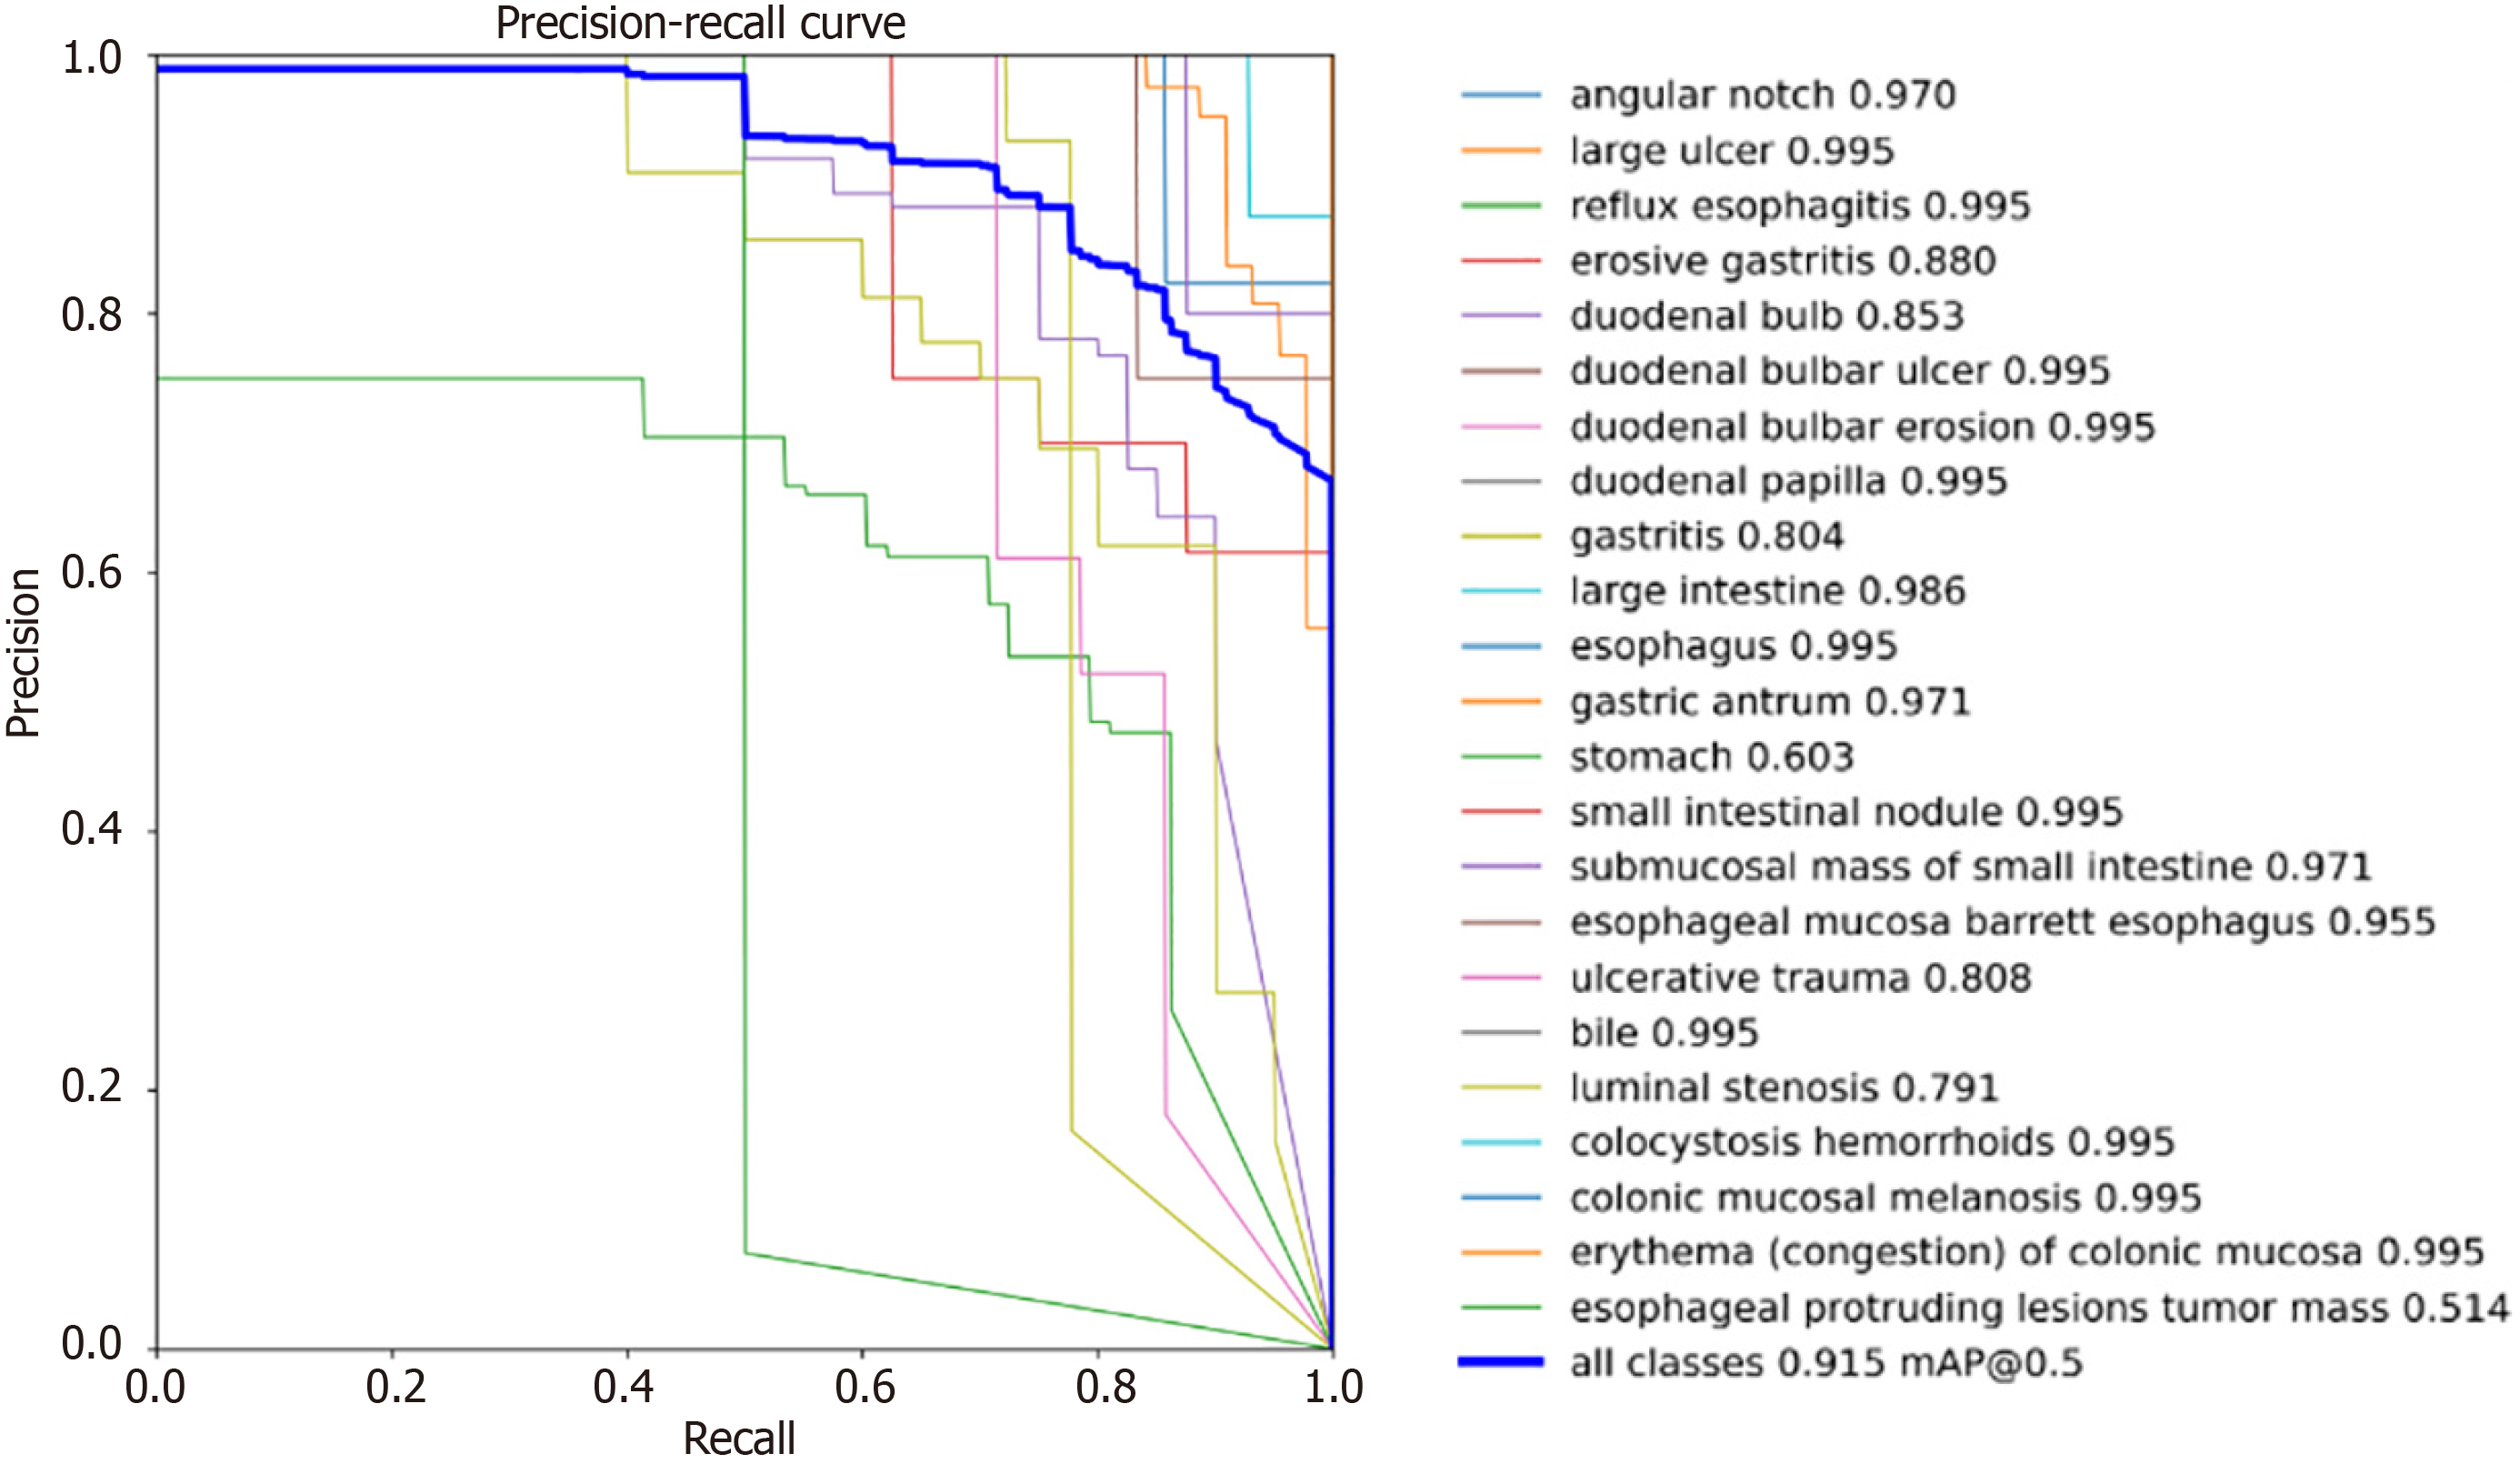
Figure 9 Precision-recall curves of the wireless capsule endoscopy_detection model for the dataset.
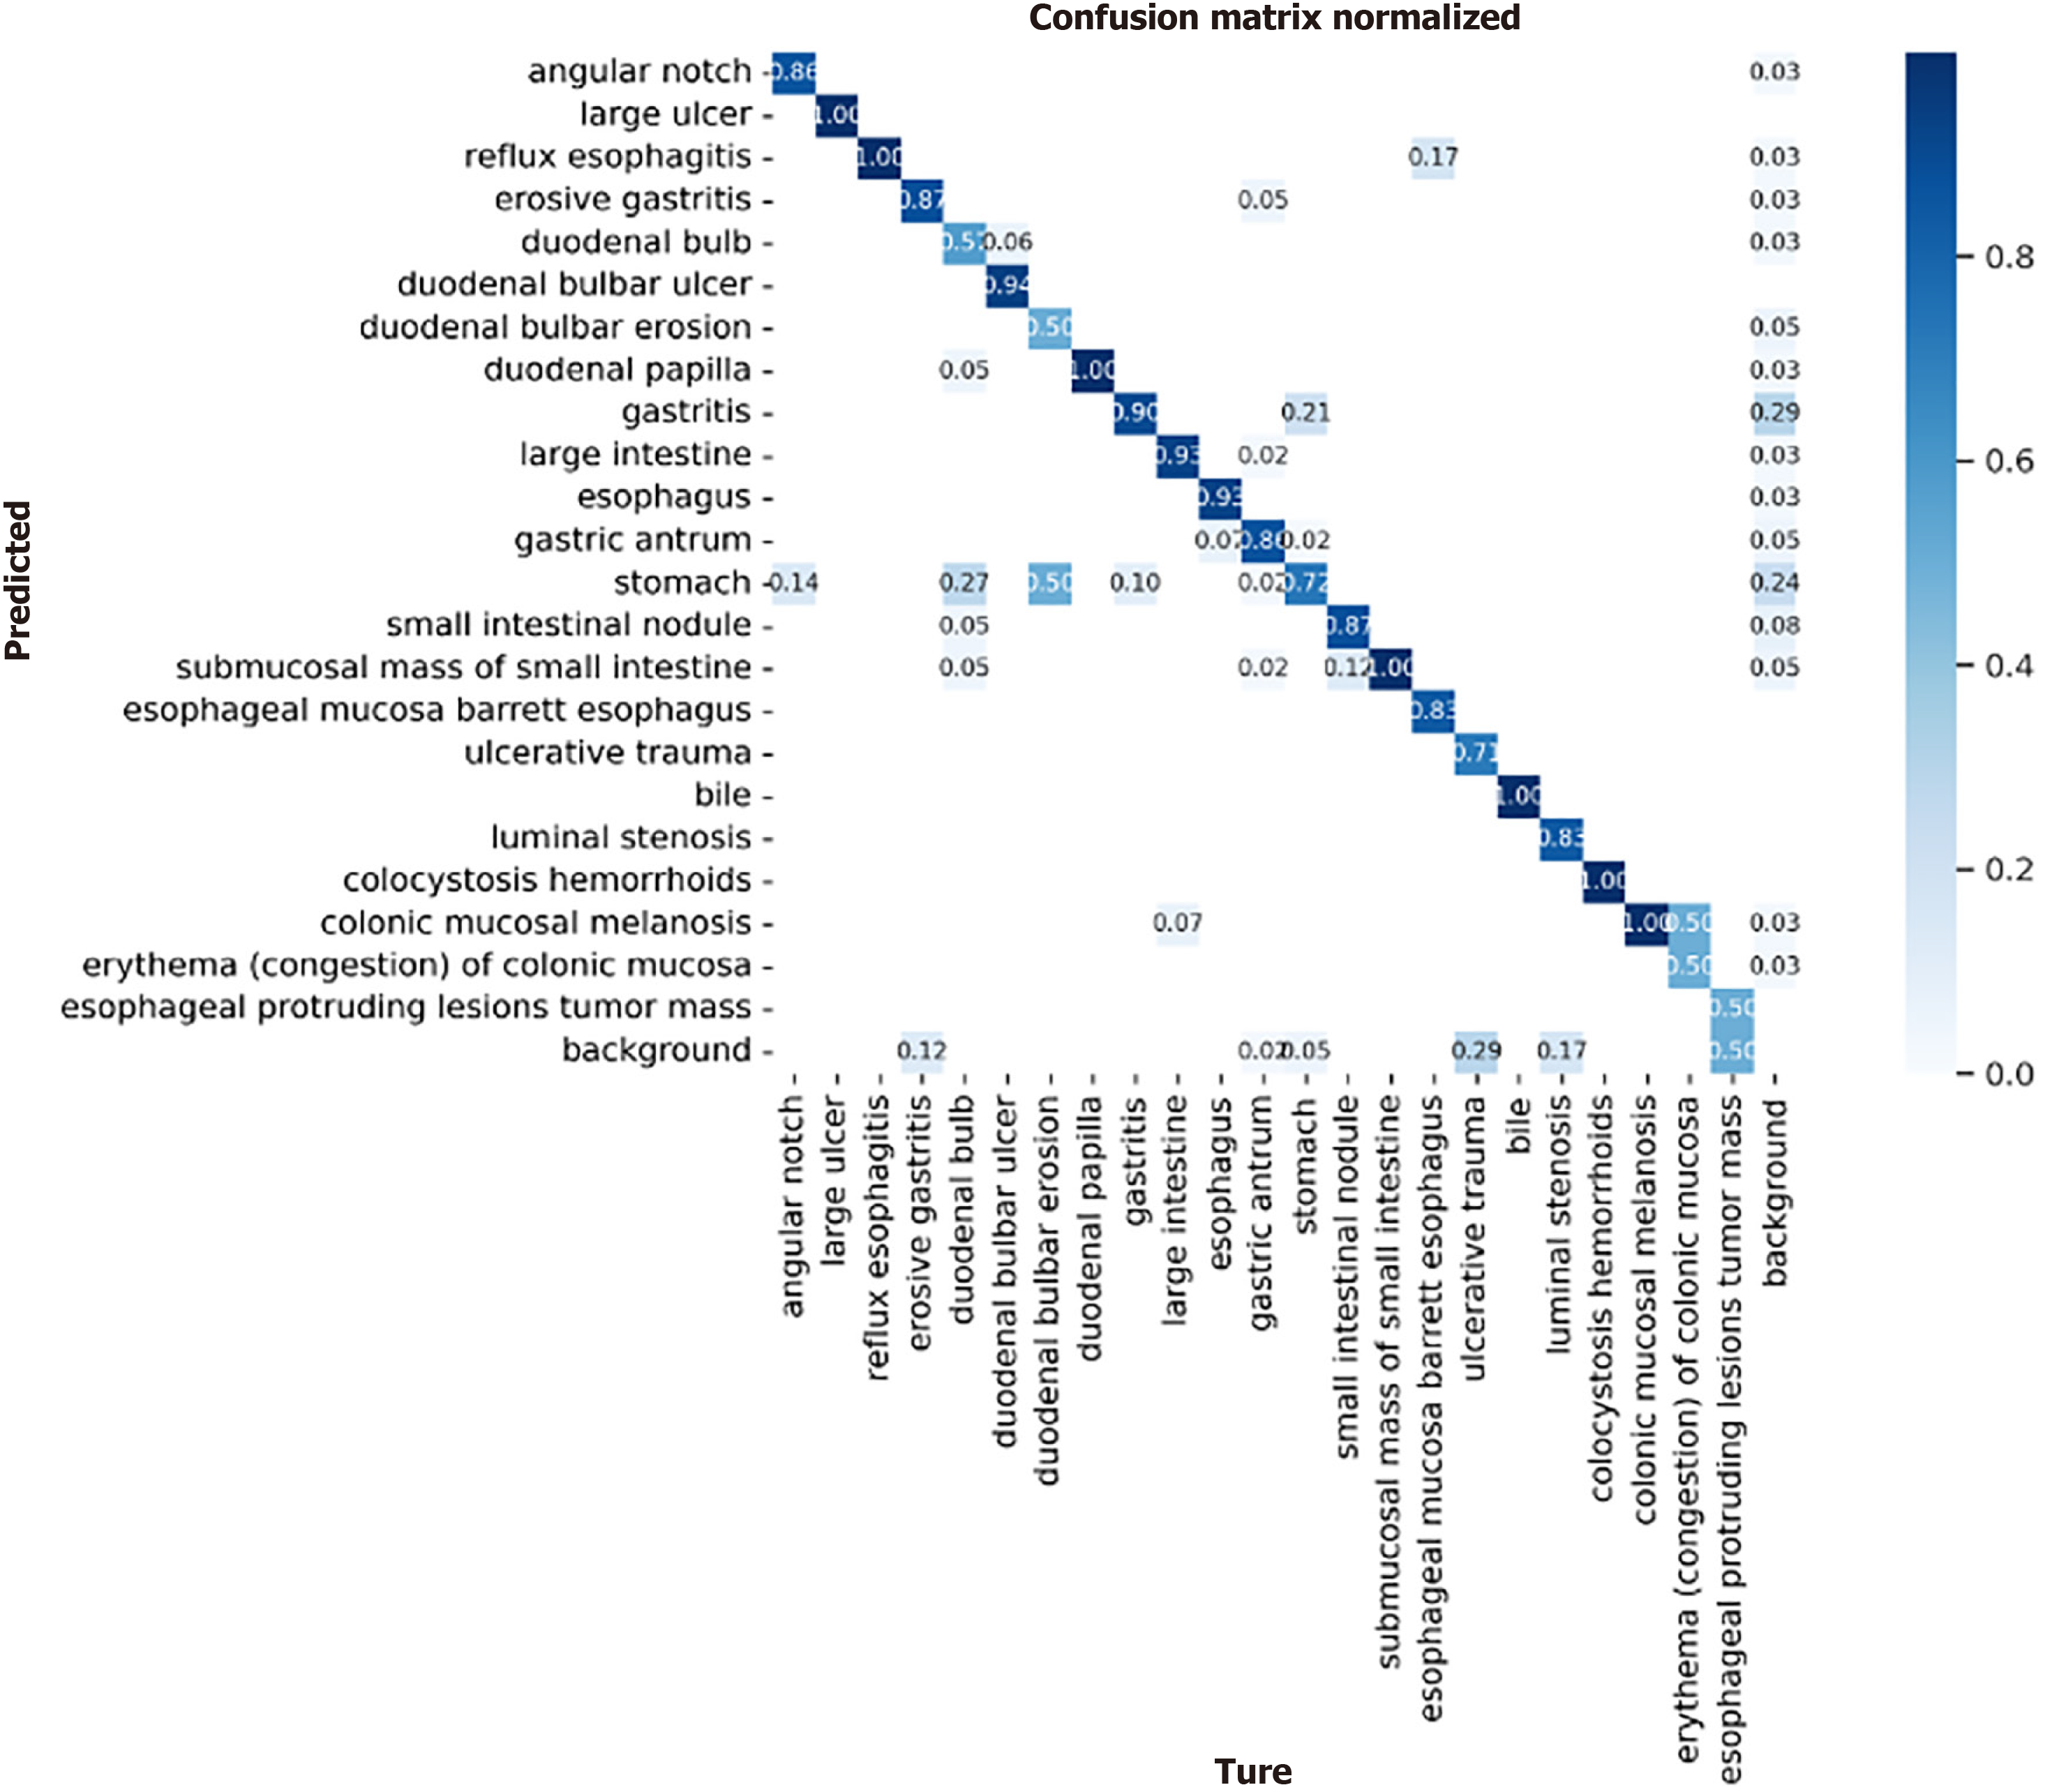
Figure 10 Confusion matrix of the wireless capsule endoscopy_detection model.
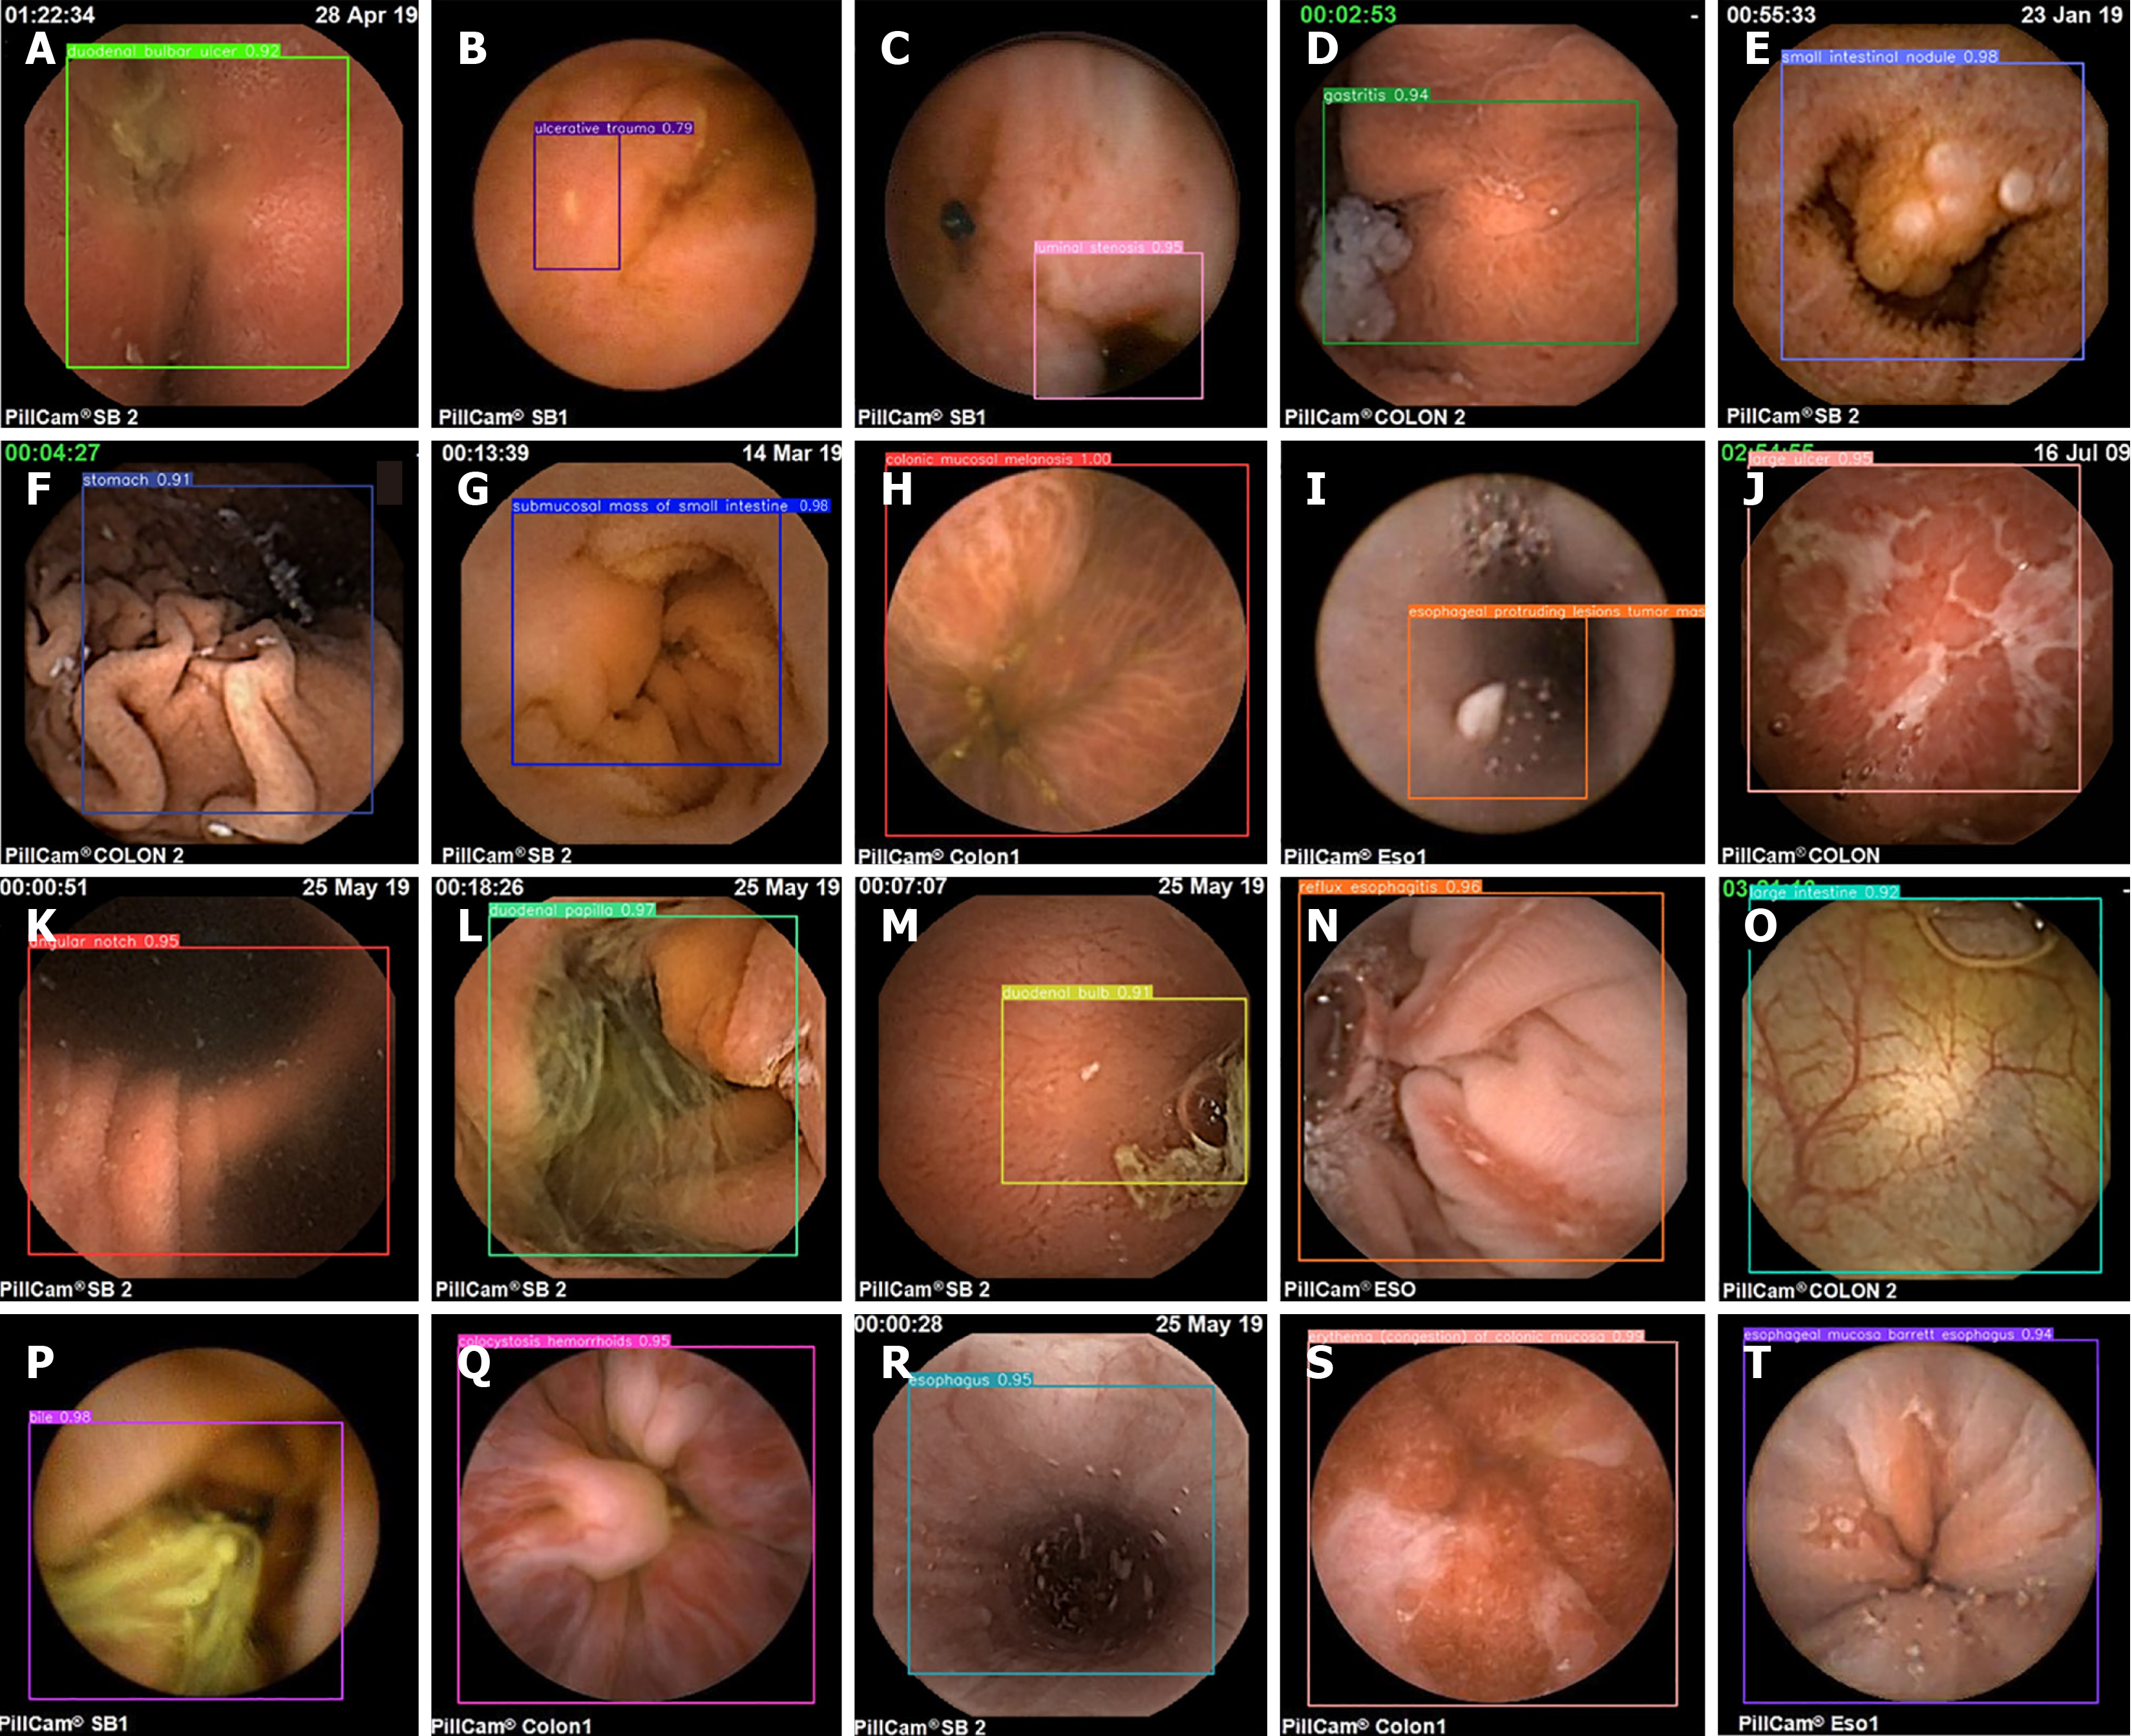
Figure 11 Wireless capsule endoscopy_detection model detection visualization results.
Different letters in the image represent different types of lesions. A: Duodenal bulbar ulcer; B: Ulcerative trauma; C: Luminal stenosis; D: Gastritis; E: Small intestinal nodule; F: Stomach; G: Submucosal mass of the small intestine; H: Colonic mucosal melanosis; I: Esophageal protruding lesion tumor mass; J: Large ulcer; K: Angular notch; L: Duodenal papilla; M: Duodenal bulb; N: Reflux esophagitis; O: Large intestine; P: Bile; Q: Colocystosis hemorrhoids; R: Esophagus; S: Gastric antrum; T: Duodenal bulbar erosion.
Figure 12 Example of a wrongly detected lesion.
A and B: Examples of misdetected lesions; C and D: Lesions with low detection accuracy.
- Citation: Xiao ZG, Chen XQ, Zhang D, Li XY, Dai WX, Liang WH. Image detection method for multi-category lesions in wireless capsule endoscopy based on deep learning models. World J Gastroenterol 2024; 30(48): 5111-5129
- URL: https://www.wjgnet.com/1007-9327/full/v30/i48/5111.htm
- DOI: https://dx.doi.org/10.3748/wjg.v30.i48.5111


