Copyright
©The Author(s) 2024.
World J Gastroenterol. Nov 28, 2024; 30(44): 4709-4724
Published online Nov 28, 2024. doi: 10.3748/wjg.v30.i44.4709
Published online Nov 28, 2024. doi: 10.3748/wjg.v30.i44.4709
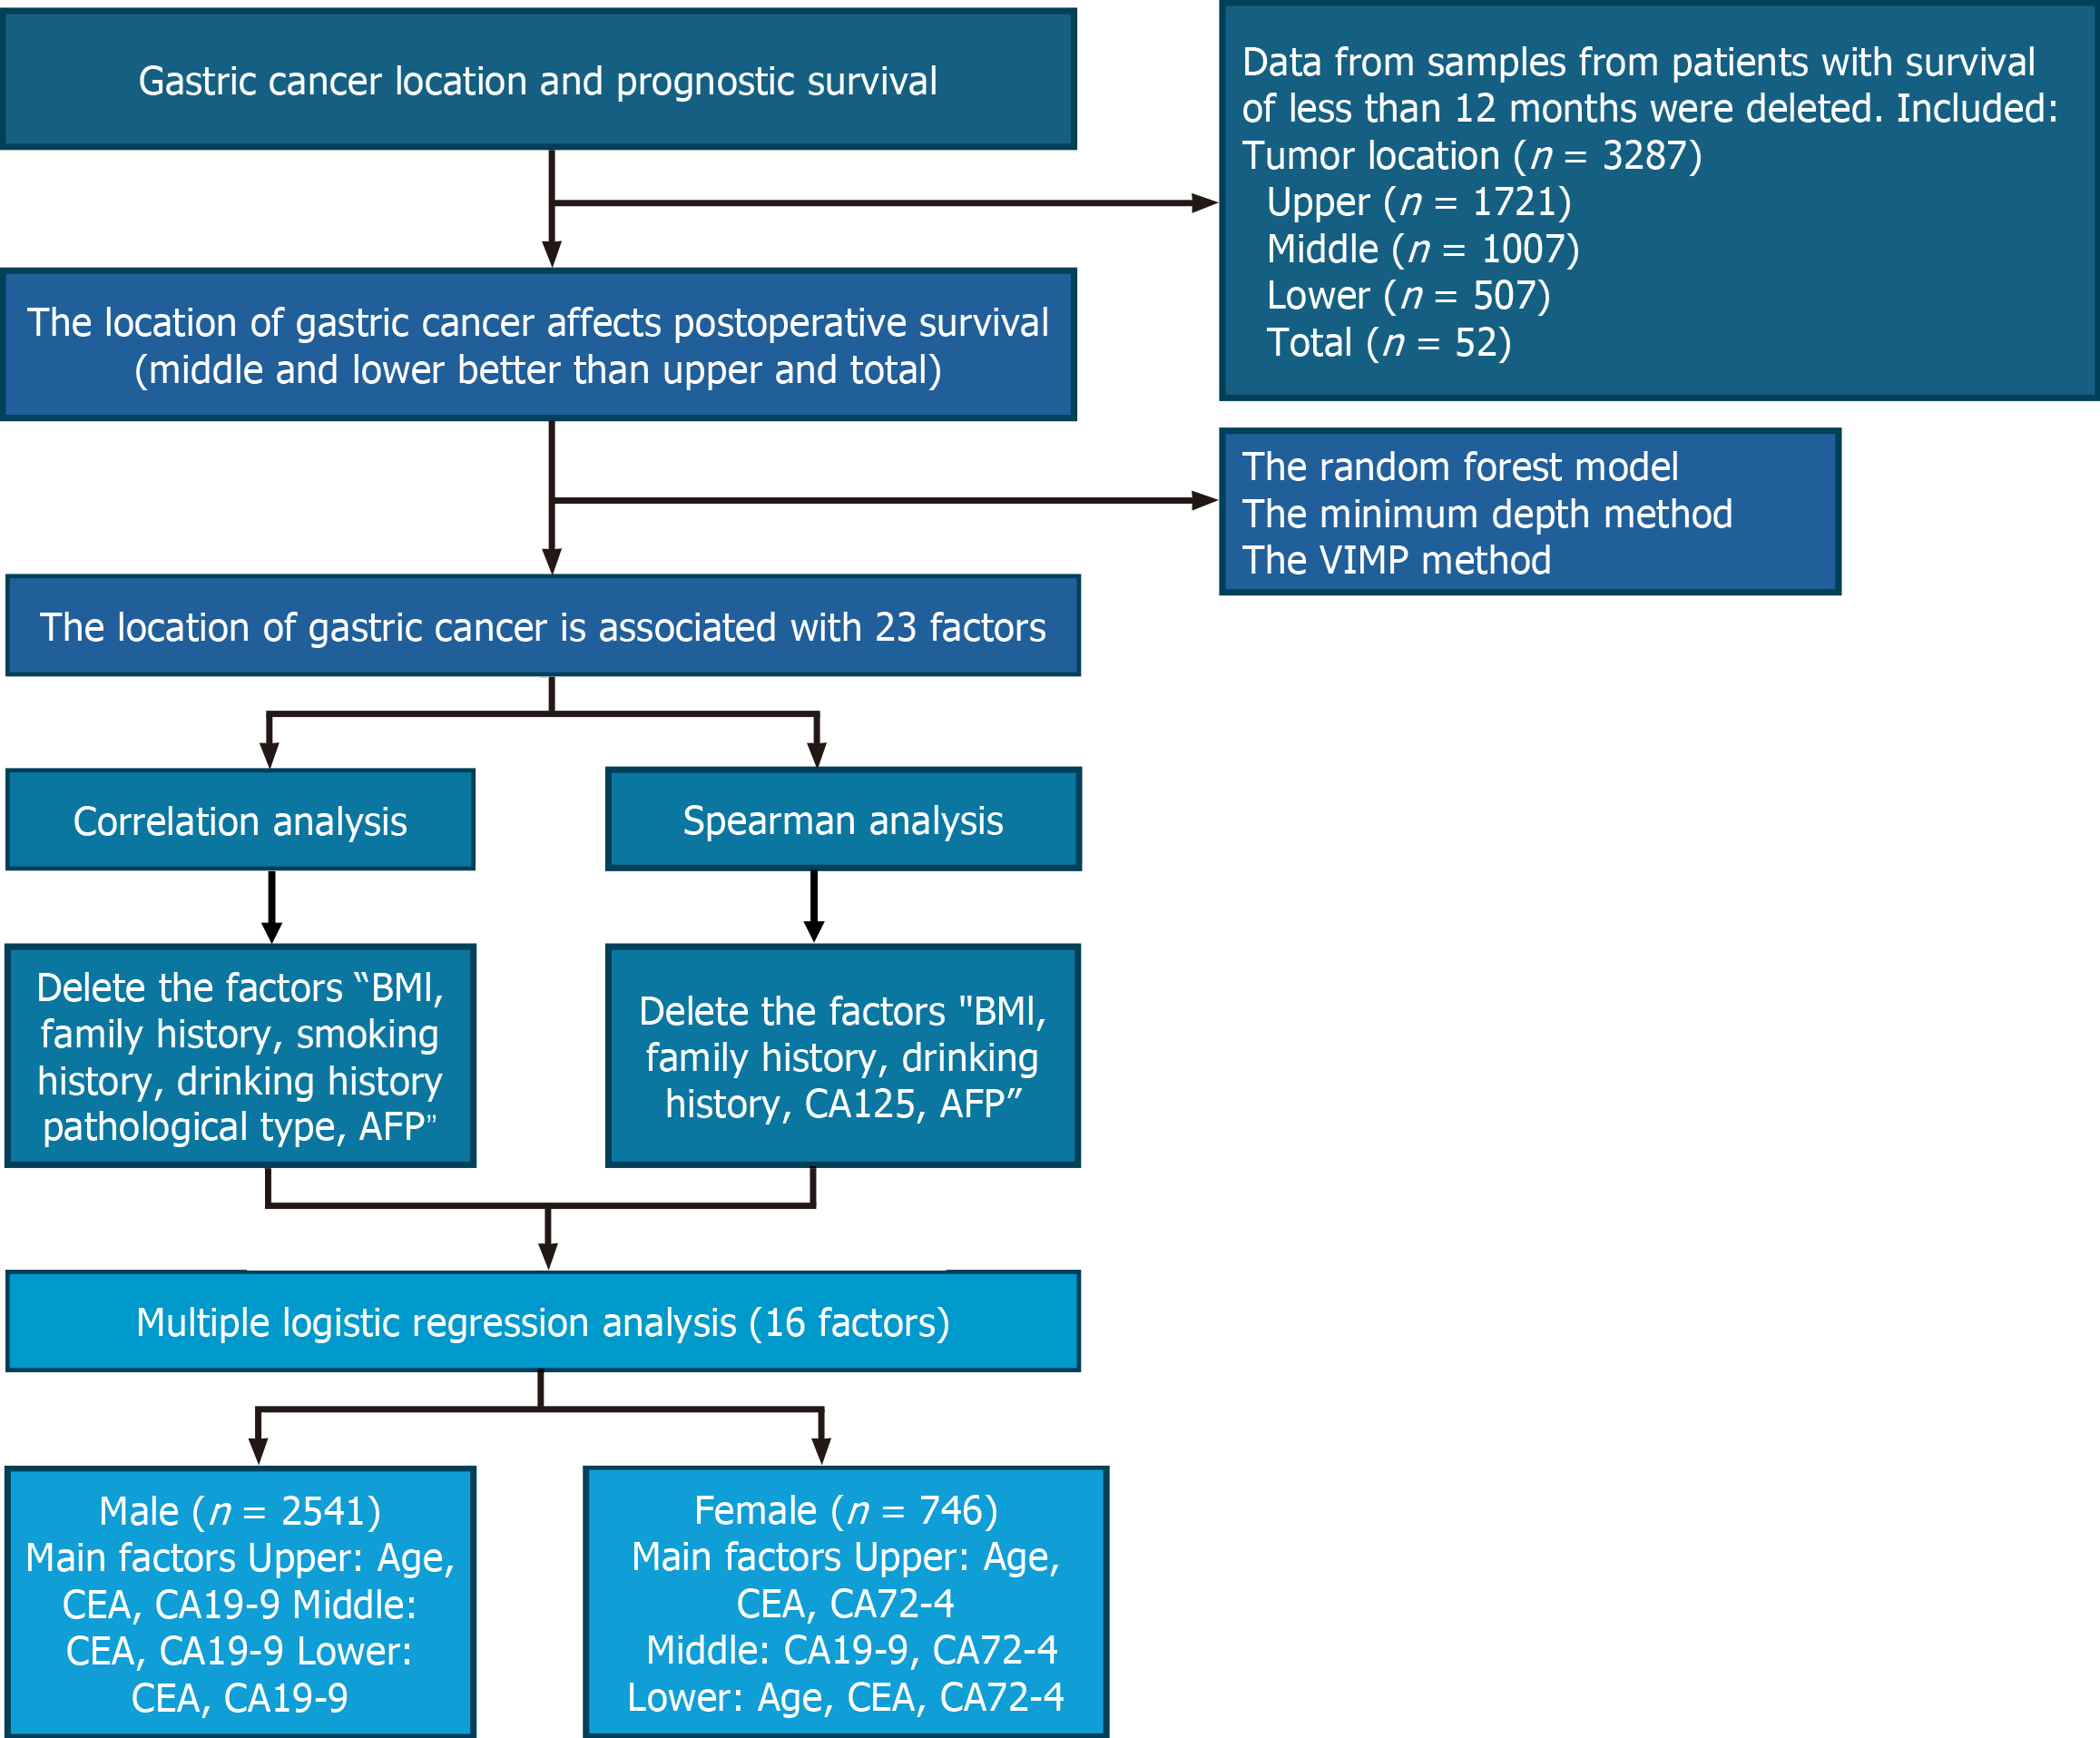
Figure 1 Flow chart of the data selection and processing steps.
AFP: Alpha-fetoprotein; CEA: Carcinoembryonic antigen; CA: Carbohydrate antigen; BMI: Body mass index; VIMP: Variable importance.
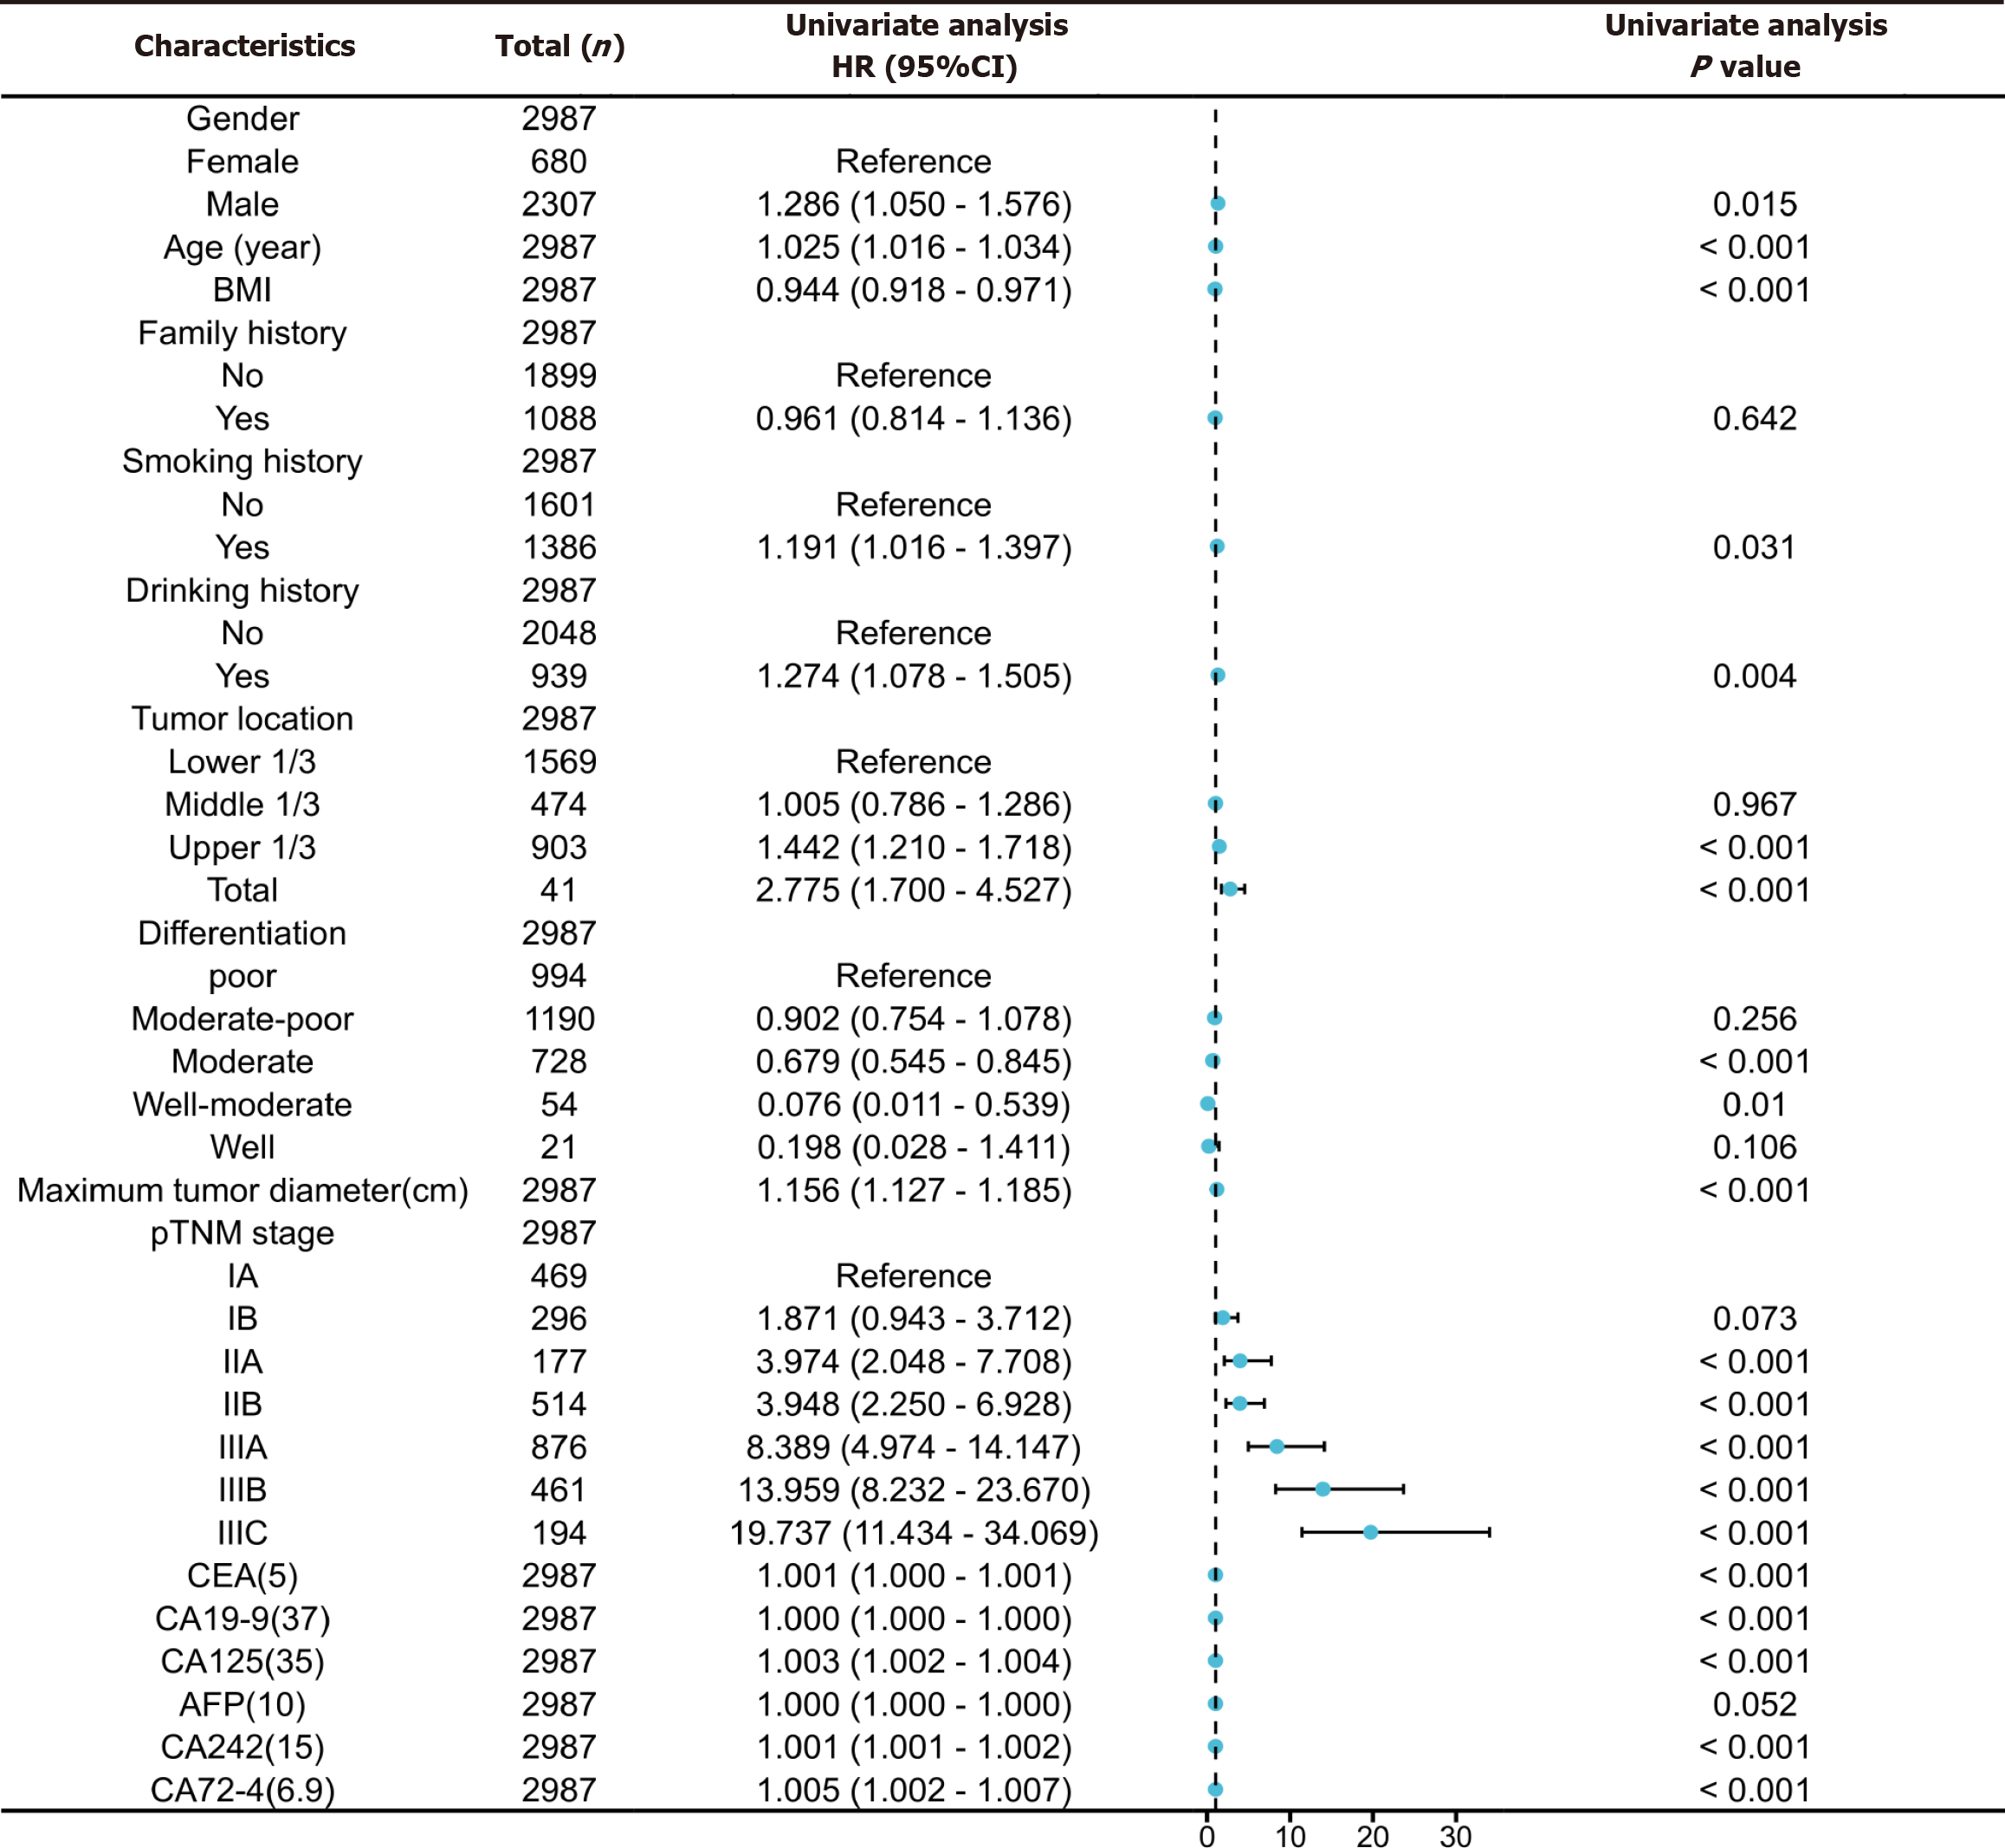
Figure 2 Forest plot of factors influencing survival in patients with gastric cancer.
The forest map displays hazard ratios (HRs) and 95% confidence intervals (95%CIs) for various factors that influence tumor prognosis according to multiple Cox regression analyses. Each dot represents the HR for a specific factor, the horizontal line represents the 95%CI, and the vertical blank line represents the reference line (HR = 1.0), indicating no impact. Factors with good HR and CI on the right side of the line were significant predictors of poor prognosis. Values in parentheses are the highest normal levels for that tumor marker. CEA: Carcinoembryonic antigen; AFP: Alpha-fetoprotein; CA: Carbohydrate antigen; BMI: Body mass index; 95%CI: 95% confidence interval; HR: Hazard ratio; pTNM: Pathological tumor-node-metastasis.
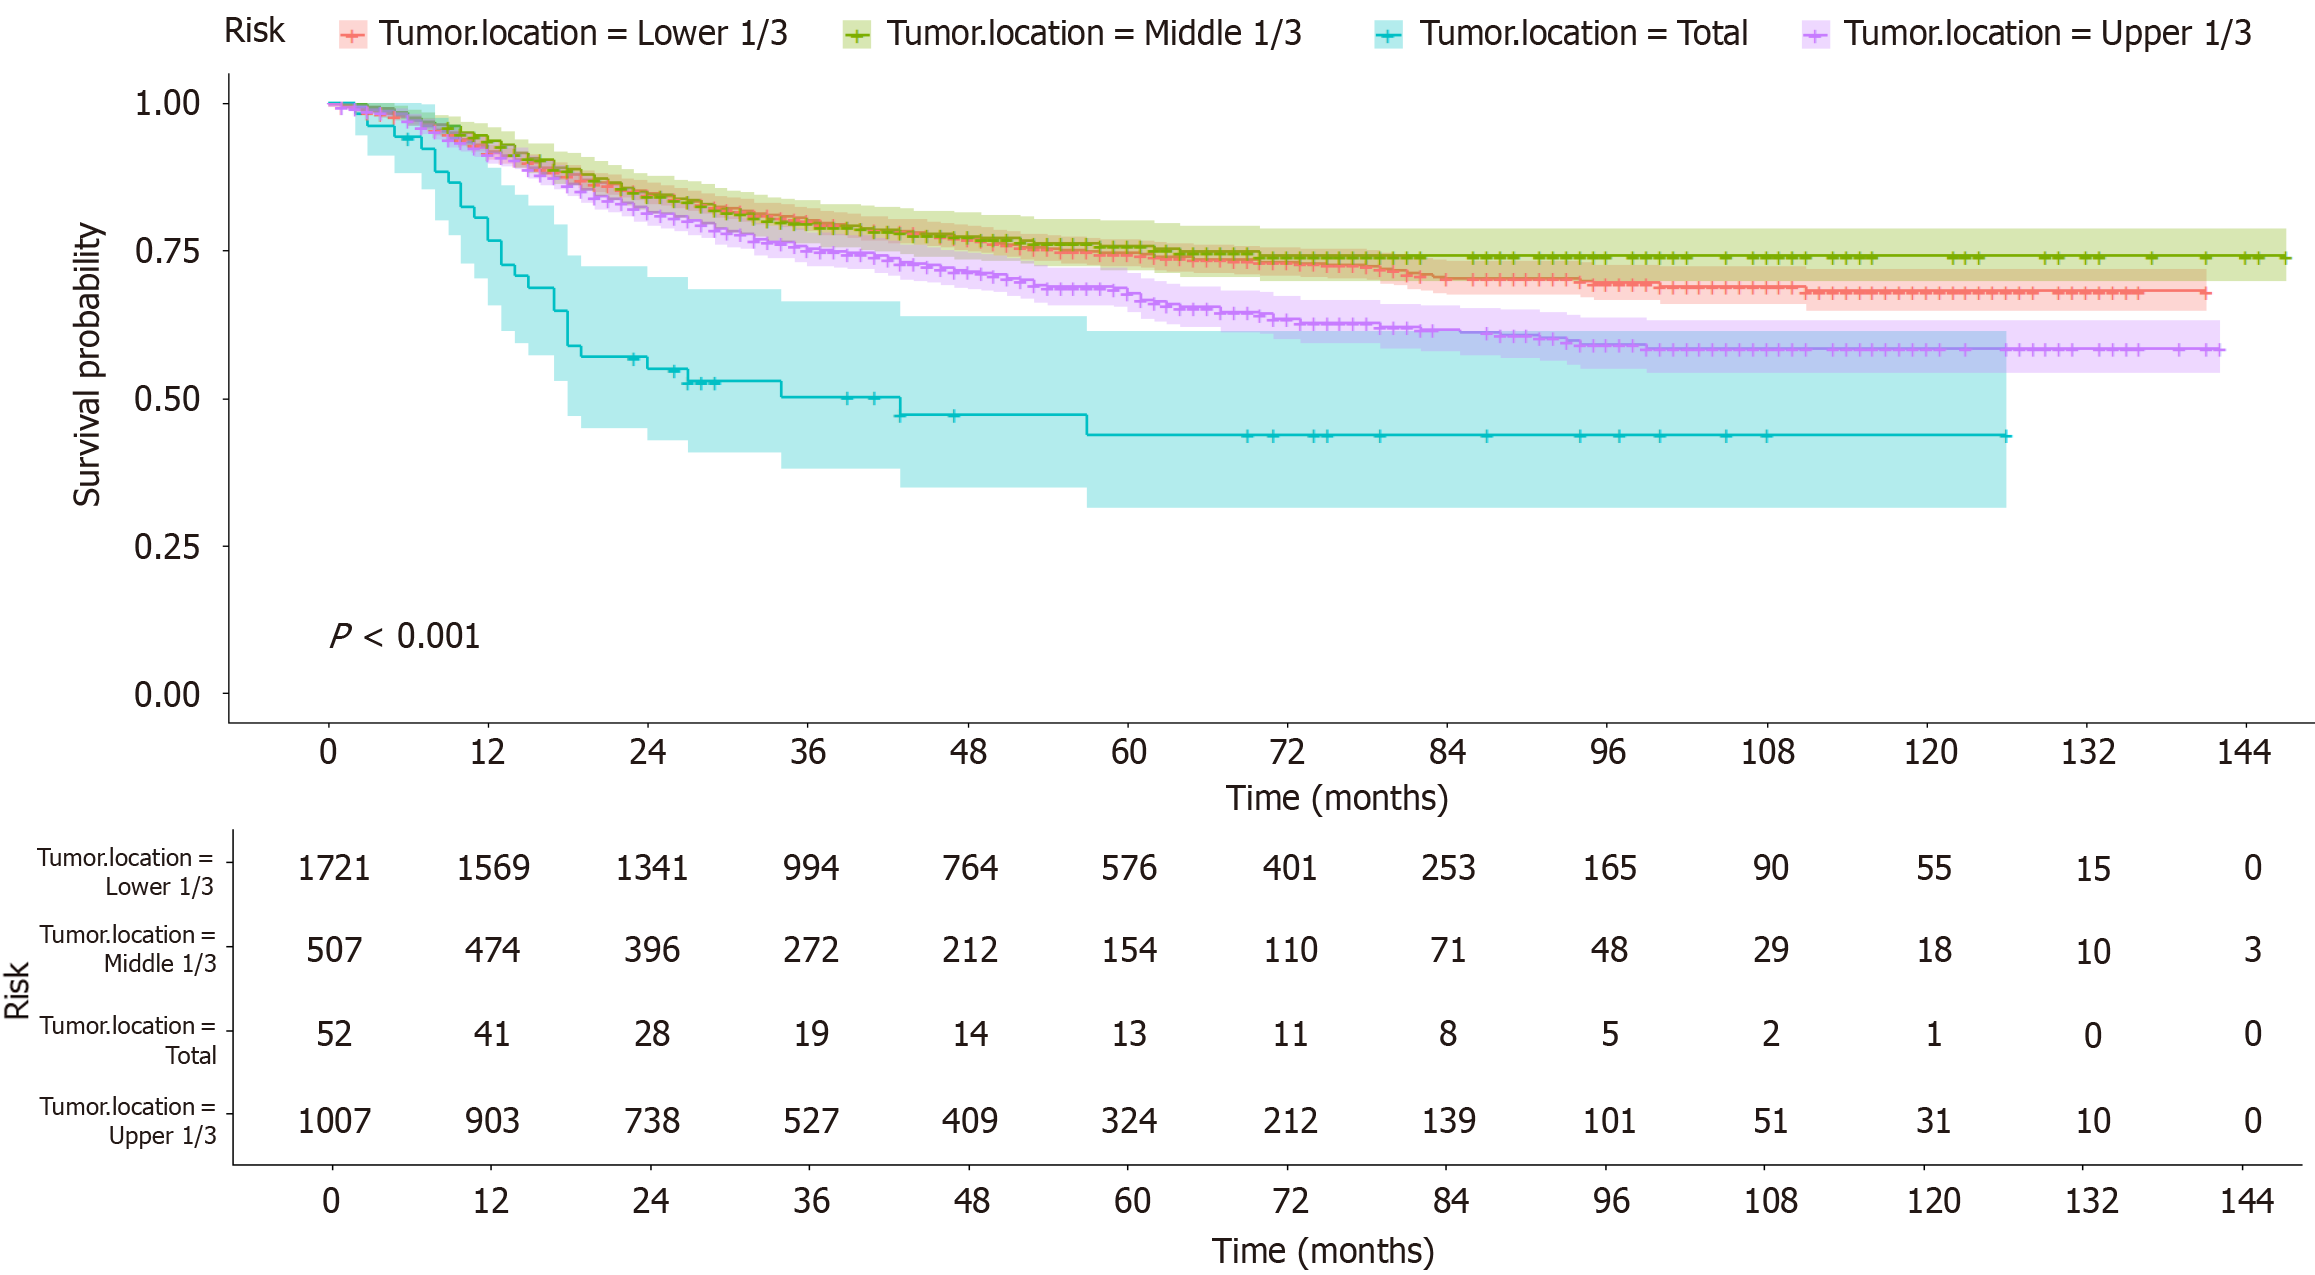
Figure 3 Kaplan-Meier survival curves for different locations of gastric cancer, where different colors represent different locations.
Red: Lower 1/3; green: Middle 1/3; blue: Total; purple: Upper 1/3). The solid line represents the Kaplan-Meier estimates for each group. The shaded area around the survival curve represents the 95% confidence interval, representing the range of fluctuations in the true survival estimate. A P value less than 0.05 was considered to indicate statistical significance.
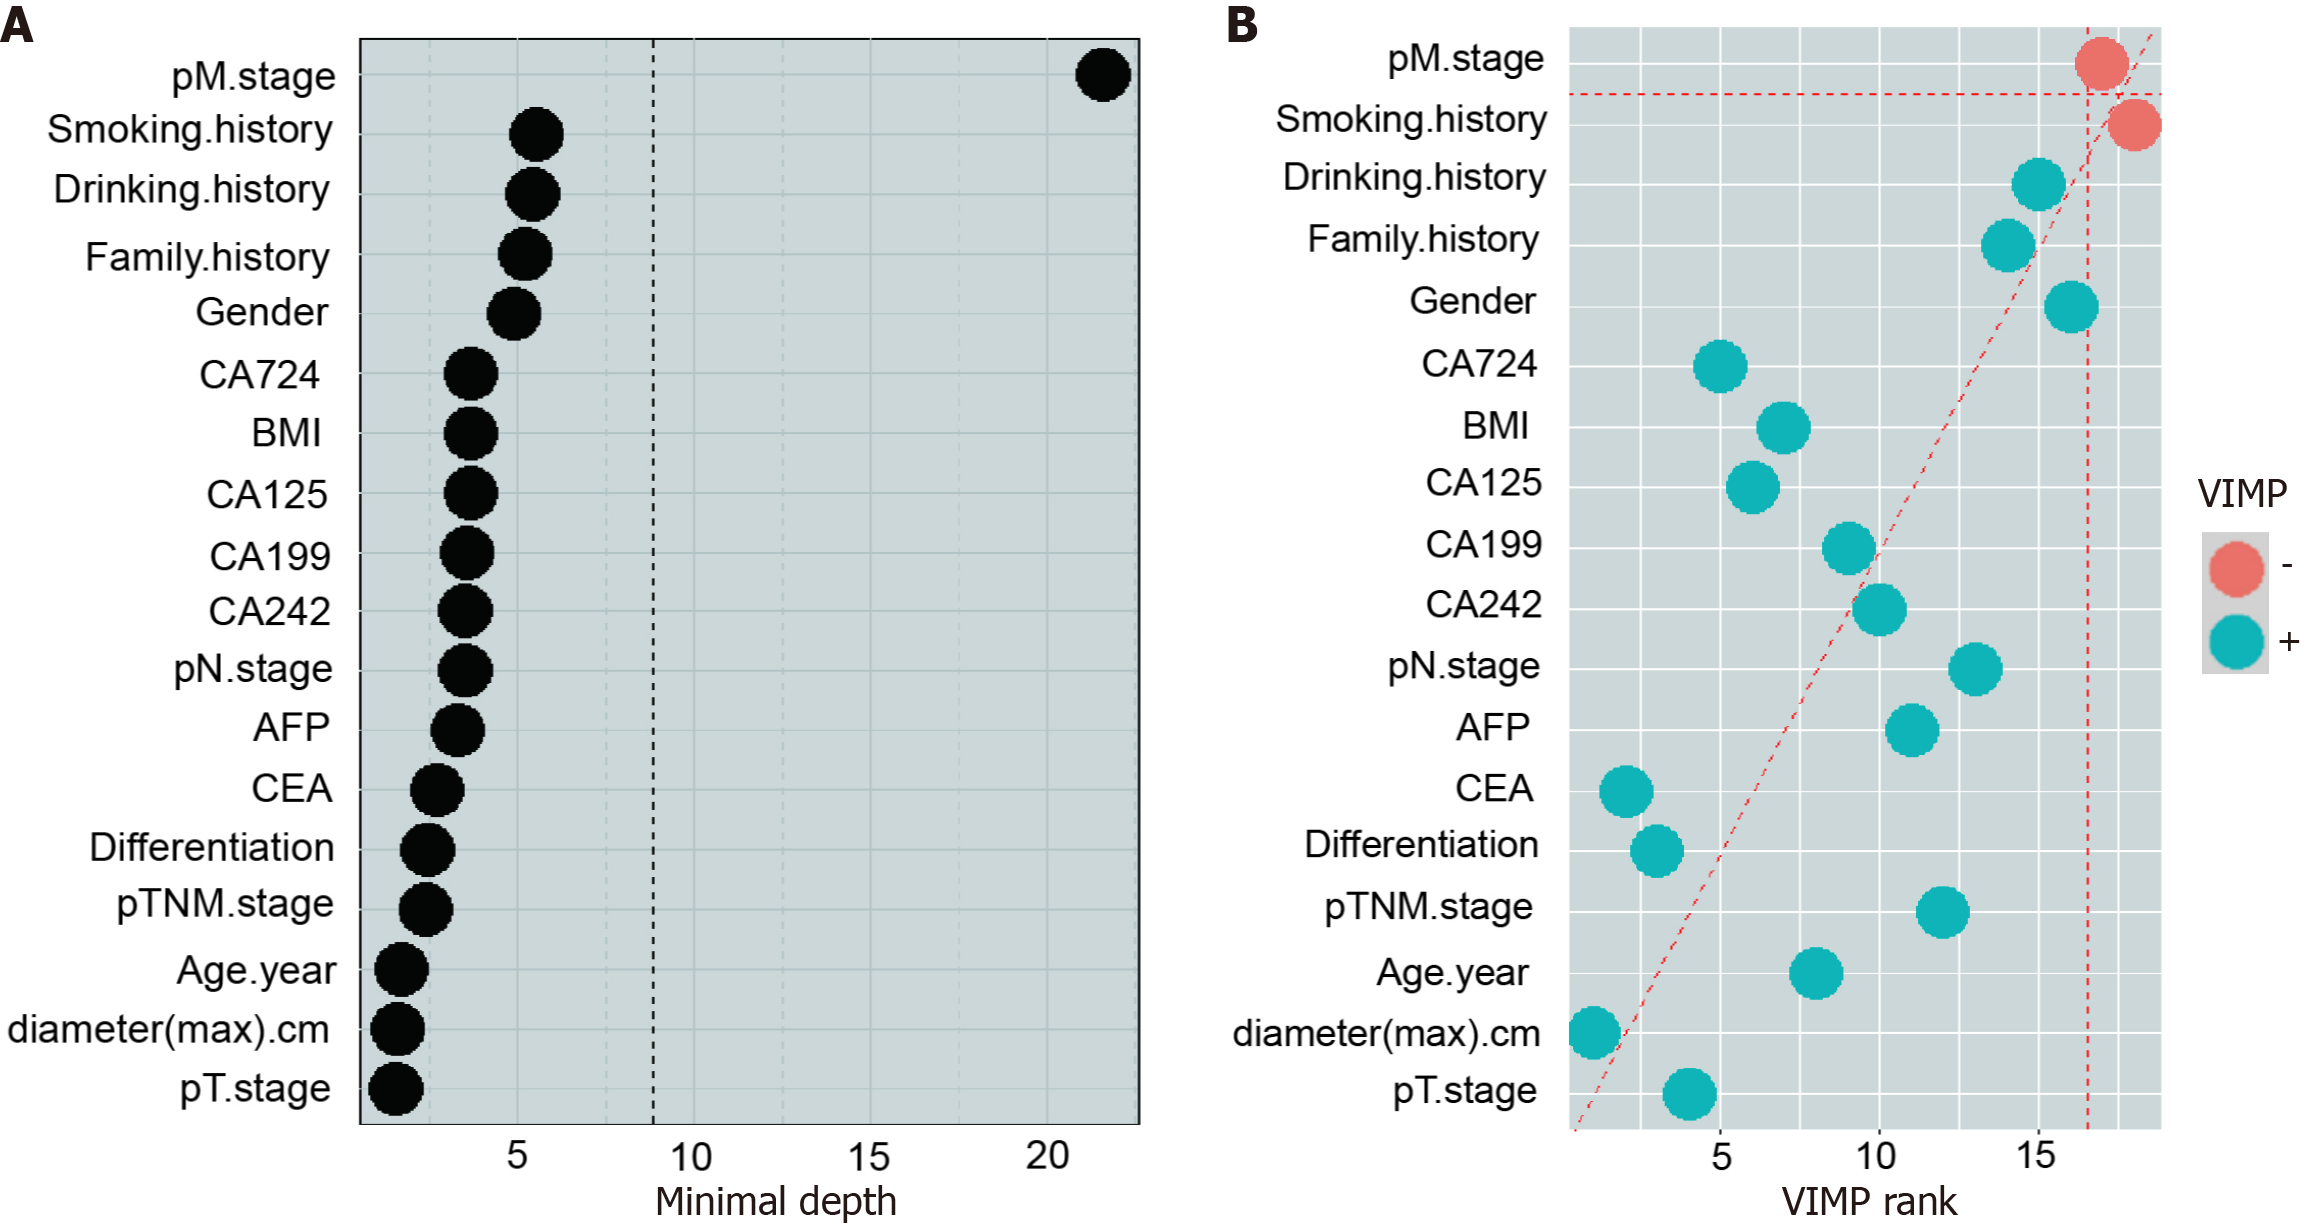
Figure 4 Variable importance of the predictors for the predictive models for gastric cancer location.
A: The minimum depth method was used to calculate the influencing factors related to the location of gastric cancer (GC). The vertical dashed line represents the minimum depth threshold; B: The variable importance method was used to calculate the influencing factors related to the location of GC. The green dots indicate strong correlations among impact factors, and the orange dots indicate weak correlations among impact factors. CEA: Carcinoembryonic antigen; AFP: Alpha-fetoprotein; CA: Carbohydrate antigen; BMI: Body mass index; pTNM: Pathological tumor-node-metastasis.
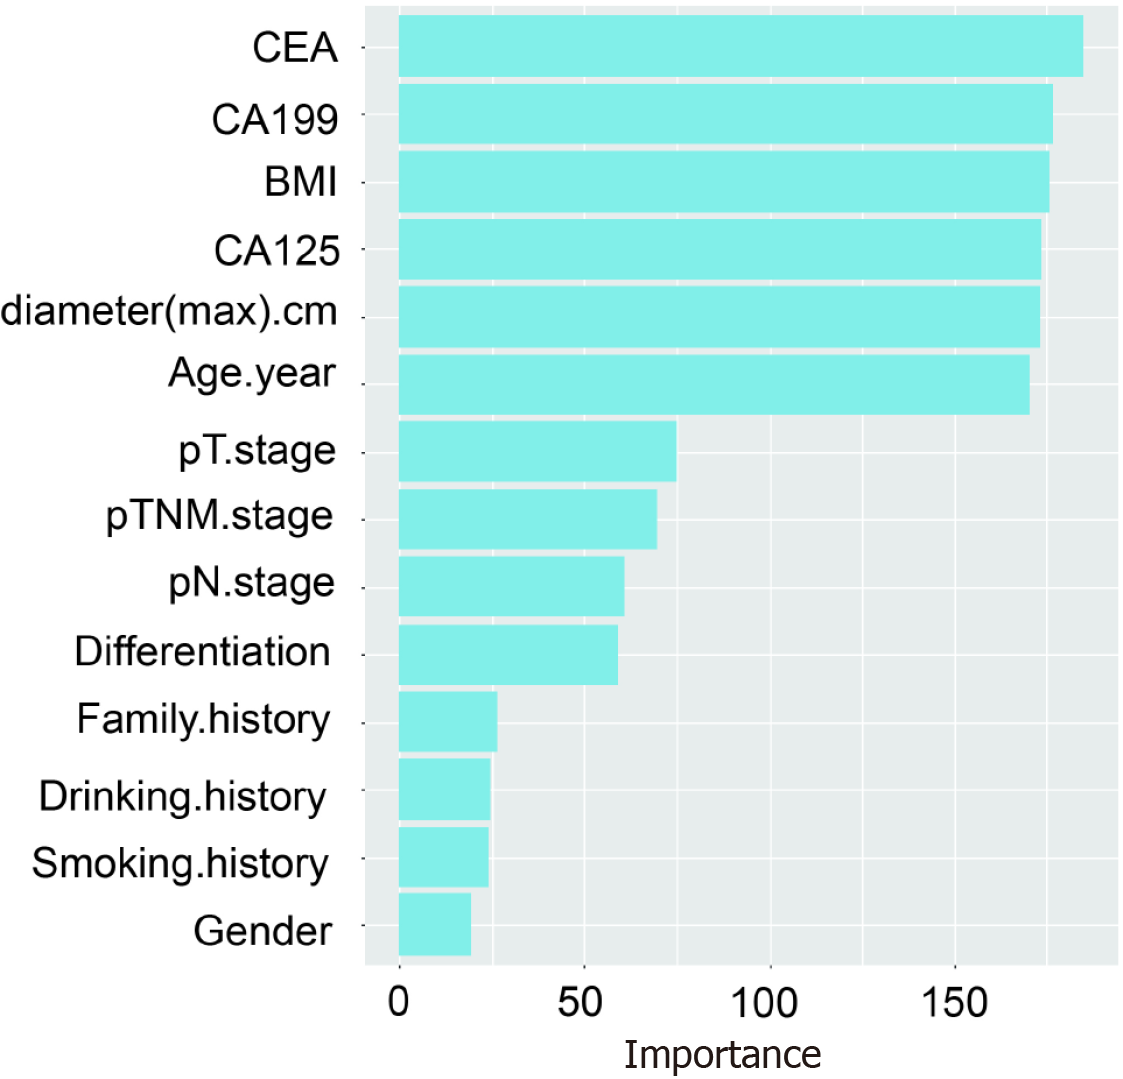
Figure 5 Random forest plot of influencing factors related to gastric cancer location.
According to the random forest model, the importance of each parameter to the degree of influence on the location of gastric cancer was calculated, and the histogram was drawn in order of importance. CEA: Carcinoembryonic antigen; CA: Carbohydrate antigen; BMI: Body mass index; pTNM: Pathological tumor-node-metastasis.
- Citation: Huang YX, He HY, Chen K, Liu HD, Zu D, Liang C, Bao QM, Hu YC, Liu GX, Zhong YK, Zhang CK, Deng MC, He YH, Jing J, Shi Y, Xu SF, Teng YS, Ye Z, Cheng XD. Prognostic impact and reasons for variability by tumor location in gastric cancer. World J Gastroenterol 2024; 30(44): 4709-4724
- URL: https://www.wjgnet.com/1007-9327/full/v30/i44/4709.htm
- DOI: https://dx.doi.org/10.3748/wjg.v30.i44.4709


