Copyright
©The Author(s) 2024.
World J Gastroenterol. Sep 28, 2024; 30(36): 4057-4070
Published online Sep 28, 2024. doi: 10.3748/wjg.v30.i36.4057
Published online Sep 28, 2024. doi: 10.3748/wjg.v30.i36.4057
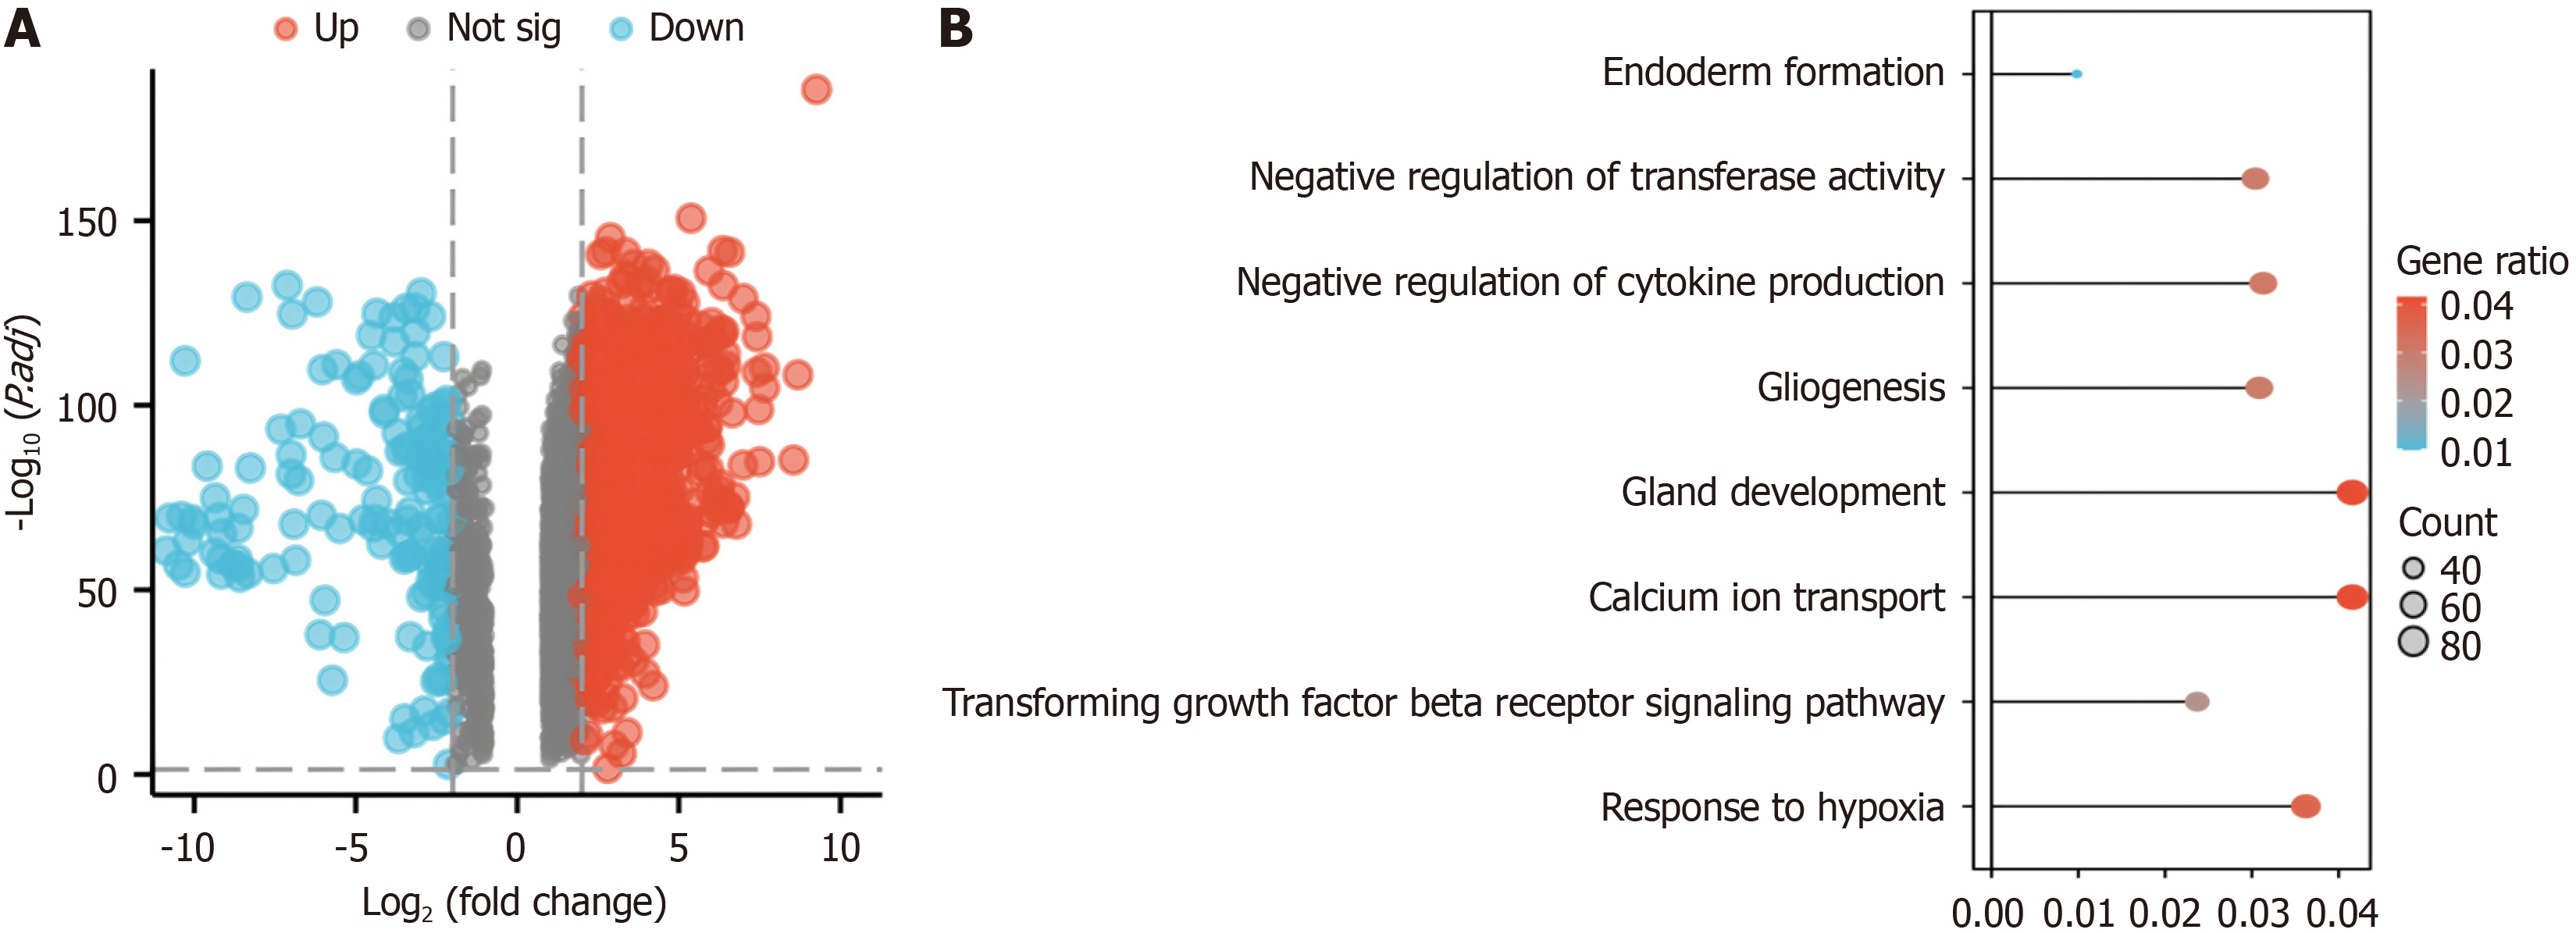
Figure 1 Identification and enrichment analysis of differentially expressed genes in the GEPIA2 dataset.
A: Genes differentially expressed in pancreatic cancer according to GEPIA2; upregulated in red (2457 upregulated genes) and downregulated in blue (2457 upregulated genes (158 downregulated genes); B: Gene Ontology and Kyoto Encyclopedia of Genes and Genomes enrichment analyses of the differentially expressed genes in the GEPIA2 pancreatic cancer dataset.
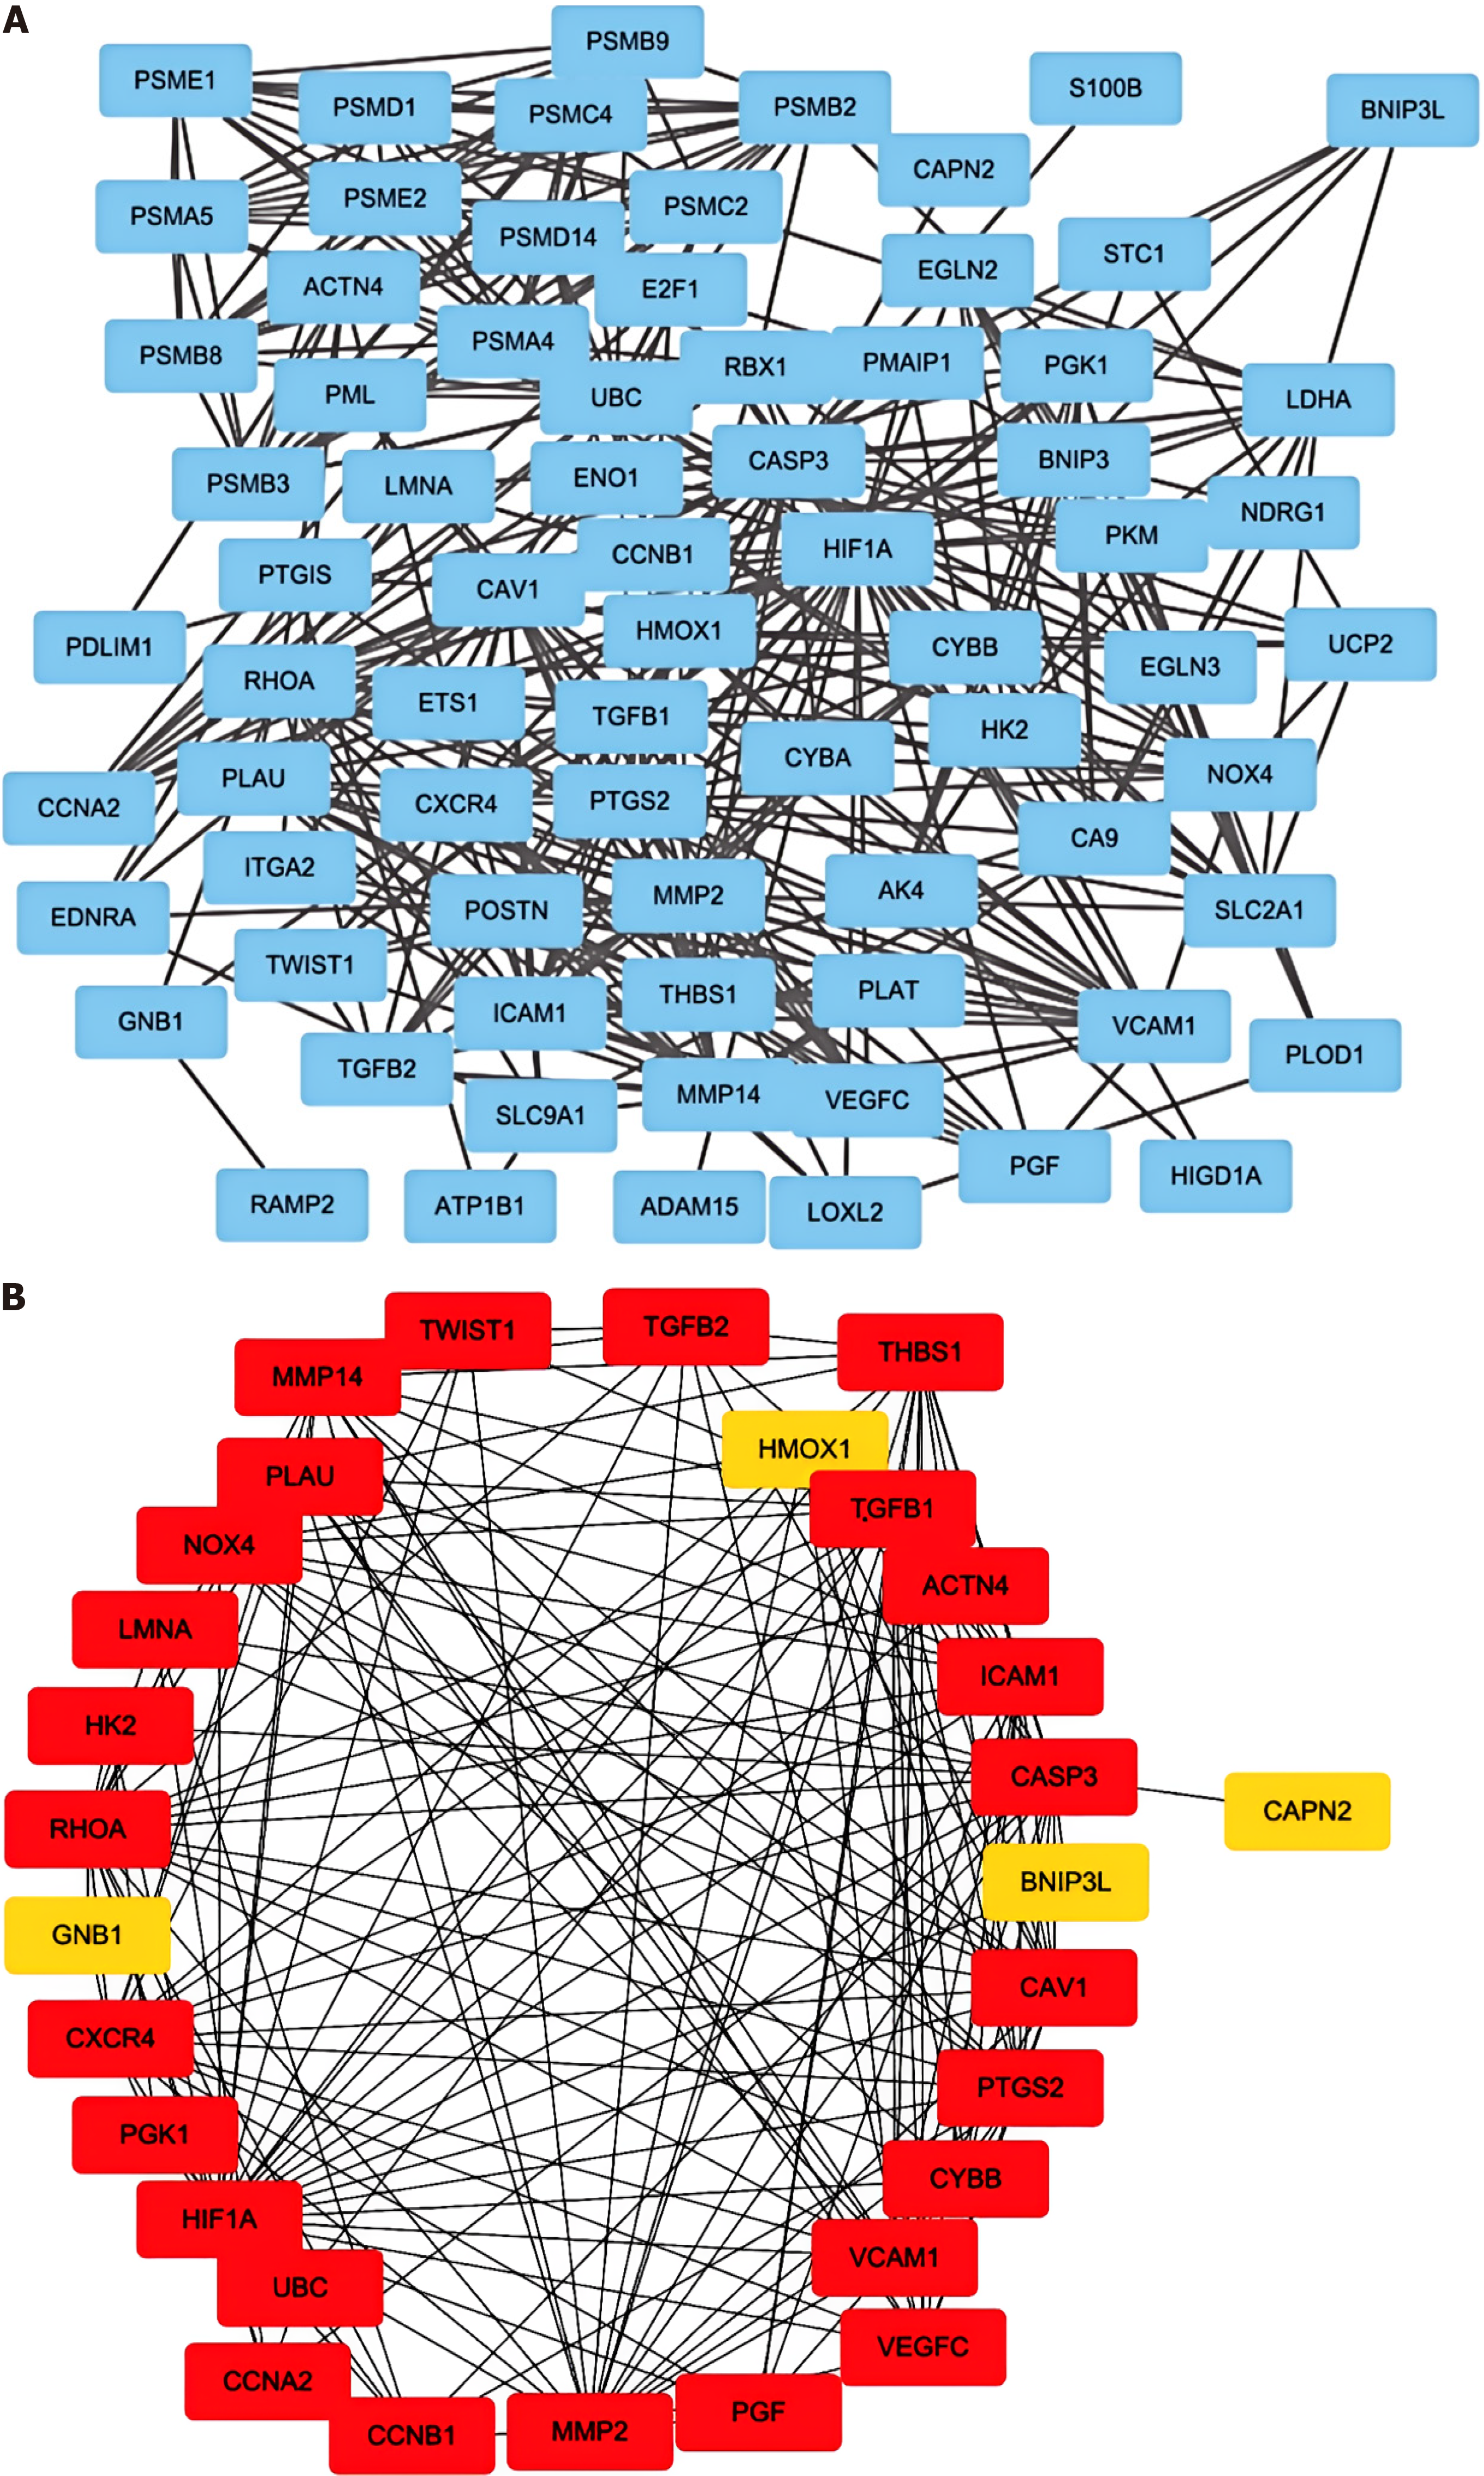
Figure 2 Visualization of genes associated with hypoxia pathways.
A: The protein-protein interaction network of the proteins related to the Gene Ontology (GO): 0001666 gene set; B: The direct interactions among thirty genes in GO: 0001666 were assessed via the “betweenness” algorithm.
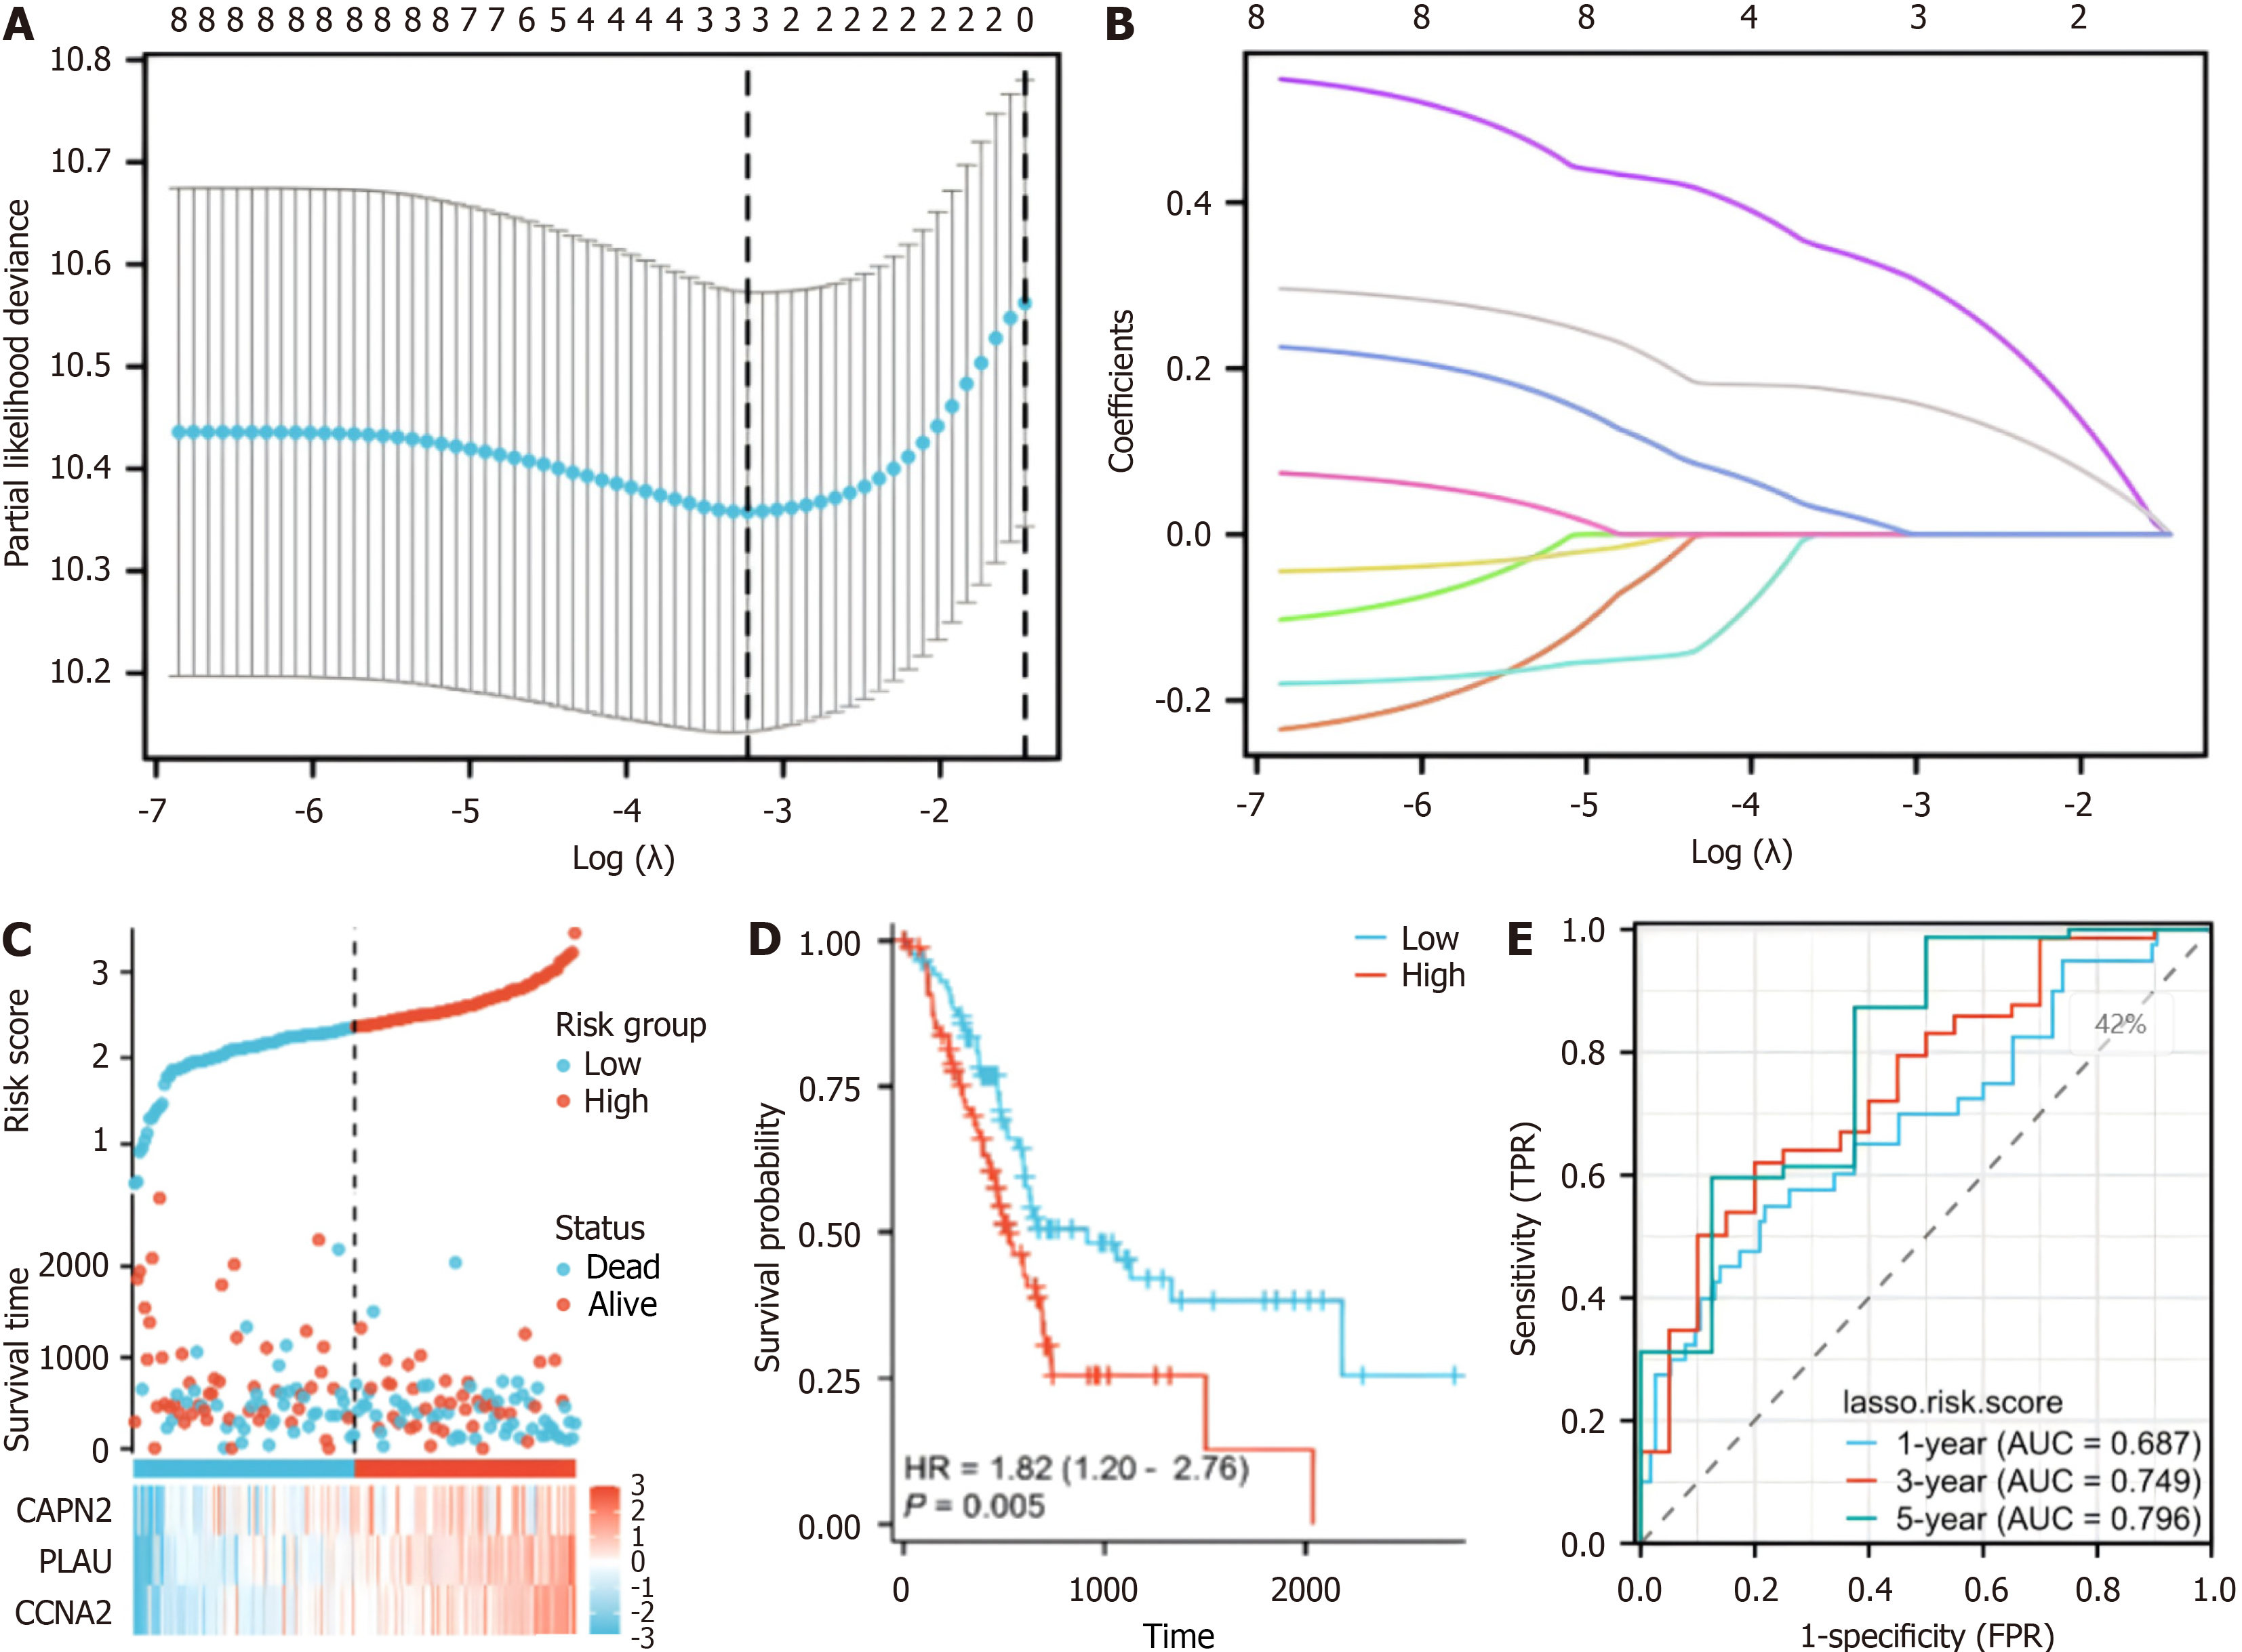
Figure 3 Risk score analysis, prognostic performance, and survival analysis based on the prognostic model.
A: Least absolute shrinkage and selection operator (LASSO) regression analysis with tenfold cross-validation was performed to construct a model based on 3 hypoxia-related genes; B: The coefficient distribution in the LASSO regression model; C: Risk scores and survival time distribution of patients in the cancer genome atlas-pancreatic adenocarcinoma (TCGA-PAAD) cohort stratified by the risk score of the hypoxia-related model; D: Kaplan-Meier analysis of overall survival (OS) for the risk groups in the TCGA-PAAD cohort (P = 0.005); E: The receiver operating characteristic curves of the risk score model for predicting 1-year [area under the curve (AUC) = 0.687], 3-year (AUC = 0.749), and 5-year (AUC = 0.796) OS in the TCGA-PAAD cohort.
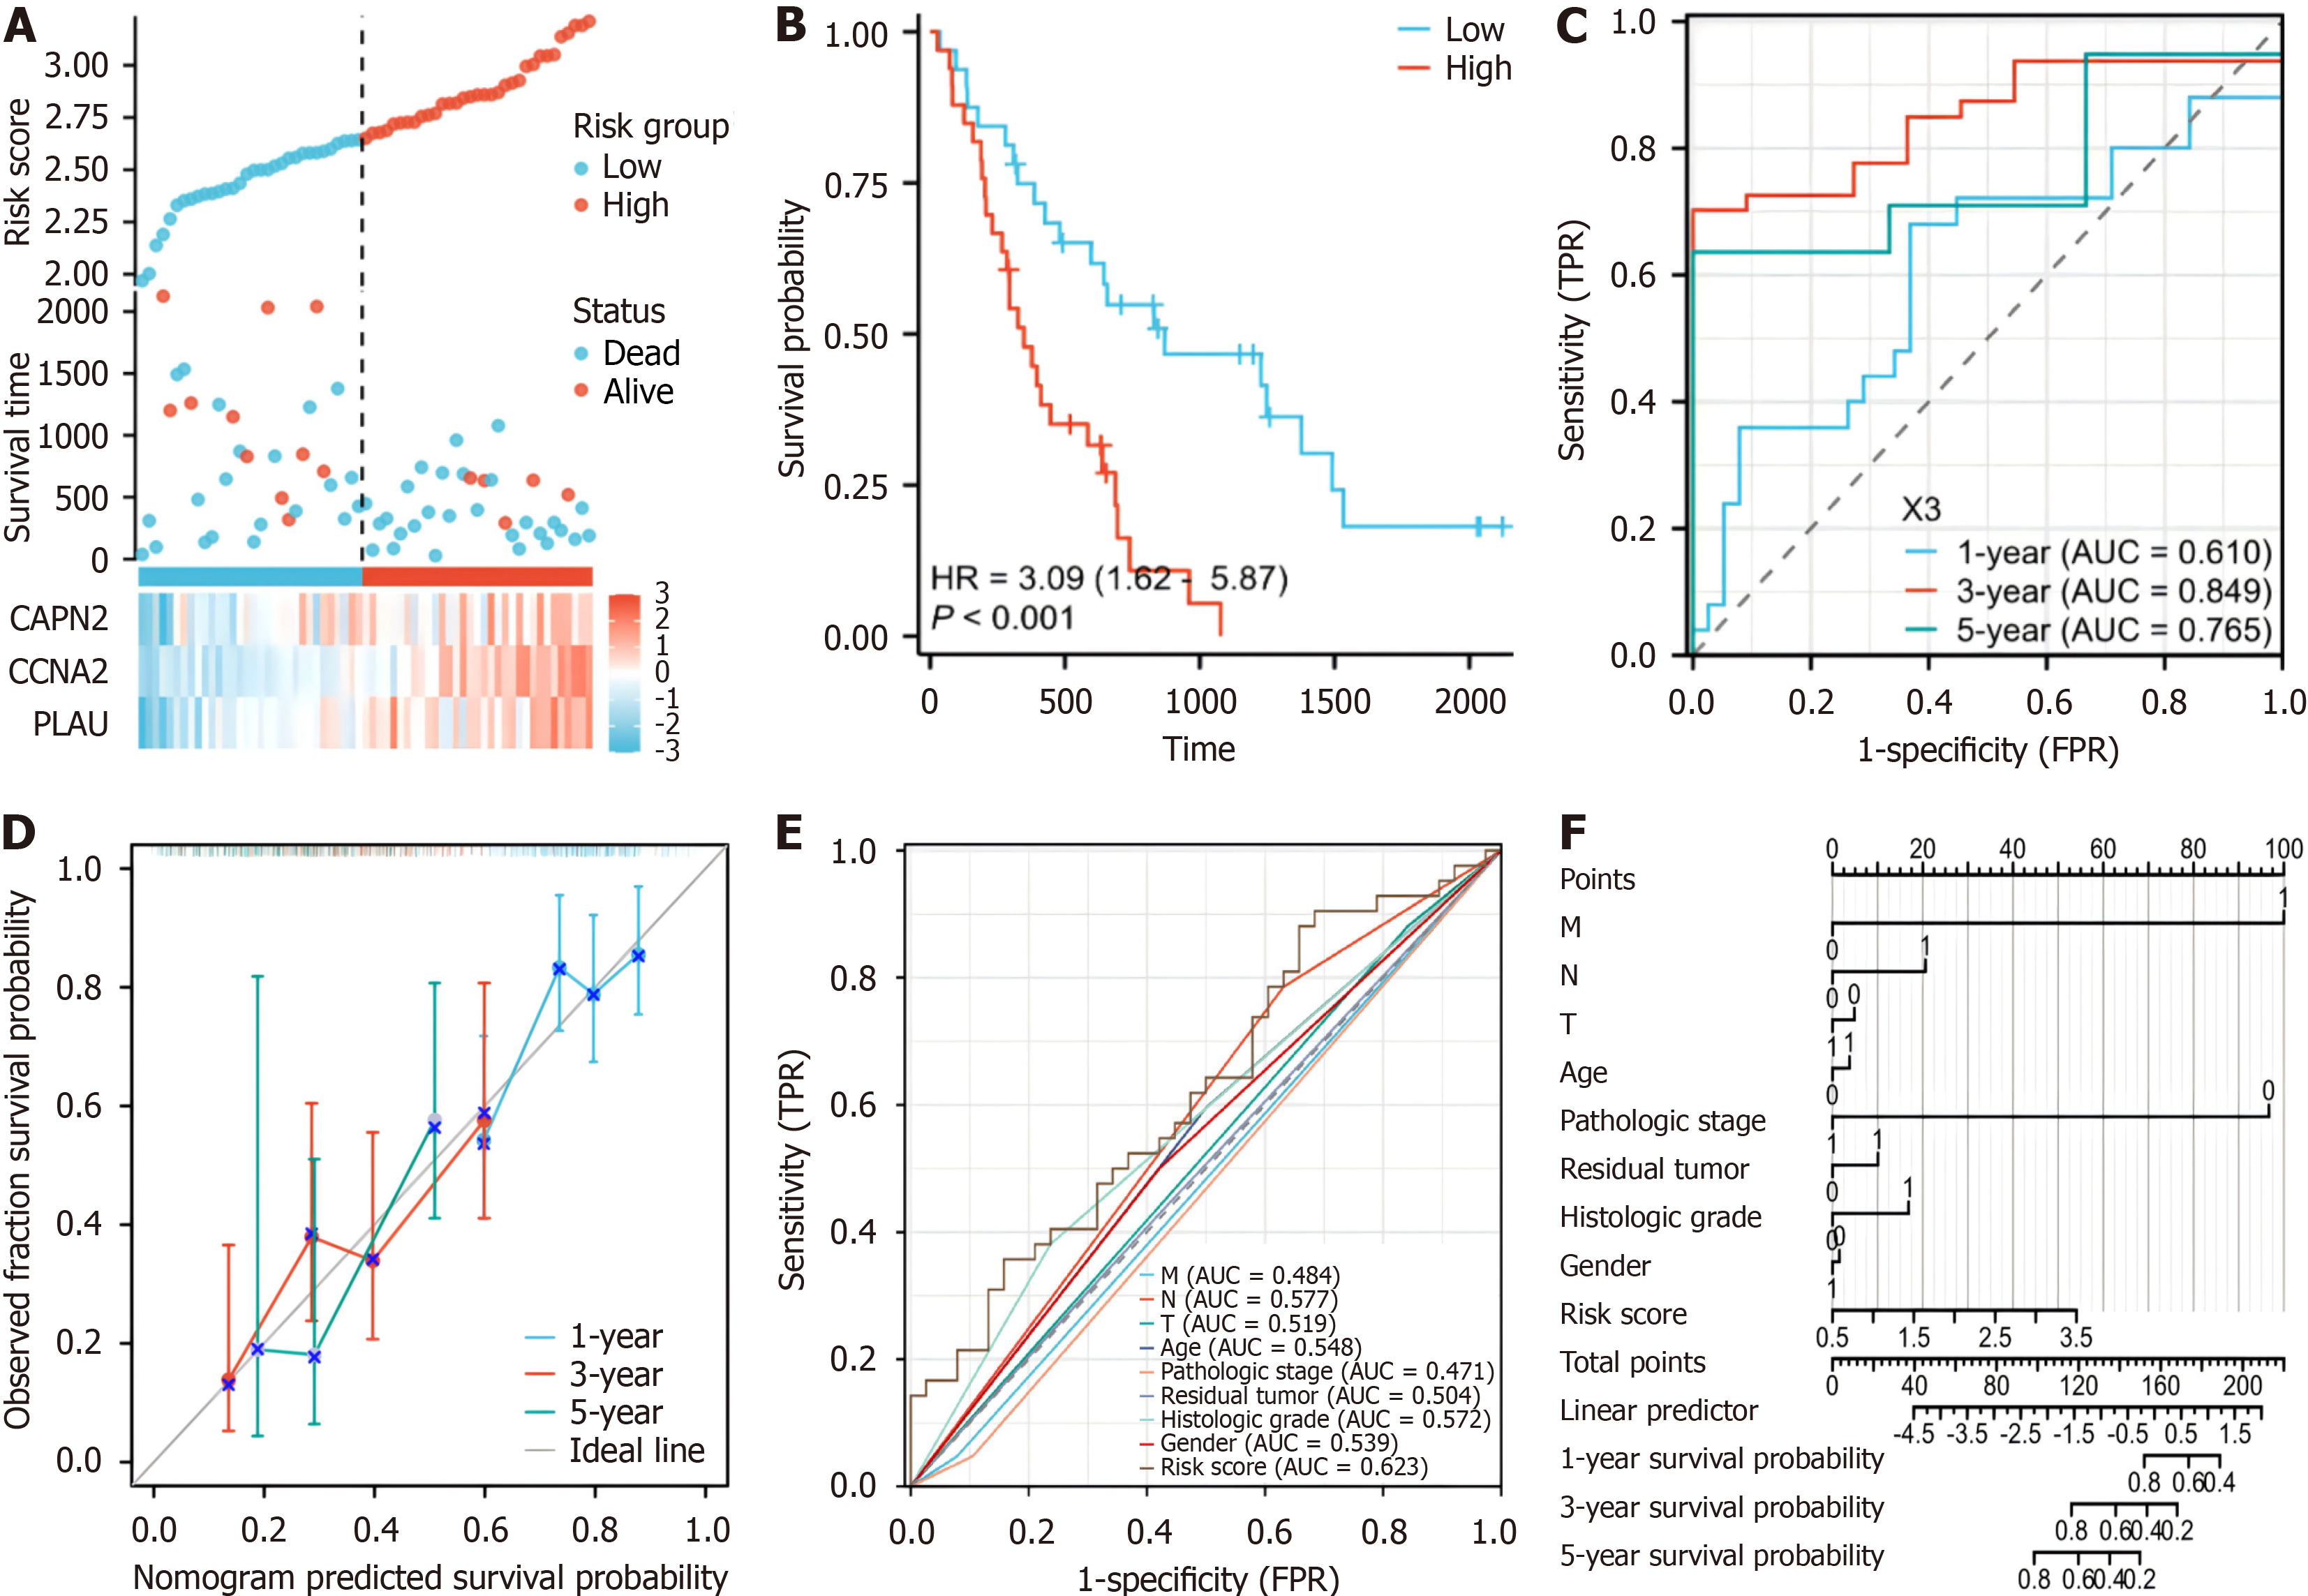
Figure 4 Analysis of the risk score model and its prognostic performance of the validation set prognostic model.
A: The risk score and survival time distribution of hypoxia-related genes in the verification cohort; B: Kaplan-Meier survival analysis of overall survival (OS) between risk groups in the verification cohort (P < 0.001); C: The verification set receiver operating characteristic (ROC) curves of the risk scoring model for predicting 1-year [area under the curve (AUC) = 0.765], 3-year (AUC = 0.845), and 5-year OS (AUC = 0.809) survival; D: Nomogram calibration curves for predicting 1-year, 3-year, and 5-year OS in the cancer genome atlas-pancreatic adenocarcinoma cohort; E: ROC curves for the prediction of survival based on the risk score and other variables (M, N, T, age, pathologic stage, residual tumor, neoplasm histologic grade, and LASSO-derived risk score); F: Nomogram of the risk score and traditional prognostic factors. AUC: Area under the curve.
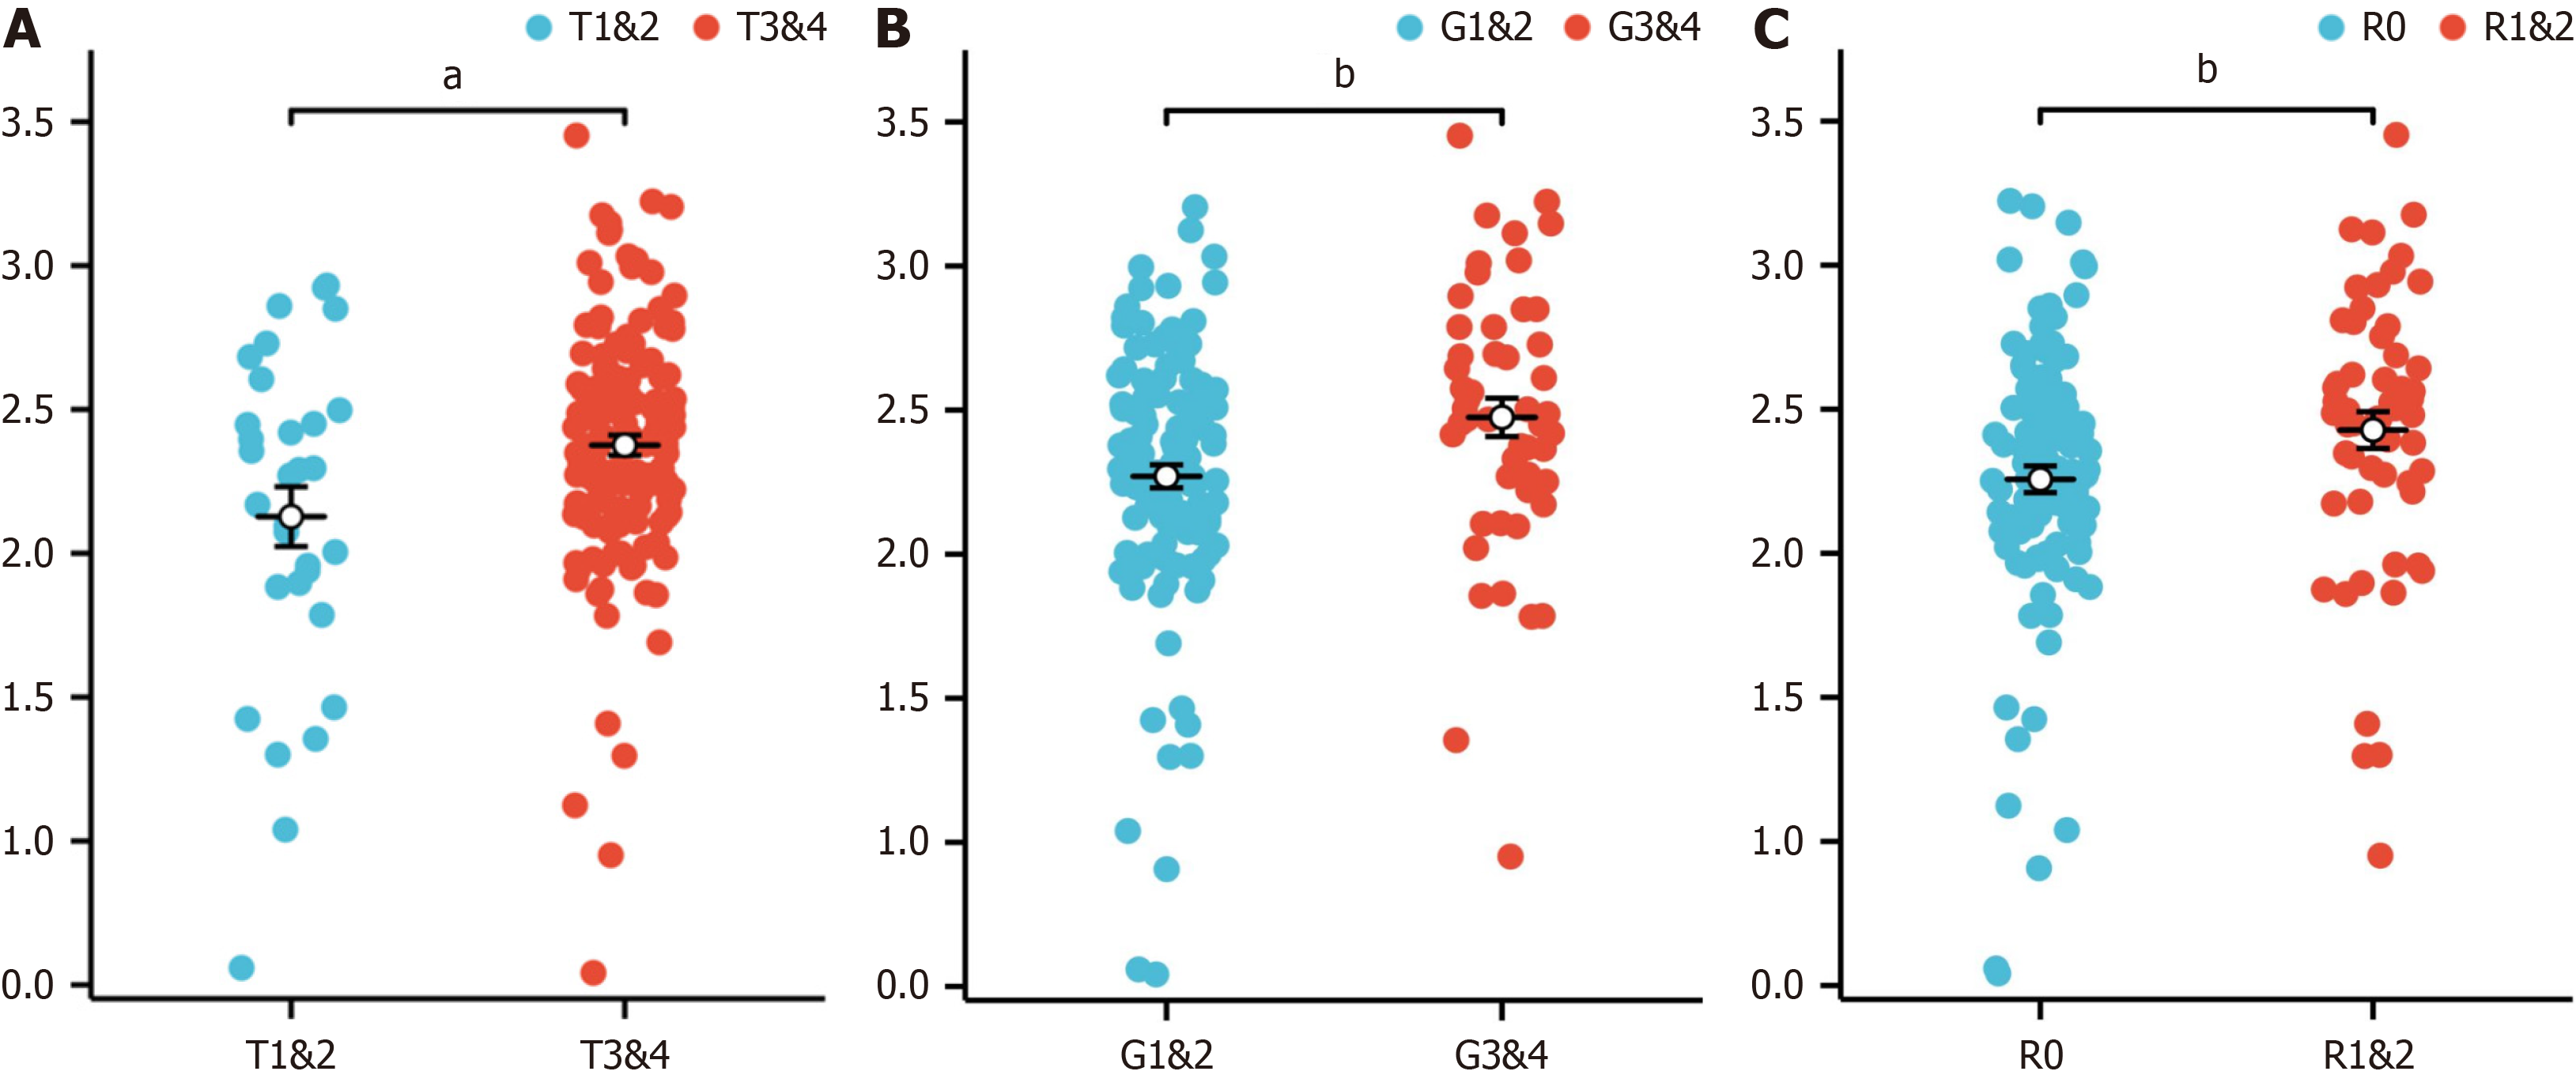
Figure 5 Association between clinical features and the risk score in the cancer genome atlas-pancreatic adenocarcinoma dataset.
A: T stage (T1 and T2 vs T3 and T4); B: G stage (G1 and G2 vs G3 and G4); C: Residual tumor status (R0 vs R1 and R2). aP < 0.05, bP < 0.01.
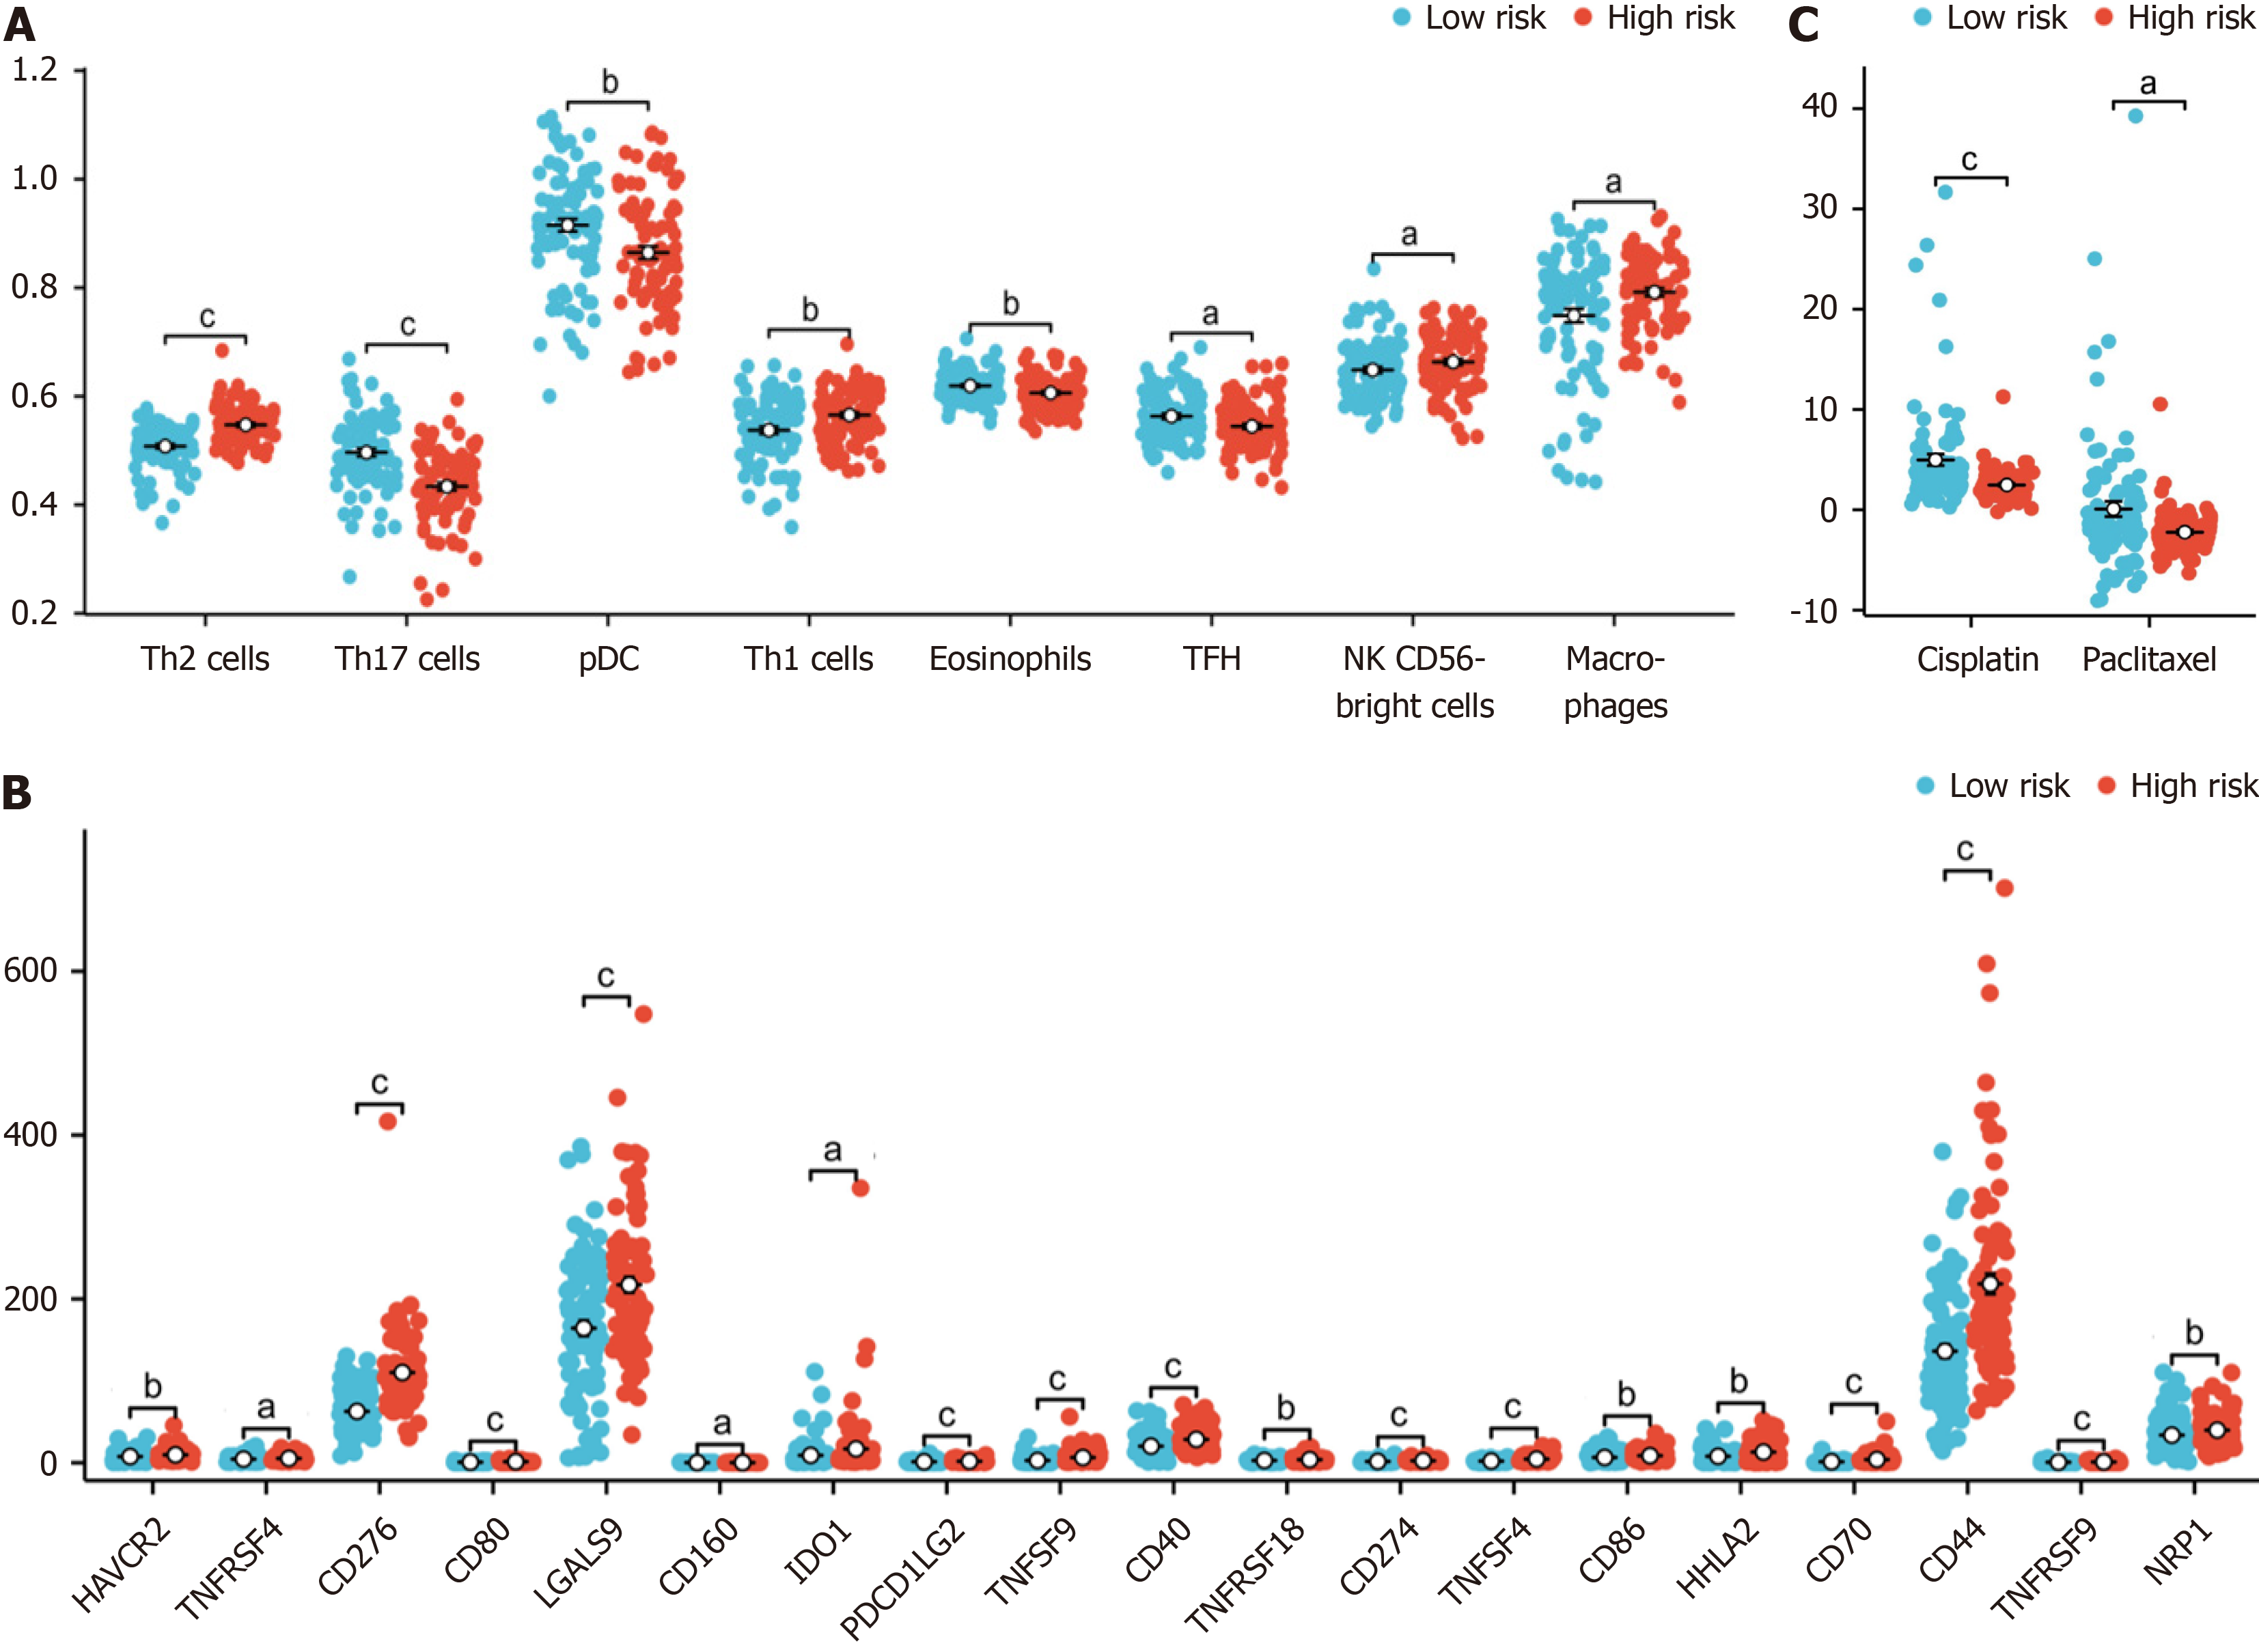
Figure 6 Association of immune infiltration with the risk score in the cancer genome atlas-pancreatic adenocarcinoma dataset.
A: Box plot showing the difference in the level of immune cell infiltration between the high-risk and low-risk groups; B: The box plot shows the difference in immune checkpoint expression between the high-risk and low-risk groups; C: The estimated half-maximal inhibitory concentration of different hypoxia-related risk groups. aP < 0.05, bP < 0.01, cP < 0.001.
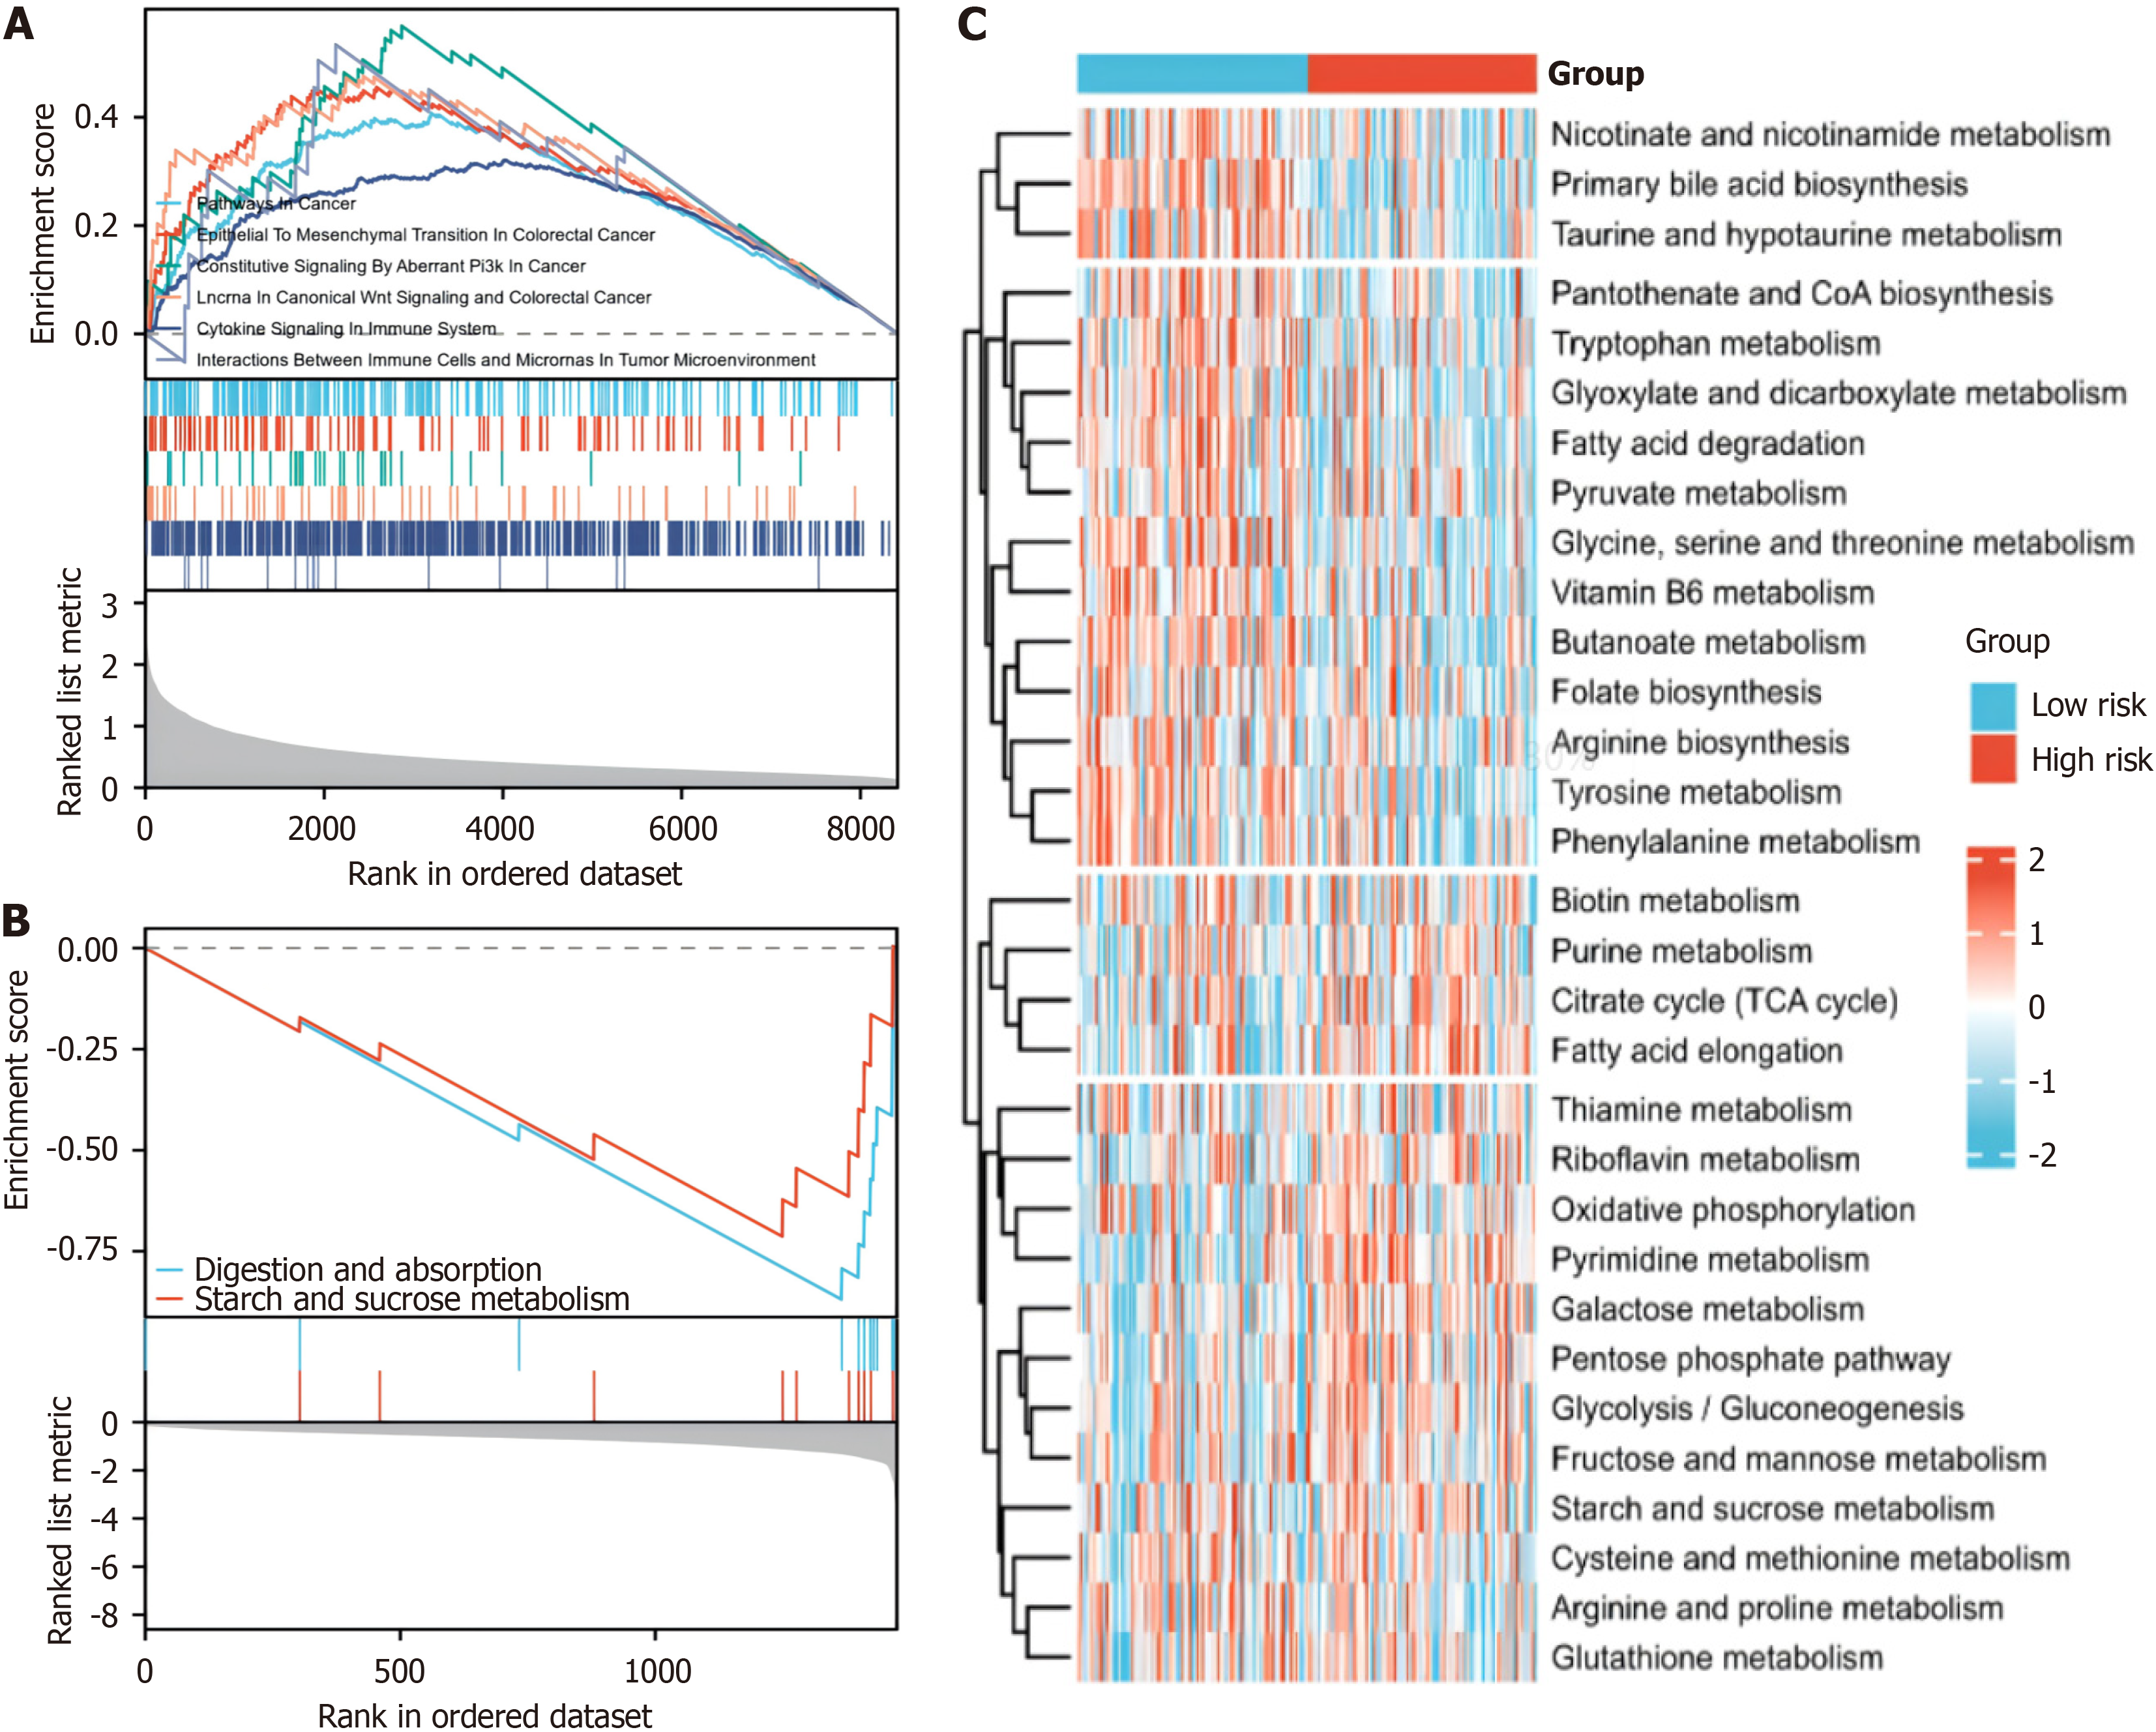
Figure 7 Enrichment of signalling pathways in the hypoxia-related risk groups.
A: gene set enrichment analysis (GSEA) of the differentially expressed genes in the high-risk group based on the hypoxia-related model; B: GSEA of differentially expressed genes in the low-risk and high-risk groups based on the hypoxia-related model; C: Gene Set Variation Analysis of the enrichment of metabolic pathways in different risk groups based on the hypoxia-related model.
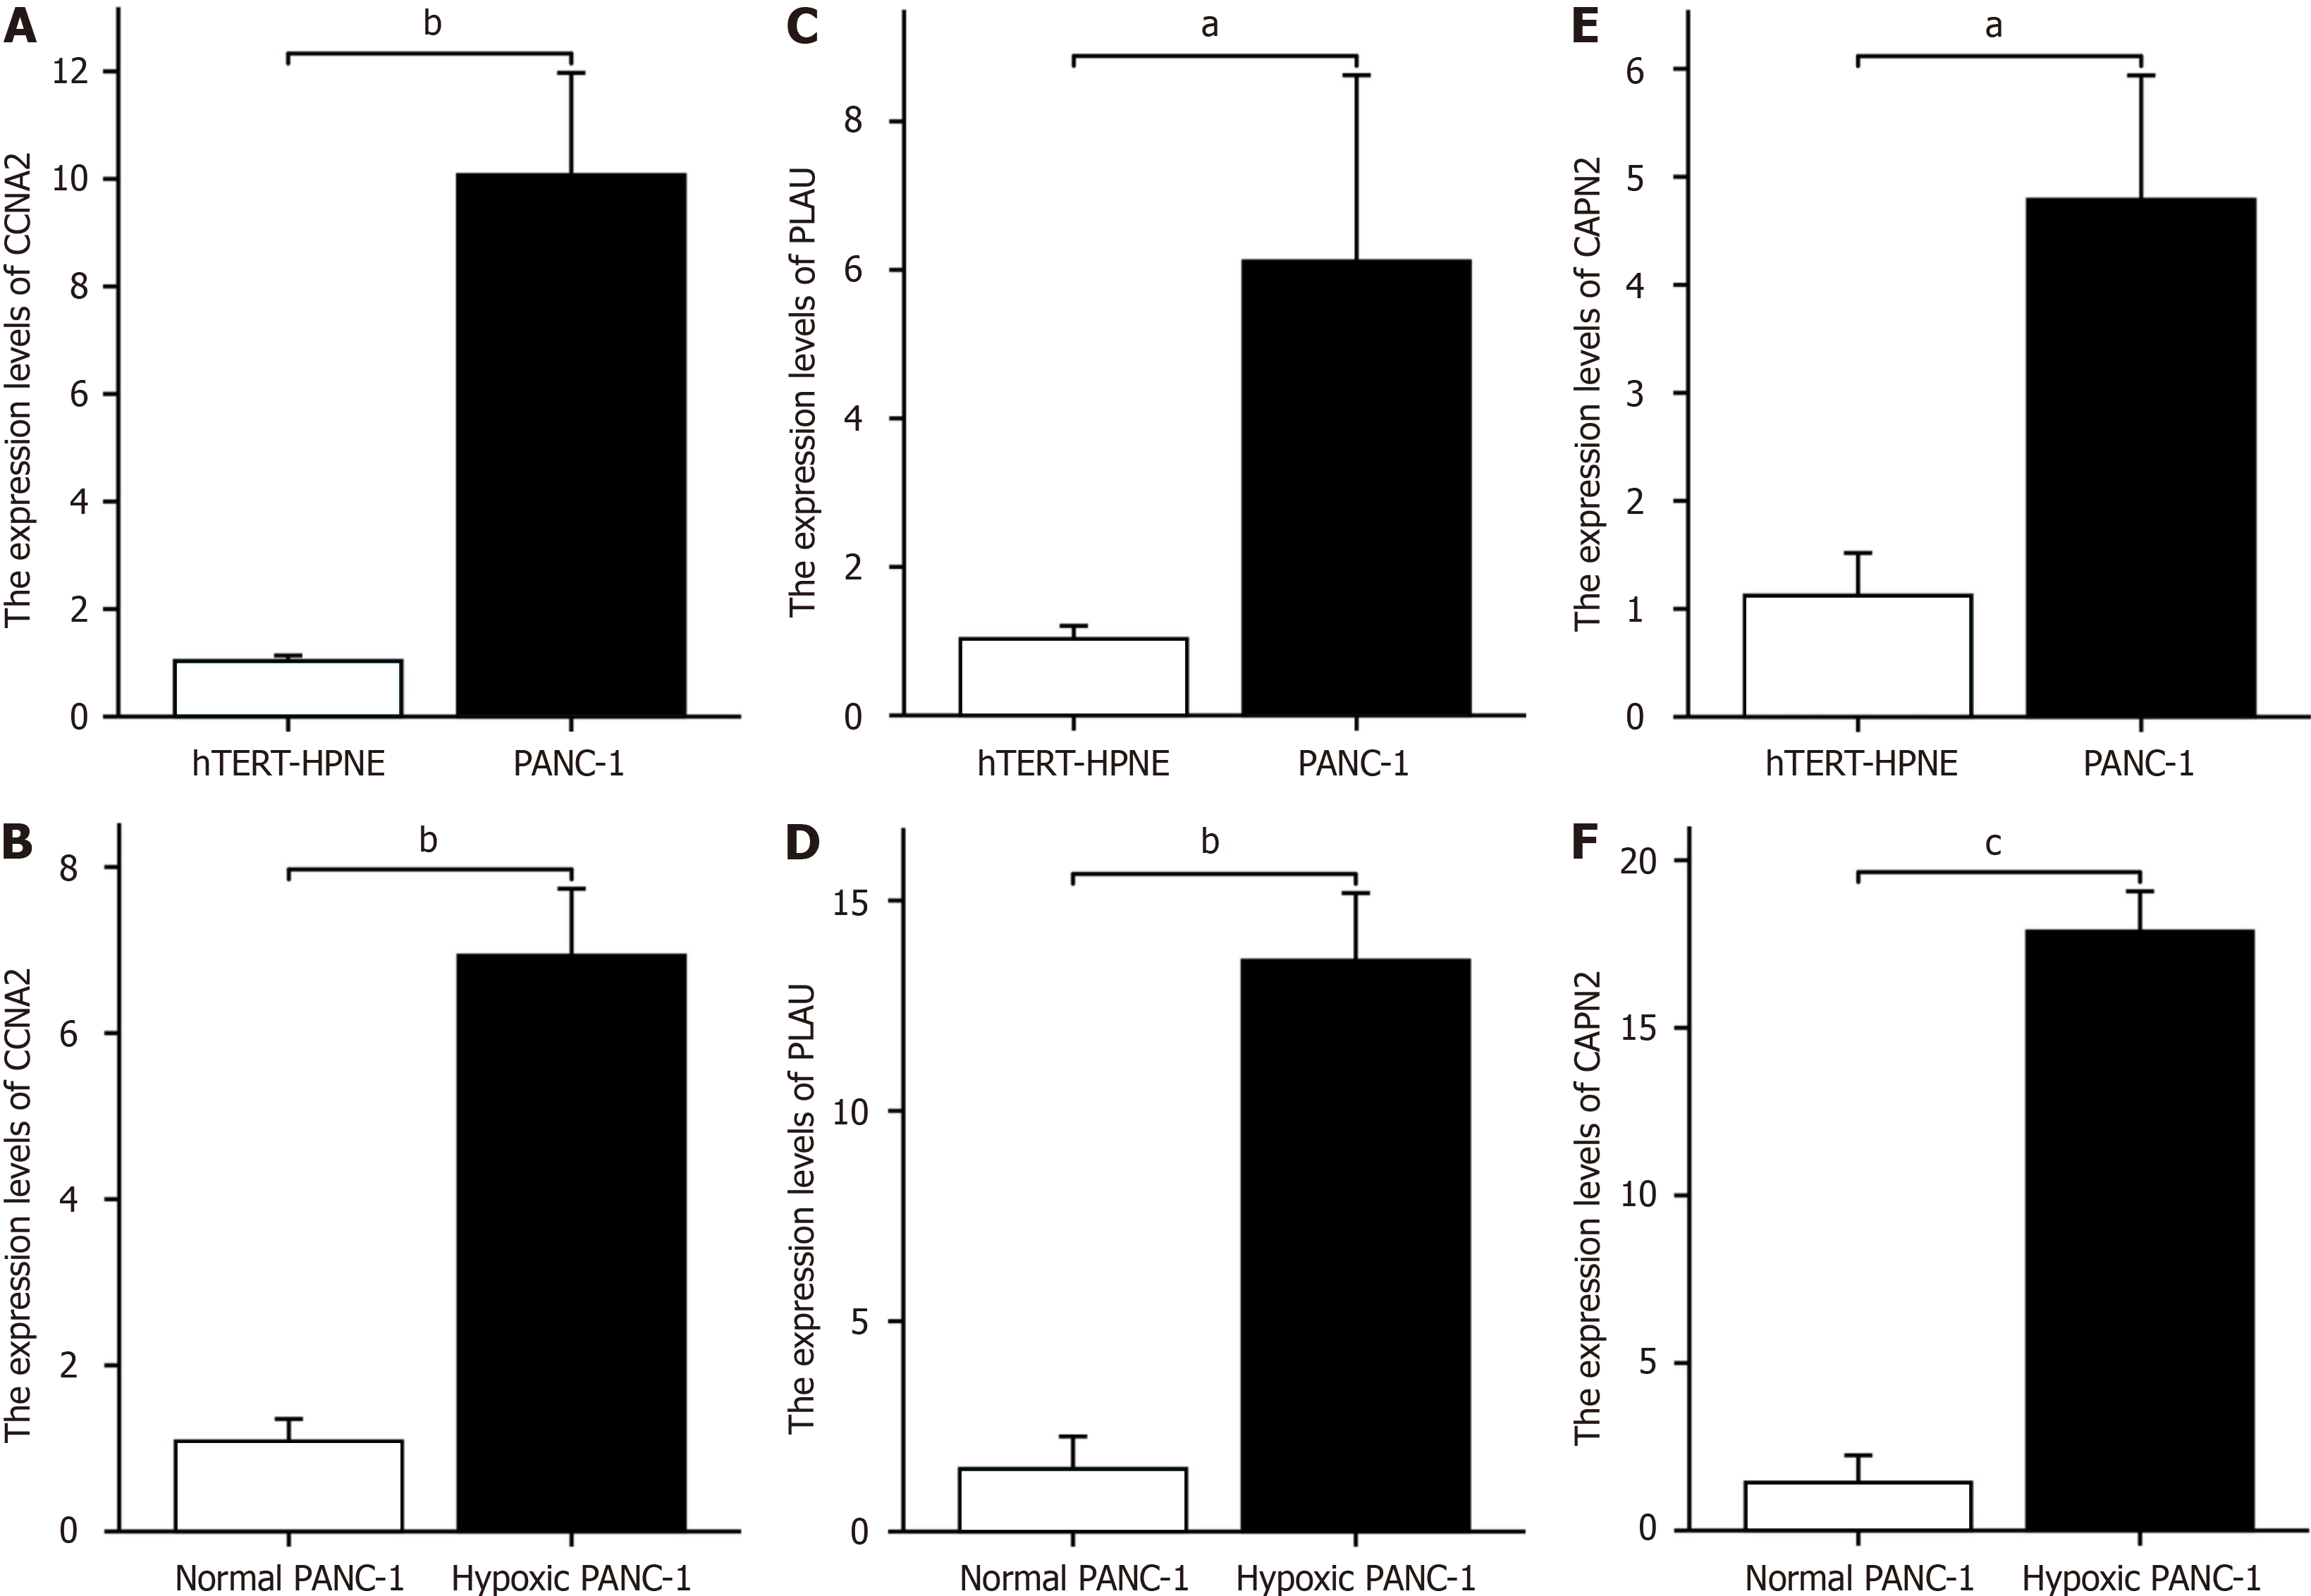
Figure 8 Hypoxia key gene expression changes in hTERT-HPNE cells, normal PANC-1 cells, and hypoxic PANC-1 cells.
A: CCNA2 expression in PANC-1 and hTERT-HPNE cells; B: CCNA2 expression in hypoxia-treated vs untreated PANC-1 cells; C: PLAU expression in PANC-1 and hTERT-HPNE cells; D: PLAU expression in hypoxia-treated vs untreated PANC-1 cells; E: CAPN2 expression in PANC-1 and hTERT-HPNE cells; F: CAPN2 expression in hypoxia-treated vs untreated PANC-1 cells. aP < 0.05, bP < 0.01, cP < 0.001.
- Citation: Yang F, Jiang N, Li XY, Qi XS, Tian ZB, Guo YJ. Construction and validation of a pancreatic cancer prognostic model based on genes related to the hypoxic tumor microenvironment. World J Gastroenterol 2024; 30(36): 4057-4070
- URL: https://www.wjgnet.com/1007-9327/full/v30/i36/4057.htm
- DOI: https://dx.doi.org/10.3748/wjg.v30.i36.4057


