Copyright
©The Author(s) 2024.
World J Gastroenterol. Apr 28, 2024; 30(16): 2233-2248
Published online Apr 28, 2024. doi: 10.3748/wjg.v30.i16.2233
Published online Apr 28, 2024. doi: 10.3748/wjg.v30.i16.2233
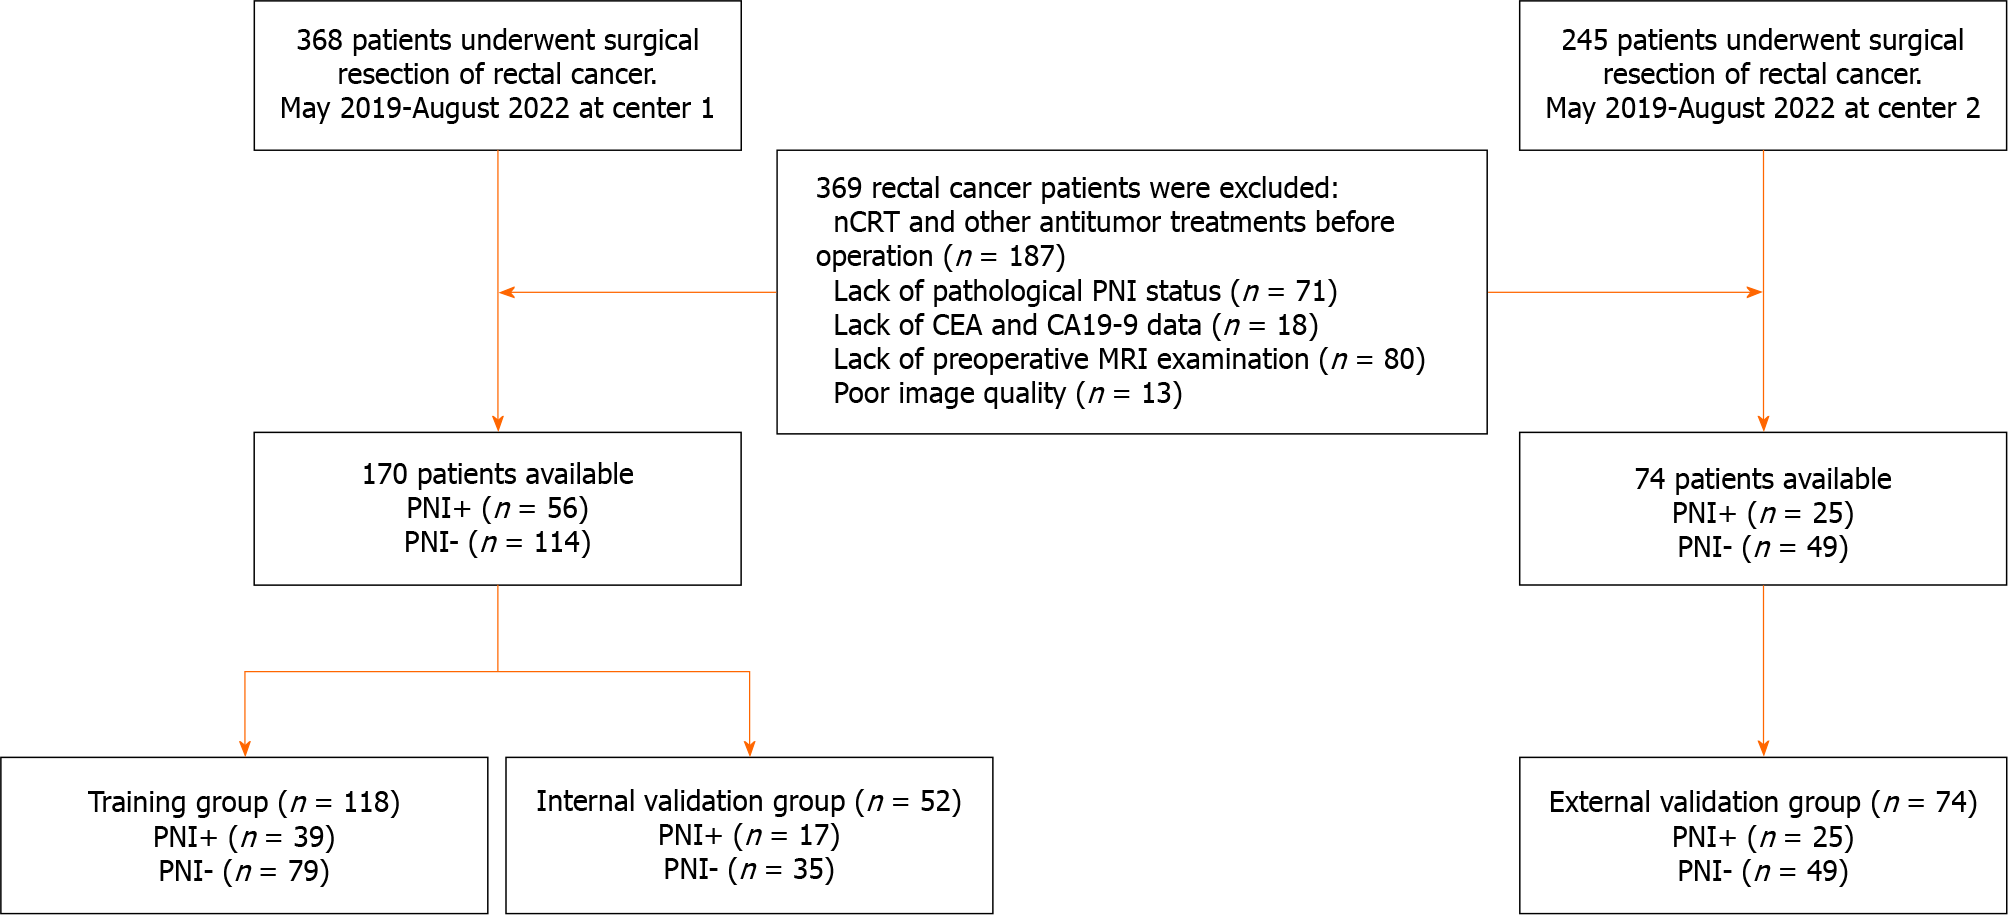
Figure 1 Flowchart of participant selection.
nCRT: Neoadjuvant chemoradiotherapy; CEA: Carcinoembryonic antigen; CA19-9: Carbohydrate antigen 19-9; MRI: Magnetic resonance imaging; PNI: Perineural invasion.
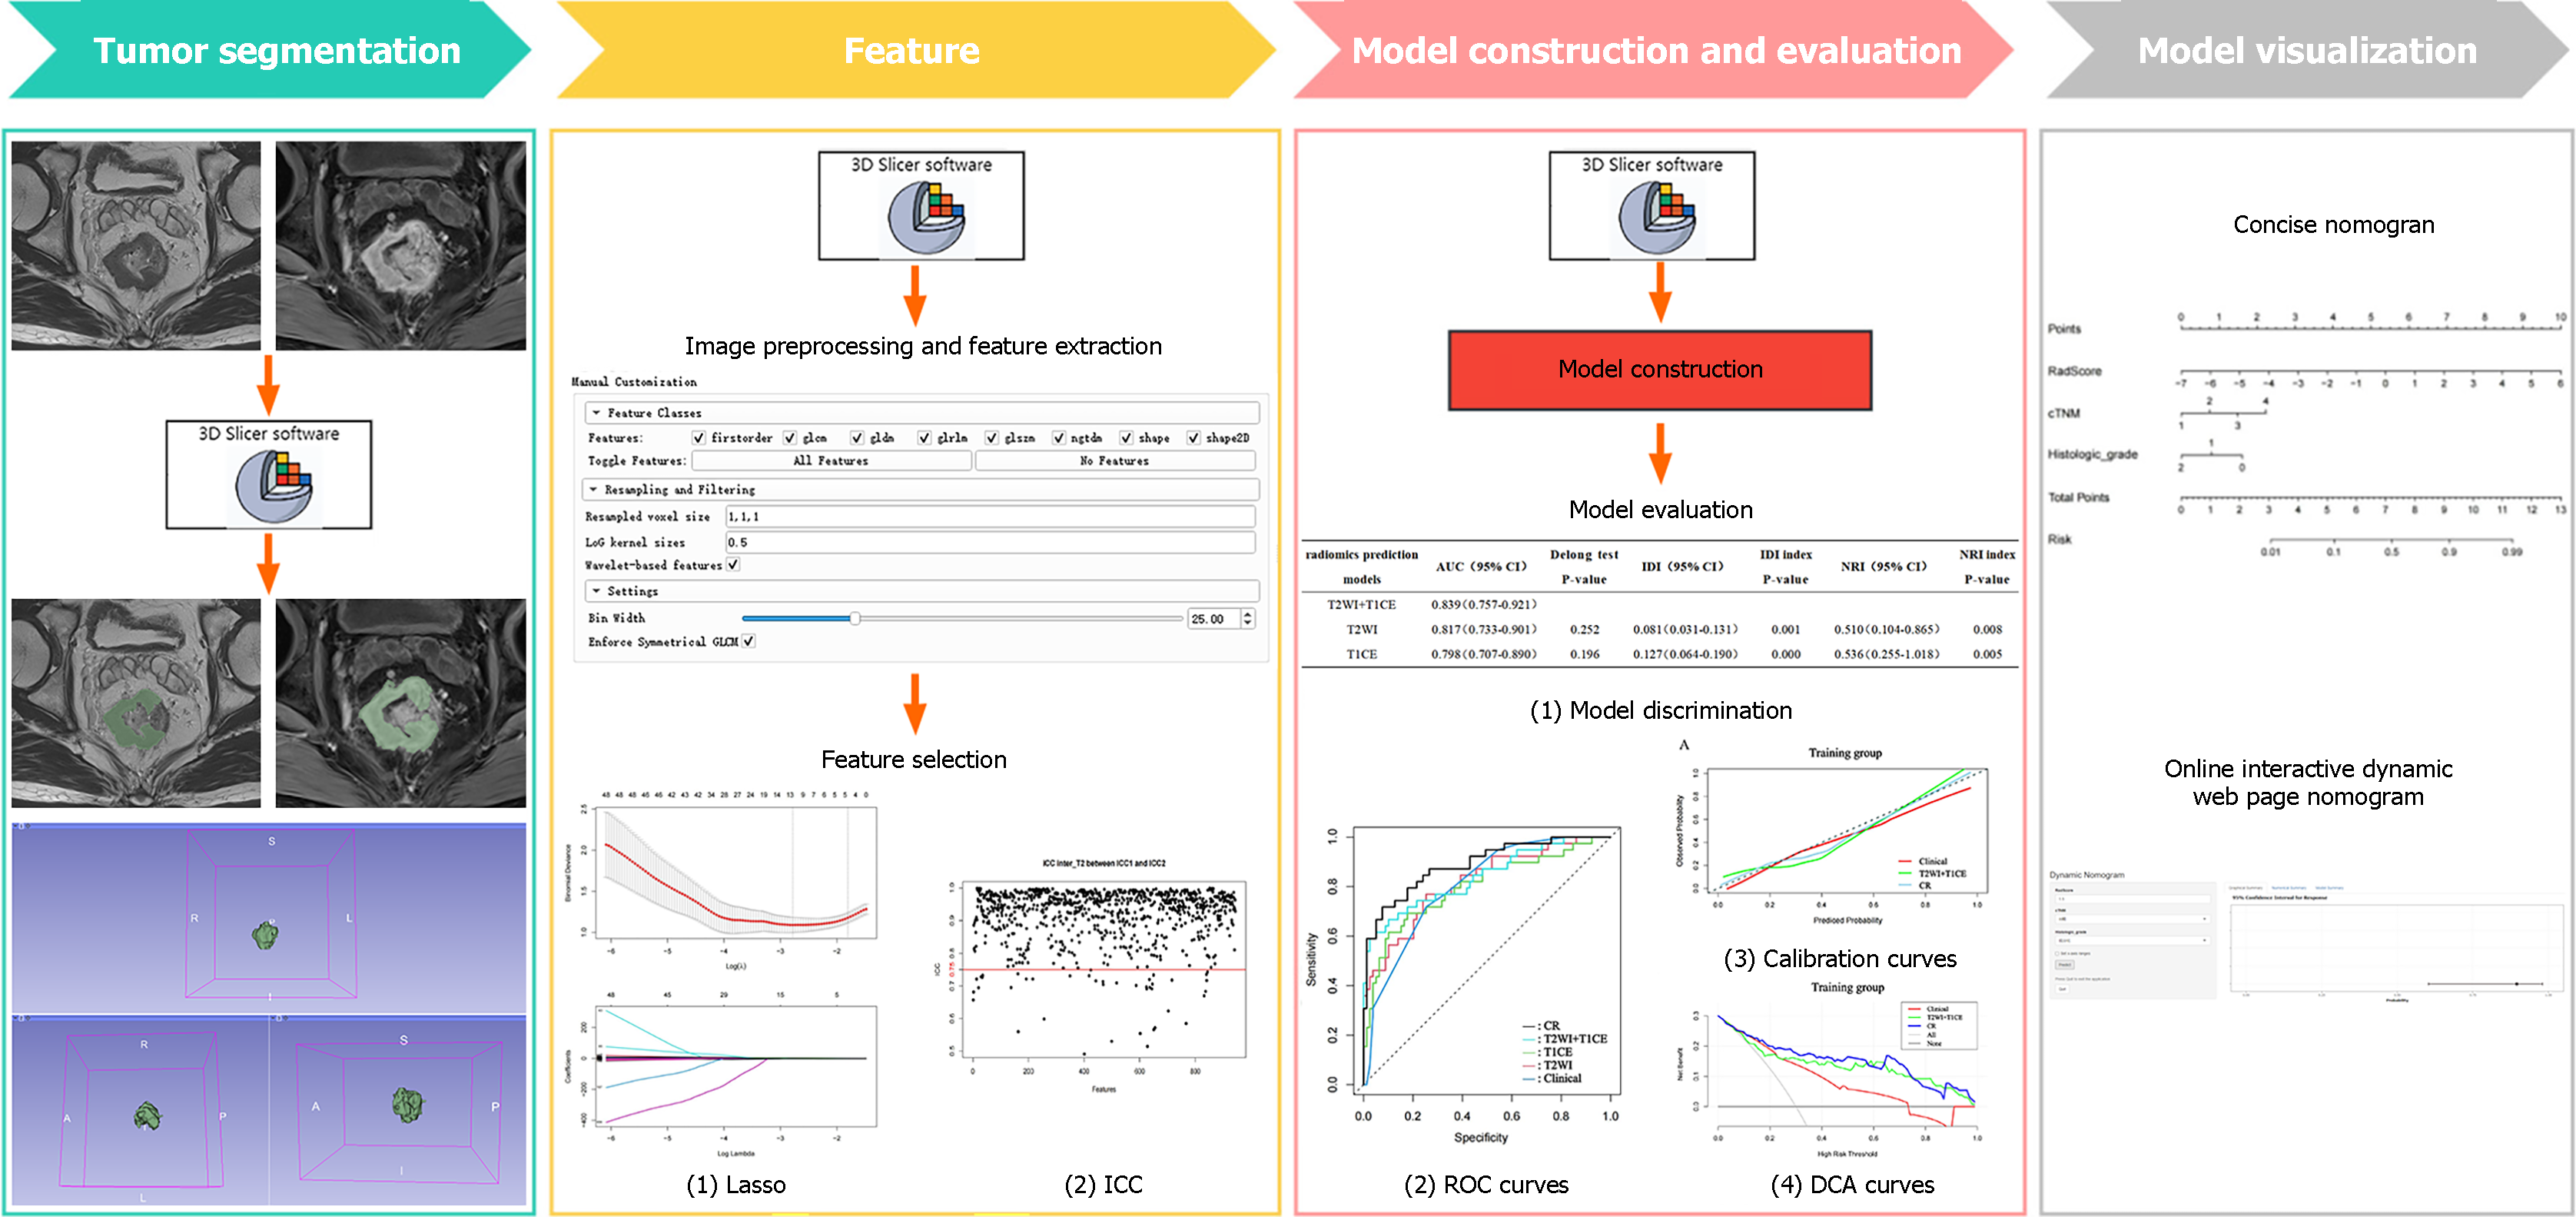
Figure 2 Radiomics workflow.
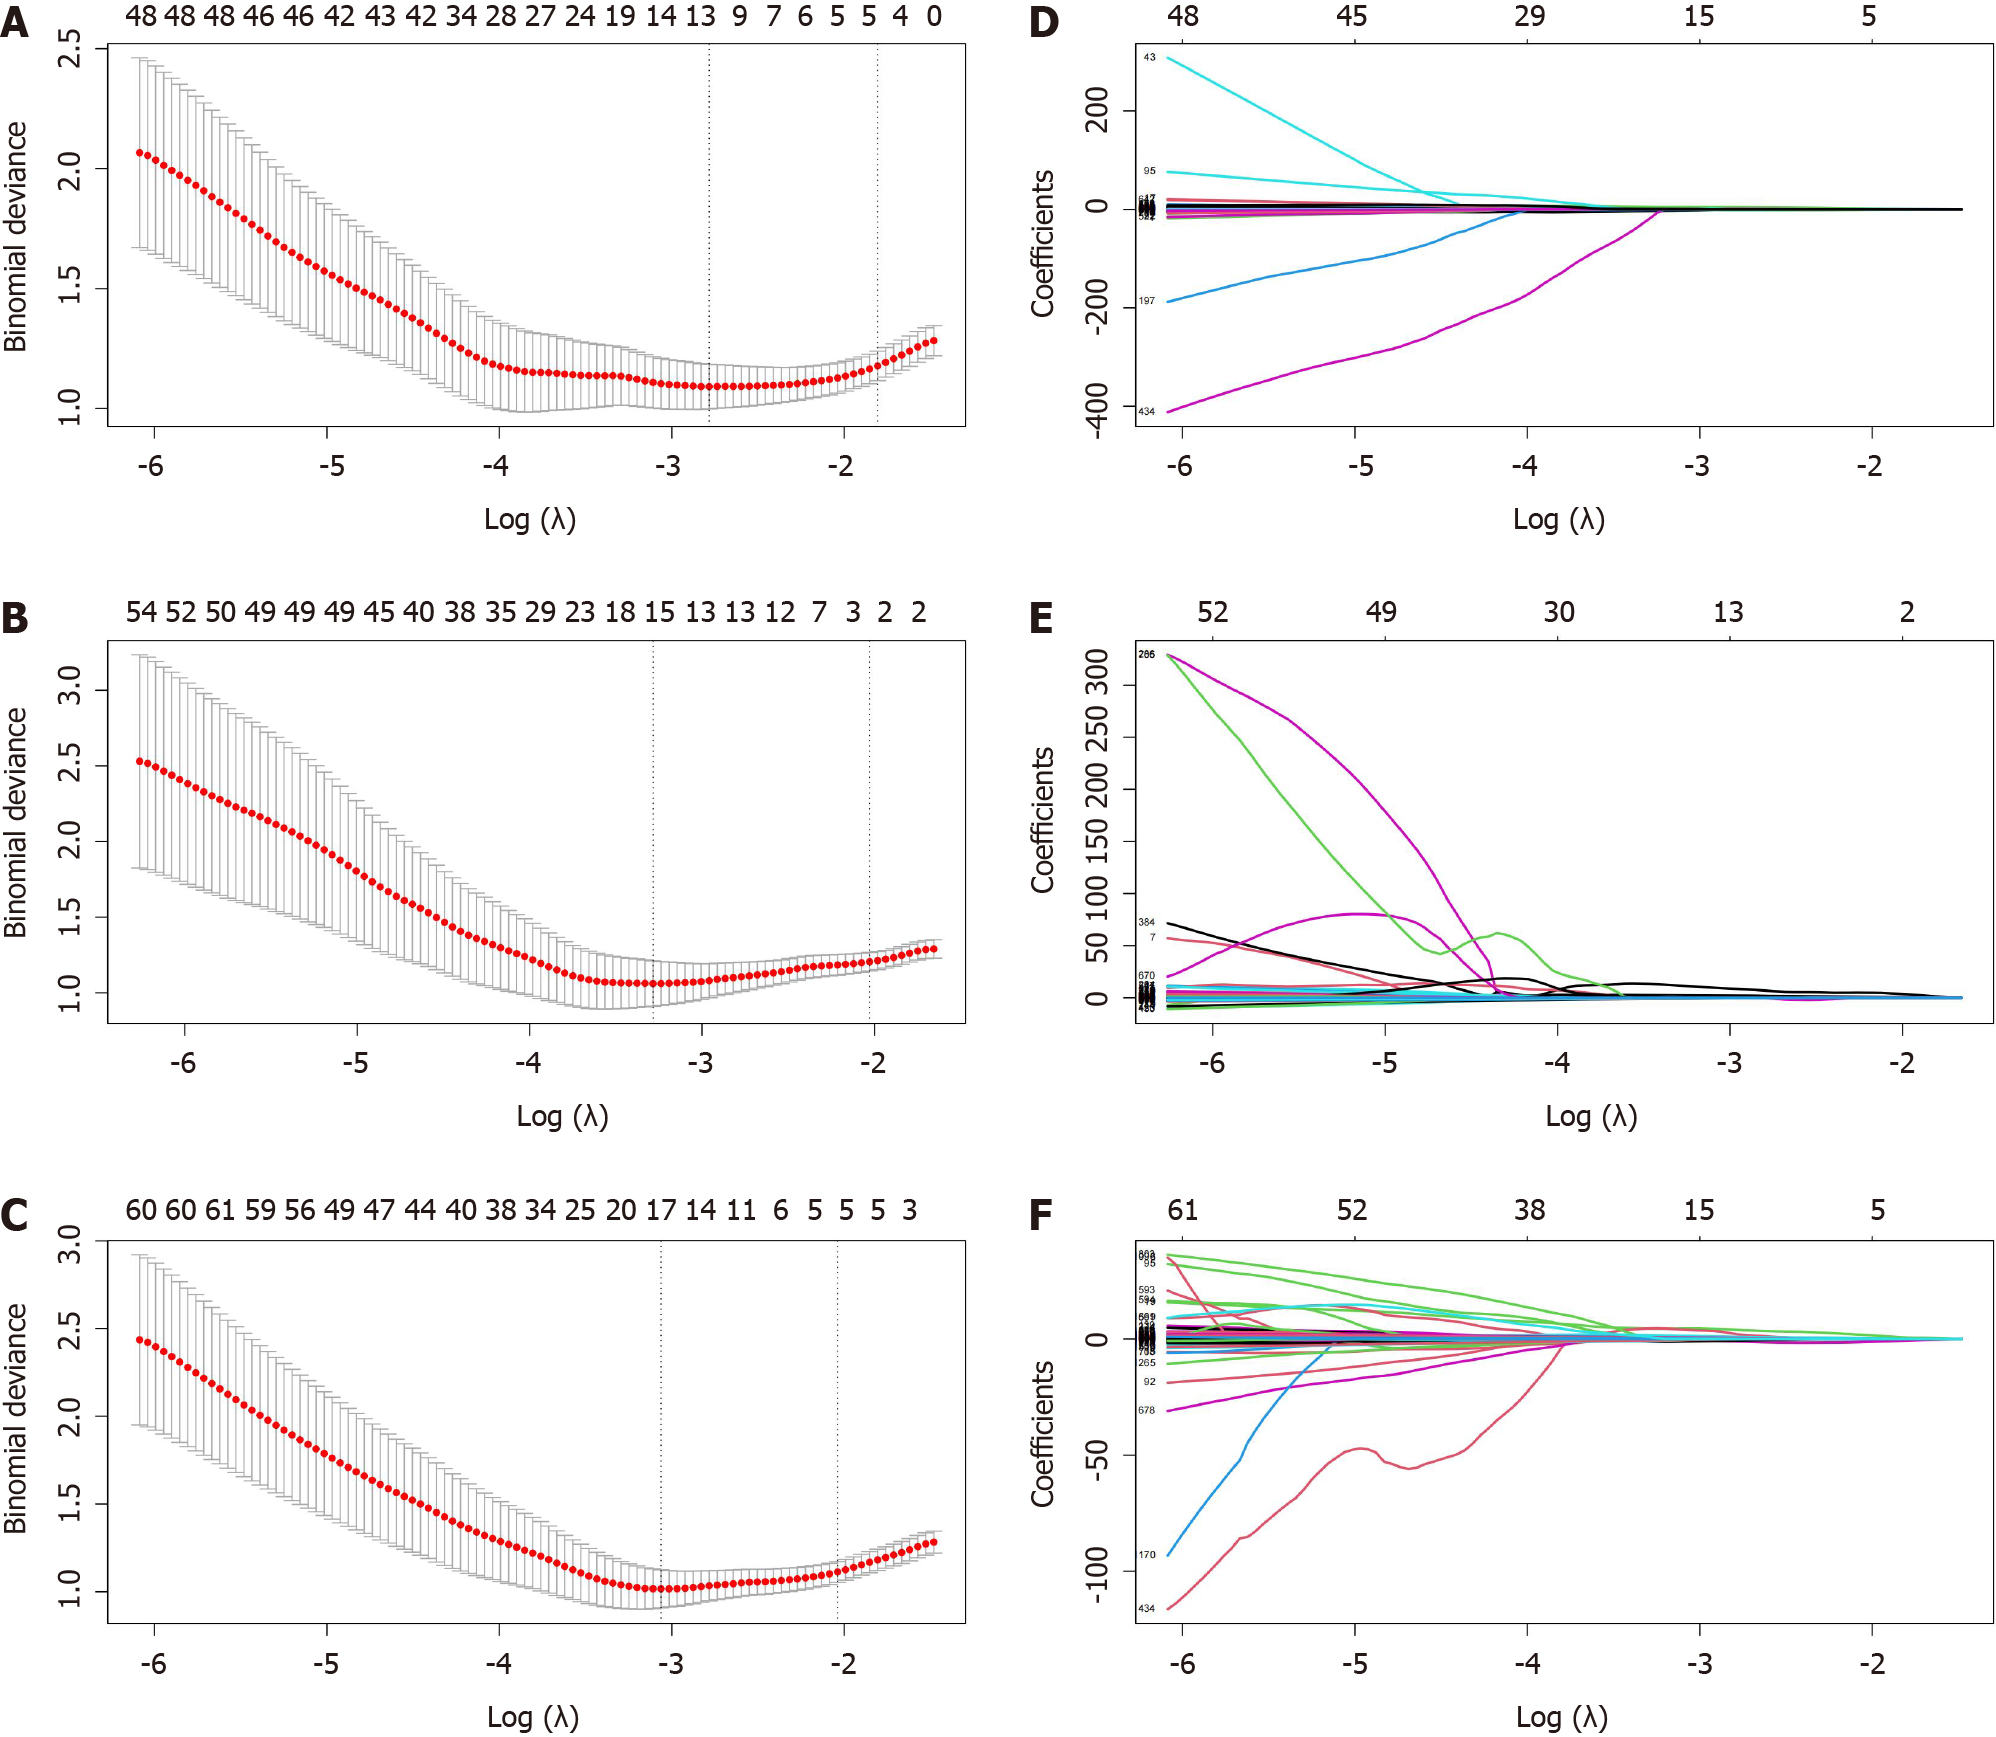
Figure 3 The process of feature selection and dimensionality reduction through least absolute shrinkage and selection operator.
A-C: The process of 10-fold crossvalidation penalty parameter λ selection, according to the rule of the simplest model. The abscissa corresponding to the lowest point of model deviation is the optimal λ; D-F: Each colored line in the variation curve of the characteristic coefficient with value of λ, which was used to determine the non-zero coefficient characteristic parameters based on λ obtained in the upper panel of the figure. T2WI: T2-weighted imaging; T1CE: contrast-enhanced T1WI.
Figure 4 Receiver operating characteristic curves for perineural invasion prediction of different models.
A: Receiver operating characteristic (ROC) curves in the training group; B: ROC curves in the internal validation group; C: ROC curves in the external validation group. CR: Clinical-radiomics predictive model; T2WI: T2-weighted imaging; T1CE: Contrast-enhanced T1WI.
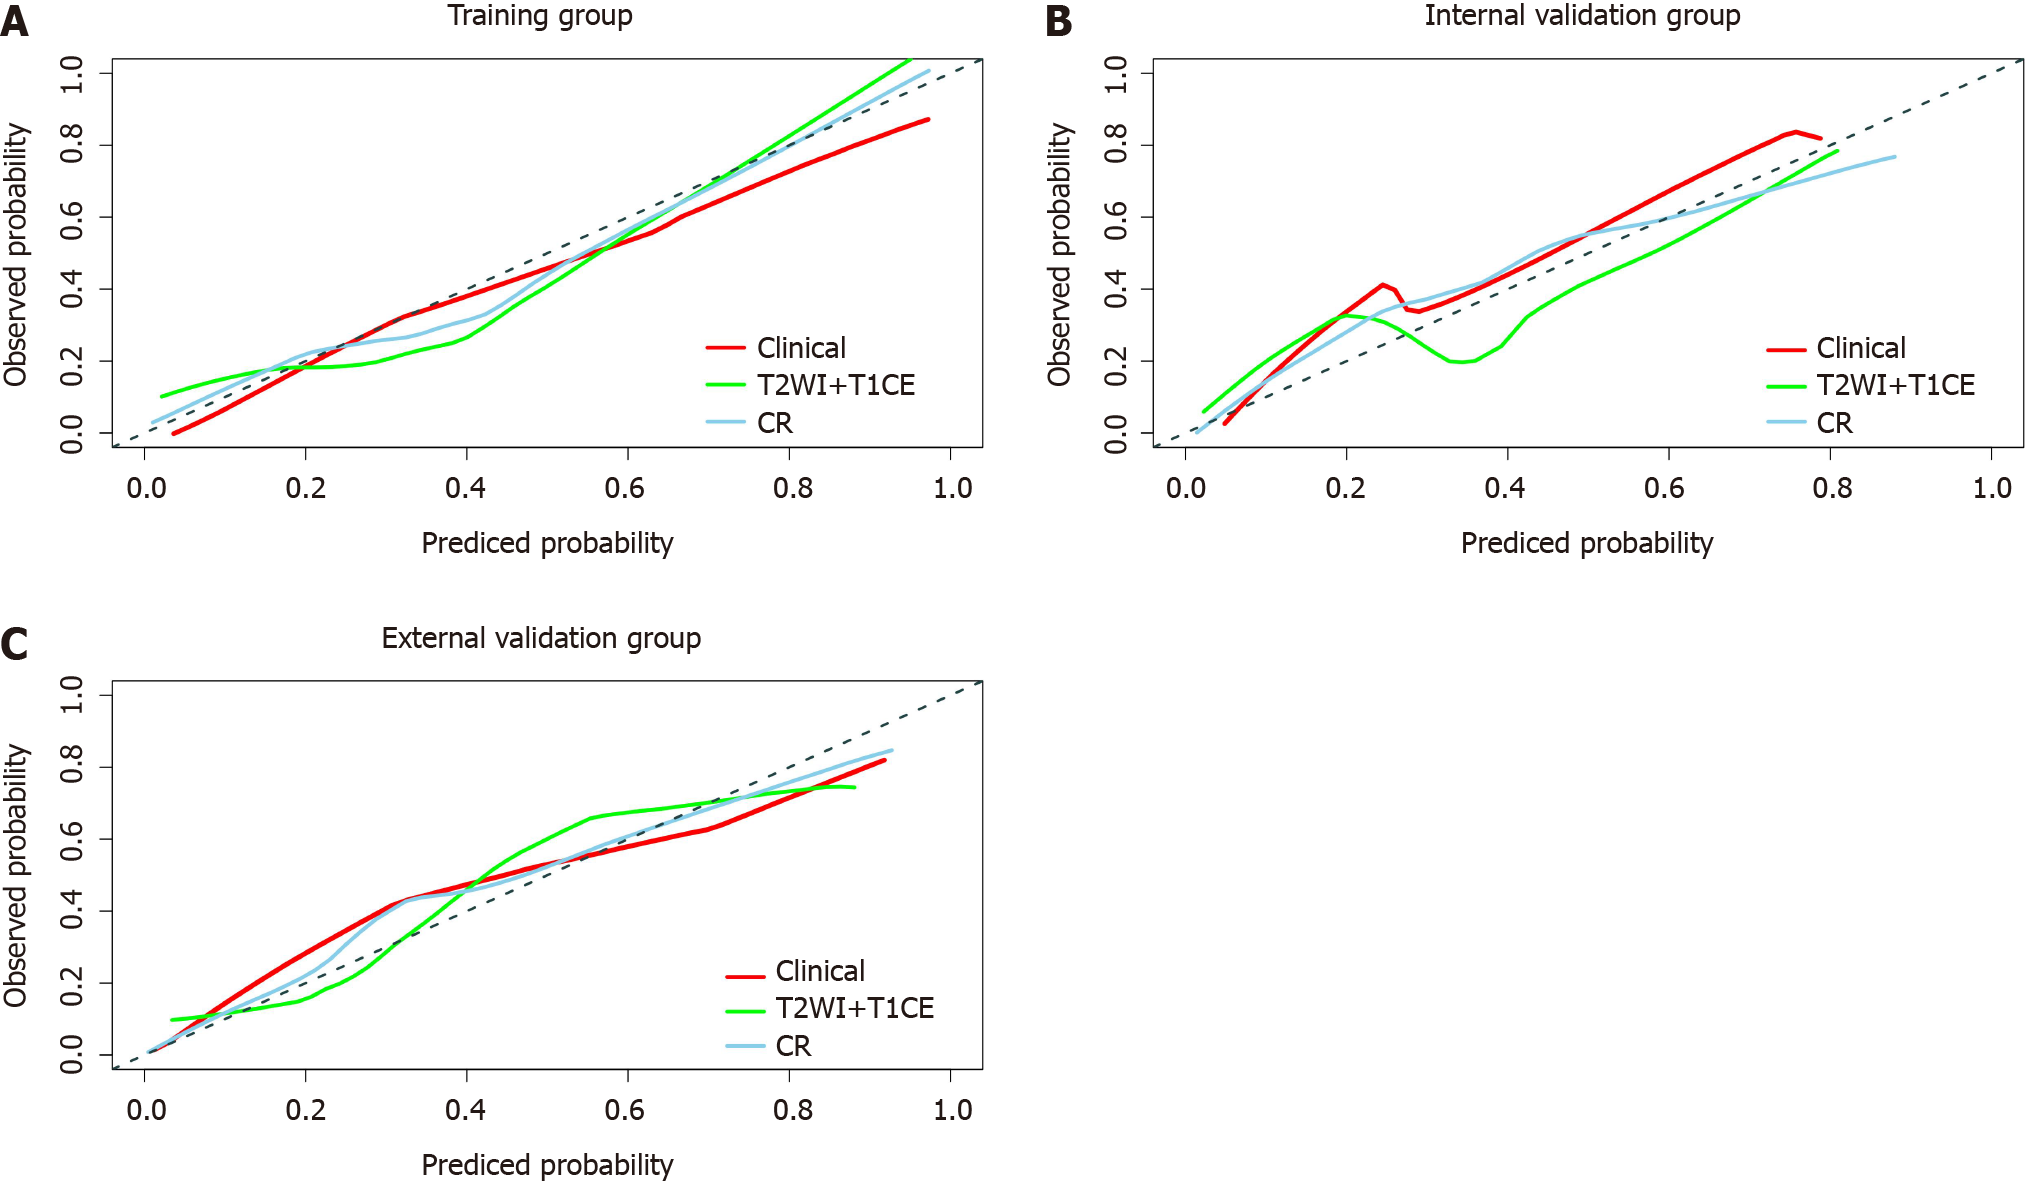
Figure 5 Calibration curves of the clinical model, T2-weighted imaging + Contrast-enhanced T1WI fusion sequence radiomics model and clinical-radiomics prediction model.
Diagonal lines serve as reference lines, representing the most suitable model. The clinical-radiomics prediction model shows optimal calibration. A: Calibration curves in the training group; B: Calibration curves in the internal validation group; C: Calibration curves in the external validation group. CR: Clinical-radiomics prediction model; T2WI: T2-weighted imaging; T1CE: Contrast-enhanced T1WI.
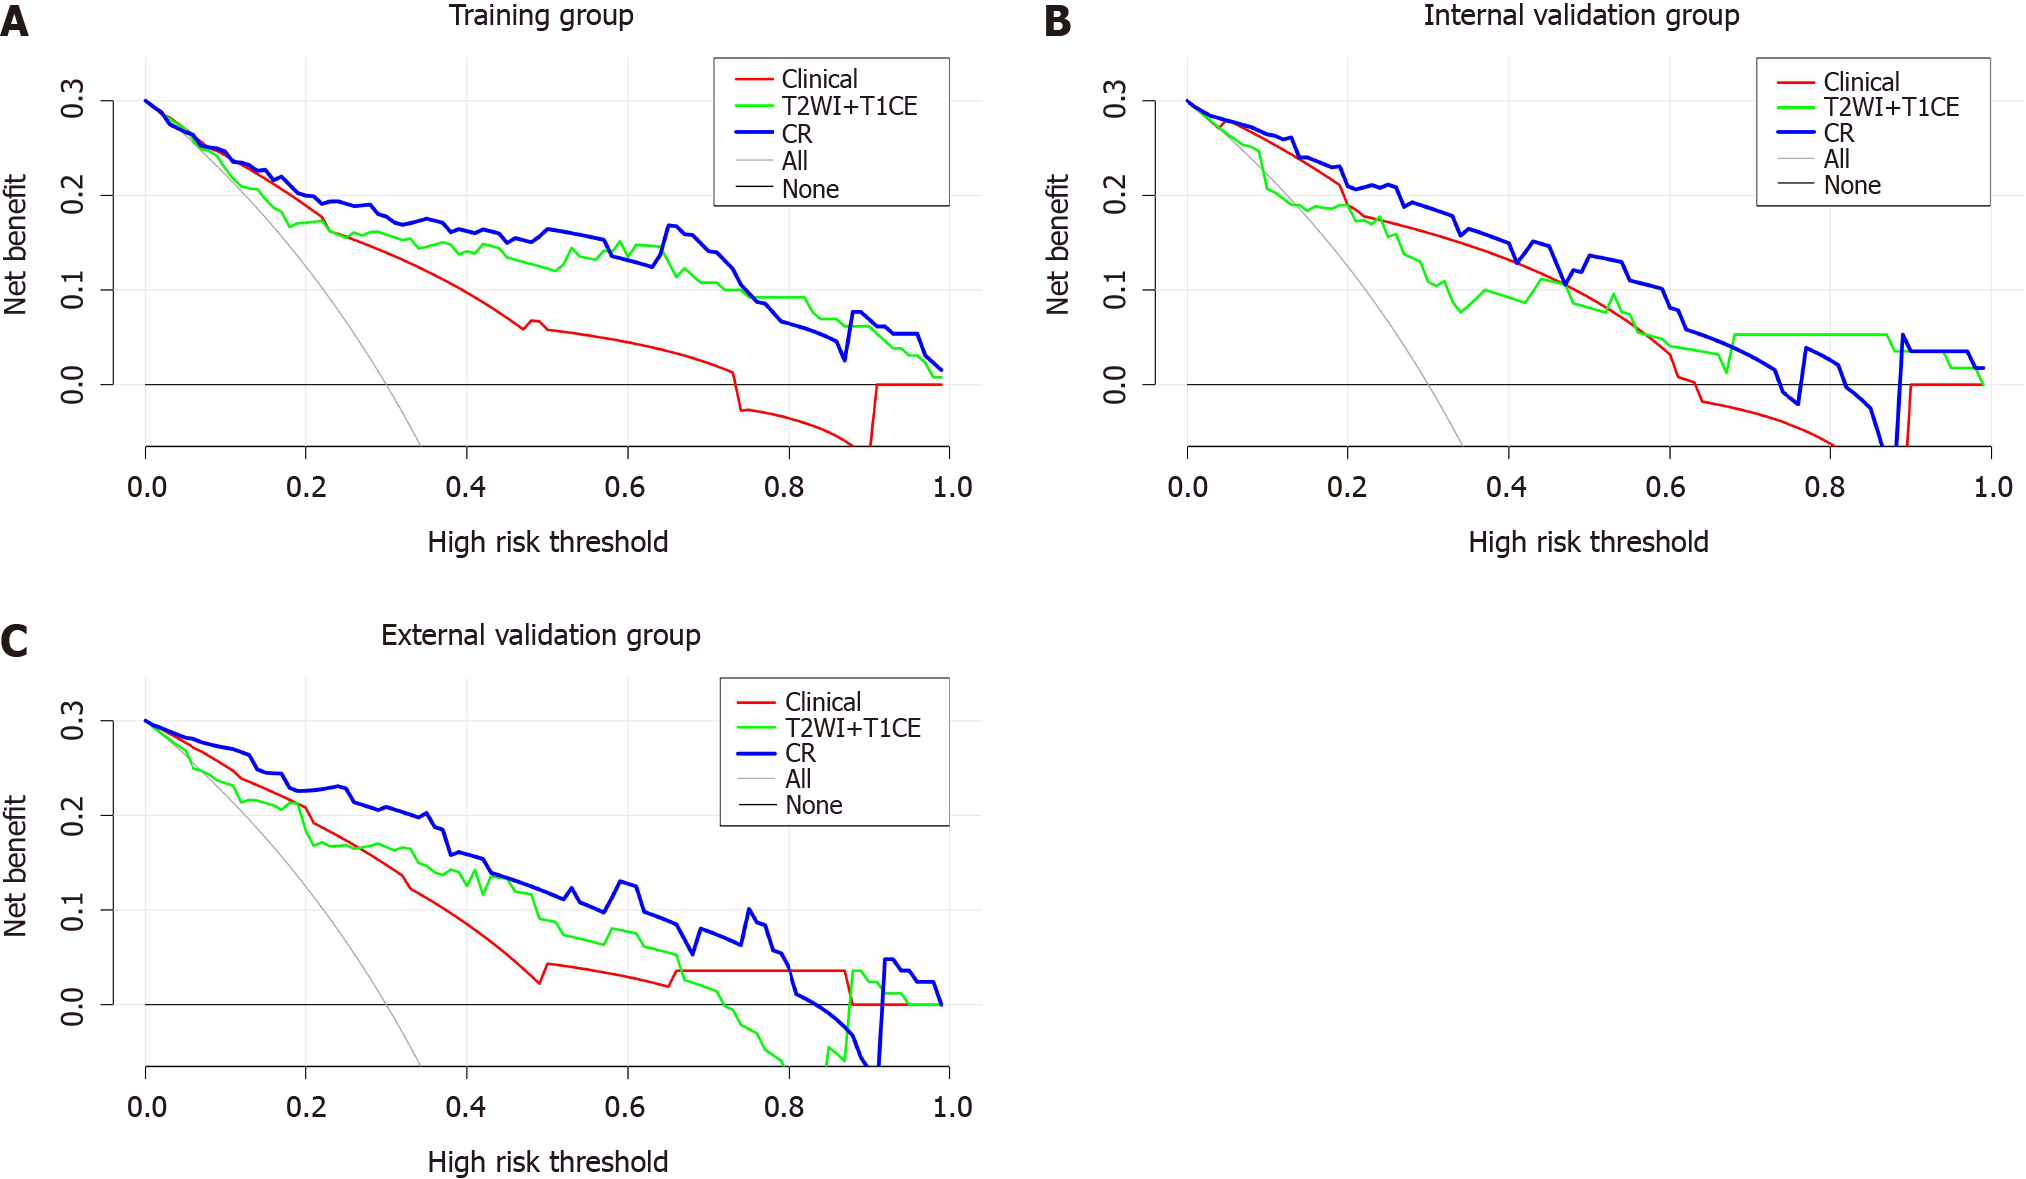
Figure 6 Decision curve analysis of the clinical model, T2-weighted imaging + contrast-enhanced T1WI fusion sequence radiomics model and clinical-radiomics prediction model.
The clinical-radiomics prediction model exhibits the greatest net clinical benefit. A: Decision curve analysis (DCA) in the training group; B: DCA in the internal validation group; C: DCA in the external validation group. CR: Clinical-radiomics prediction model; T2WI: T2-weighted imaging; T1CE: Contrast-enhanced T1WI.
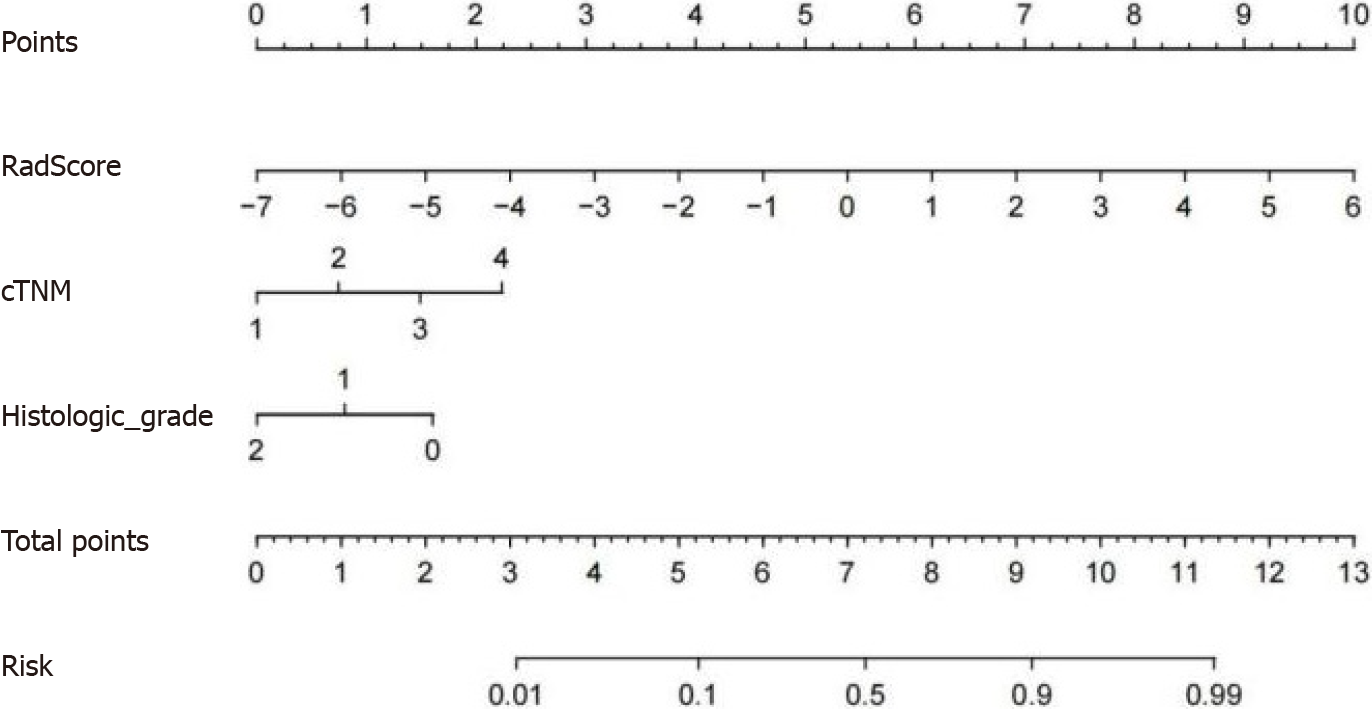
Figure 7 Concise nomogram was developed in the training group.
cTNM: clinical TNM.
Figure 8 Online interactive dynamic web page nomogram based on the clinical-radiomics model was constructed to predict the perineural invasion status of patients.
The Online tool is available at https://ly1070007554.shinyapps.io/dynnomapp/.
- Citation: Liu Y, Sun BJT, Zhang C, Li B, Yu XX, Du Y. Preoperative prediction of perineural invasion of rectal cancer based on a magnetic resonance imaging radiomics model: A dual-center study. World J Gastroenterol 2024; 30(16): 2233-2248
- URL: https://www.wjgnet.com/1007-9327/full/v30/i16/2233.htm
- DOI: https://dx.doi.org/10.3748/wjg.v30.i16.2233


