Copyright
©The Author(s) 2024.
World J Gastroenterol. Mar 14, 2024; 30(10): 1450-1460
Published online Mar 14, 2024. doi: 10.3748/wjg.v30.i10.1450
Published online Mar 14, 2024. doi: 10.3748/wjg.v30.i10.1450
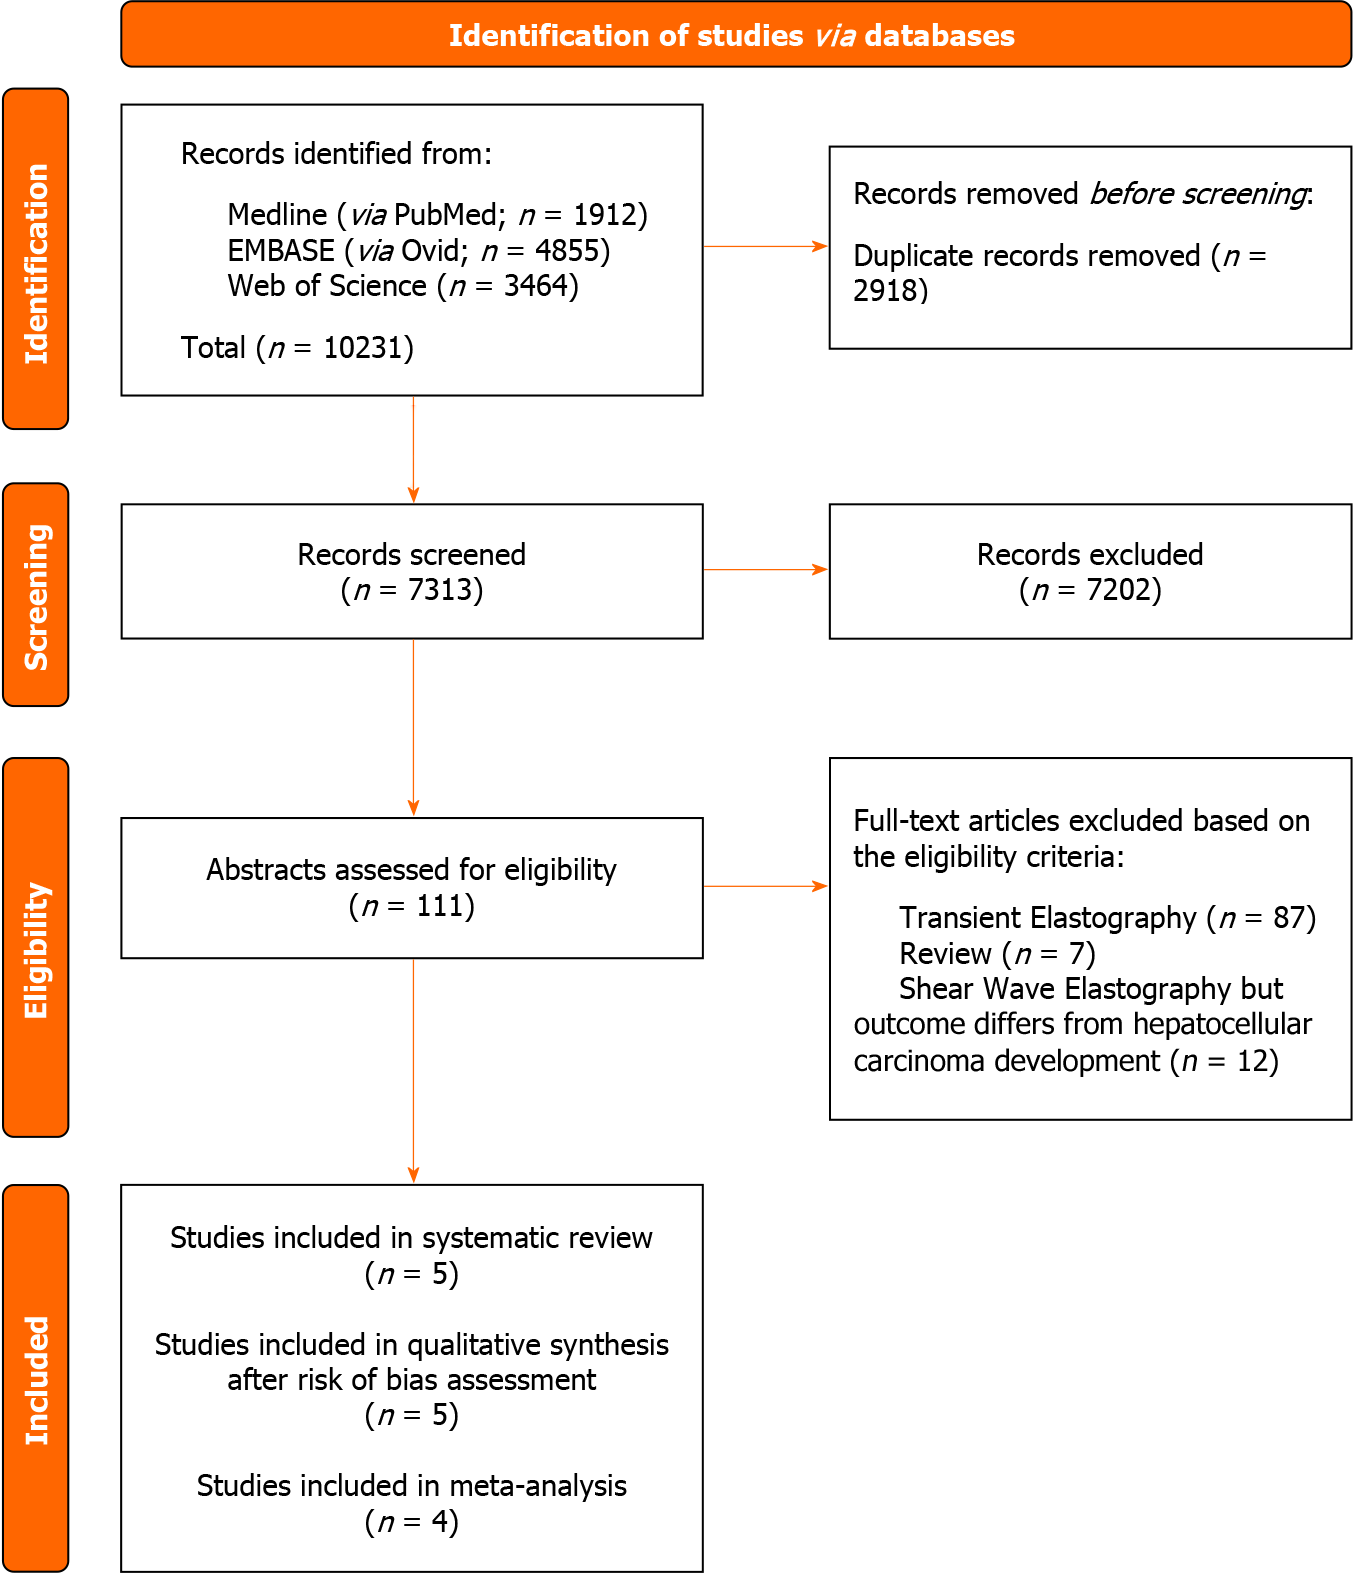
Figure 1 PRISMA study selection flow diagram.
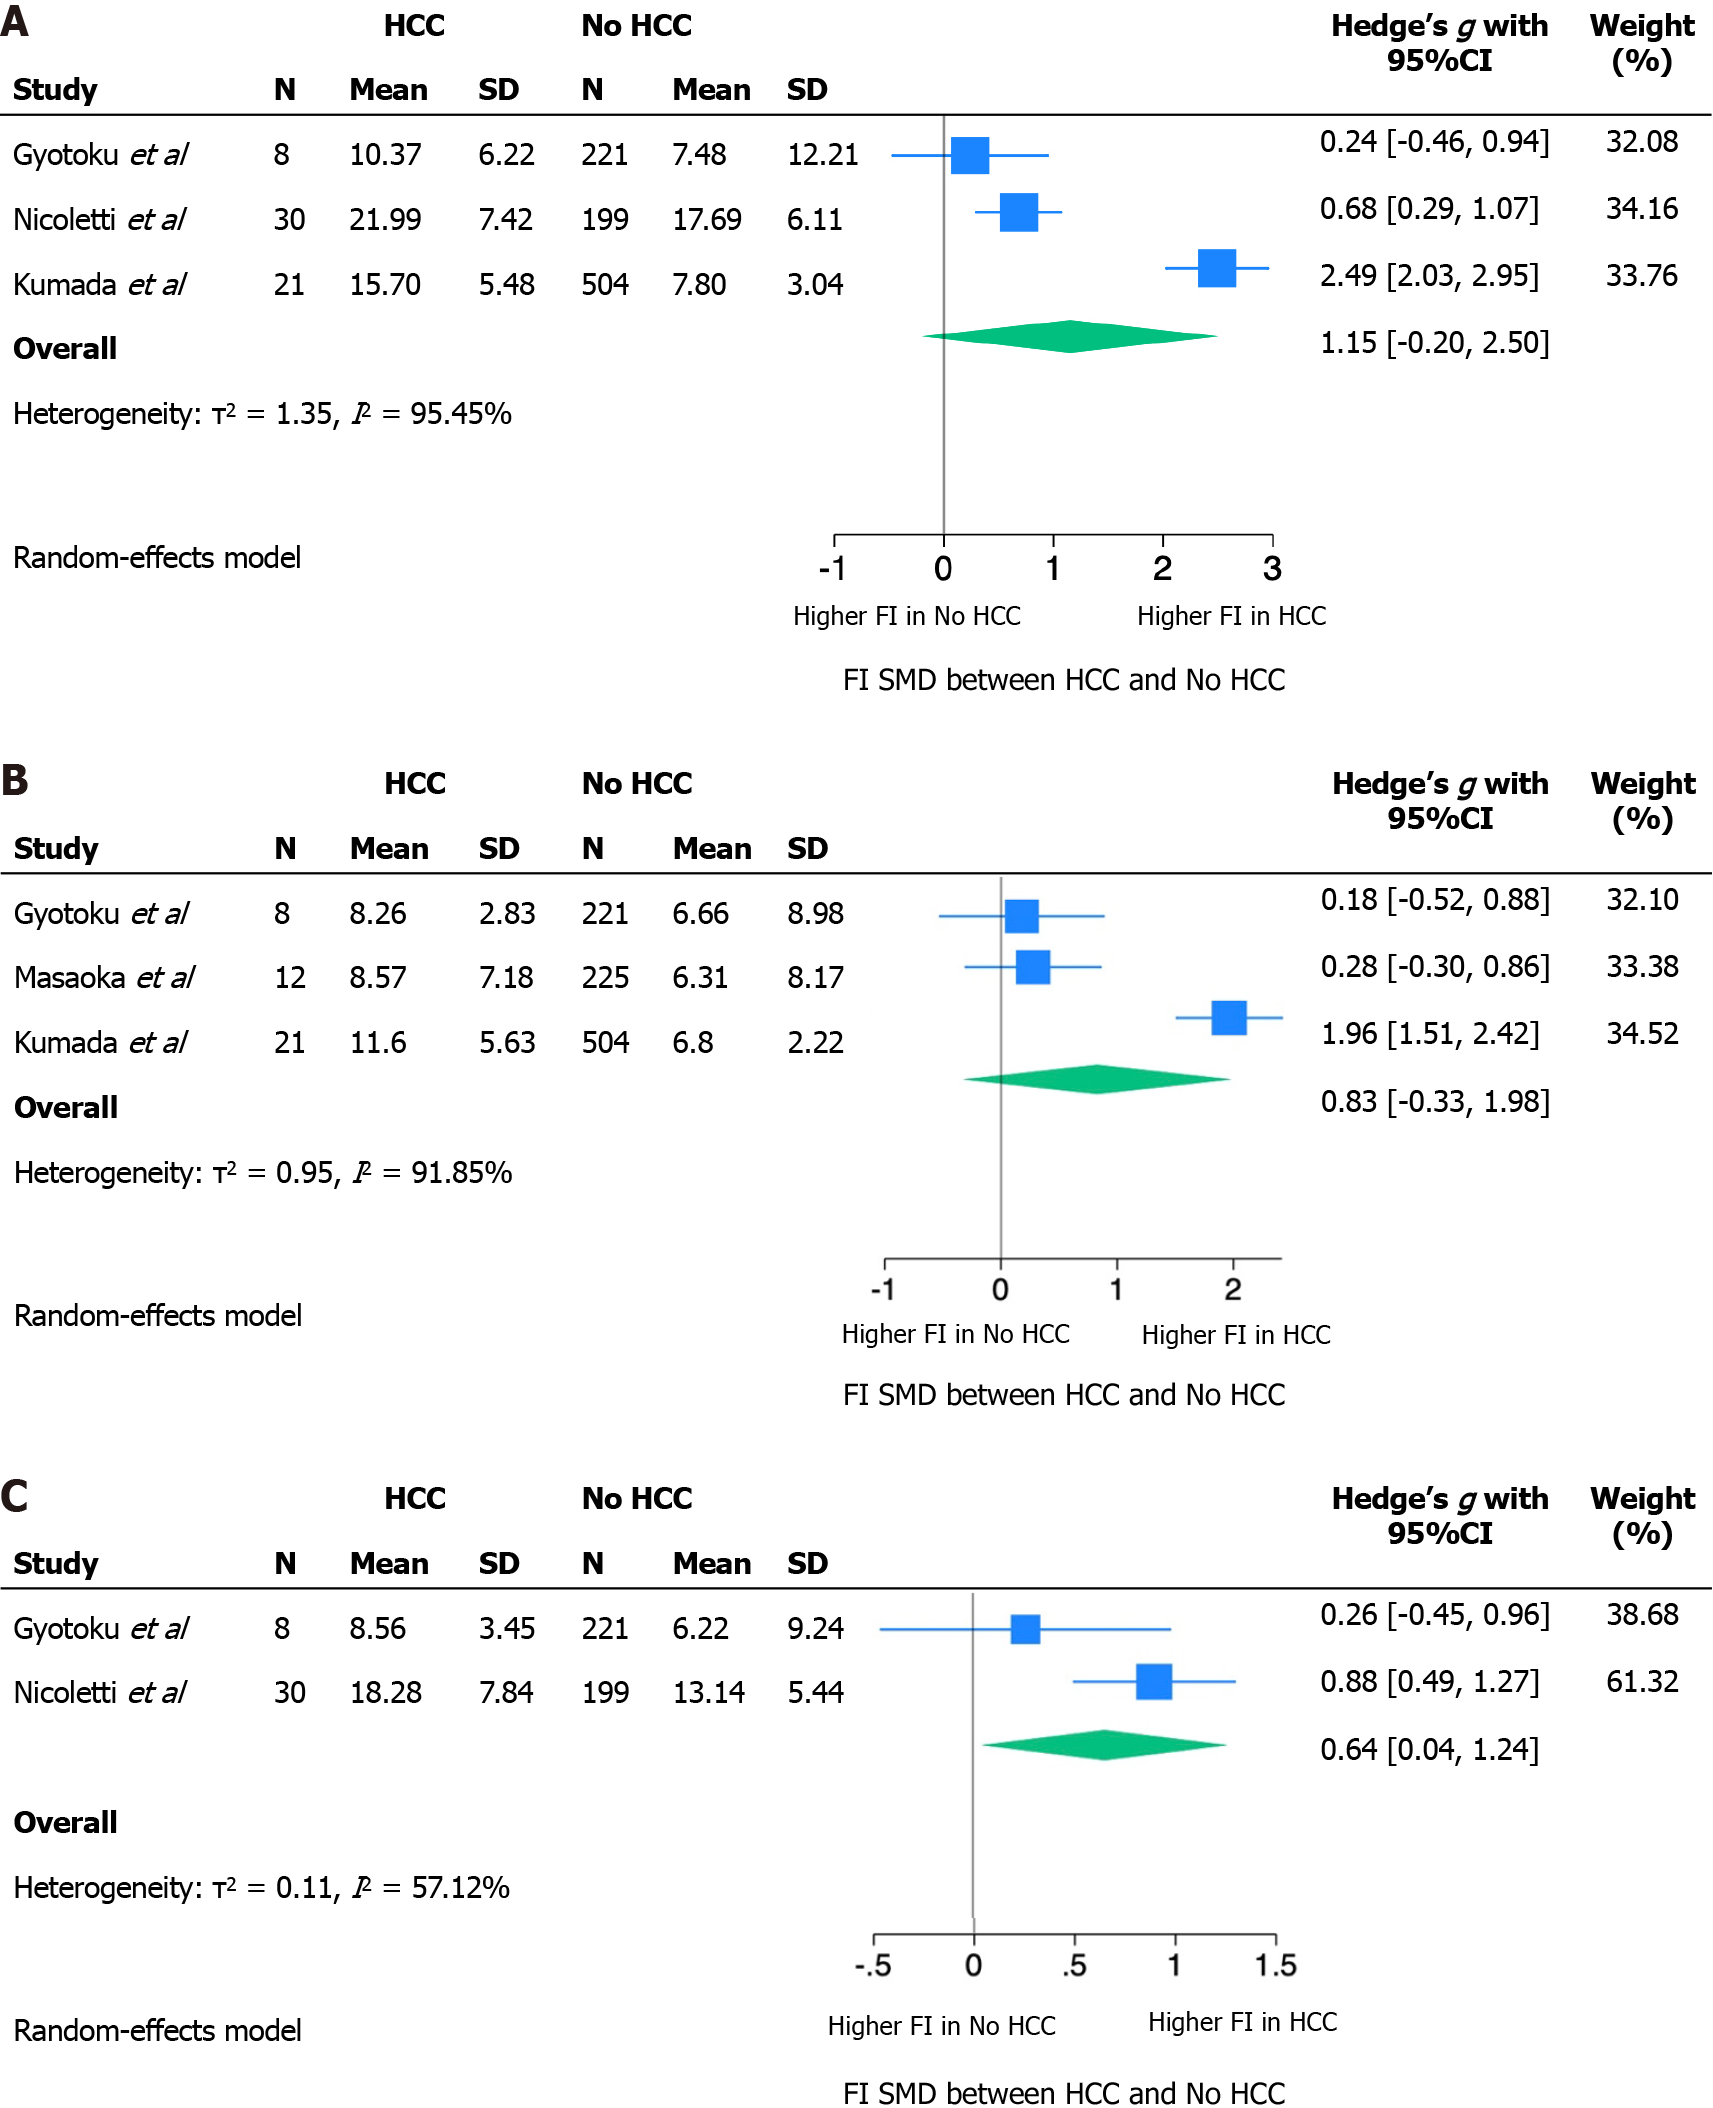
Figure 2 Standardized mean difference of liver stiffness.
A: Standardized mean difference (SMD) of liver stiffness (LS) at baseline in patients who did or did not develop hepatocellular carcinoma (HCC) during follow-up; B: SMD of LS at 12 wk after sustained virological response (SVR) in patients who did or did not develop HCC during follow-up; C: SMD of LS at 24 wk after SVR in patients who did or did not develop HCC during follow-up. 95%CI: 95% Confidence interval.
- Citation: Esposto G, Santini P, Galasso L, Mignini I, Ainora ME, Gasbarrini A, Zocco MA. Shear-wave elastography to predict hepatocellular carcinoma after hepatitis C virus eradication: A systematic review and meta-analysis. World J Gastroenterol 2024; 30(10): 1450-1460
- URL: https://www.wjgnet.com/1007-9327/full/v30/i10/1450.htm
- DOI: https://dx.doi.org/10.3748/wjg.v30.i10.1450


