Copyright
©The Author(s) 2023.
World J Gastroenterol. Oct 7, 2023; 29(37): 5339-5360
Published online Oct 7, 2023. doi: 10.3748/wjg.v29.i37.5339
Published online Oct 7, 2023. doi: 10.3748/wjg.v29.i37.5339
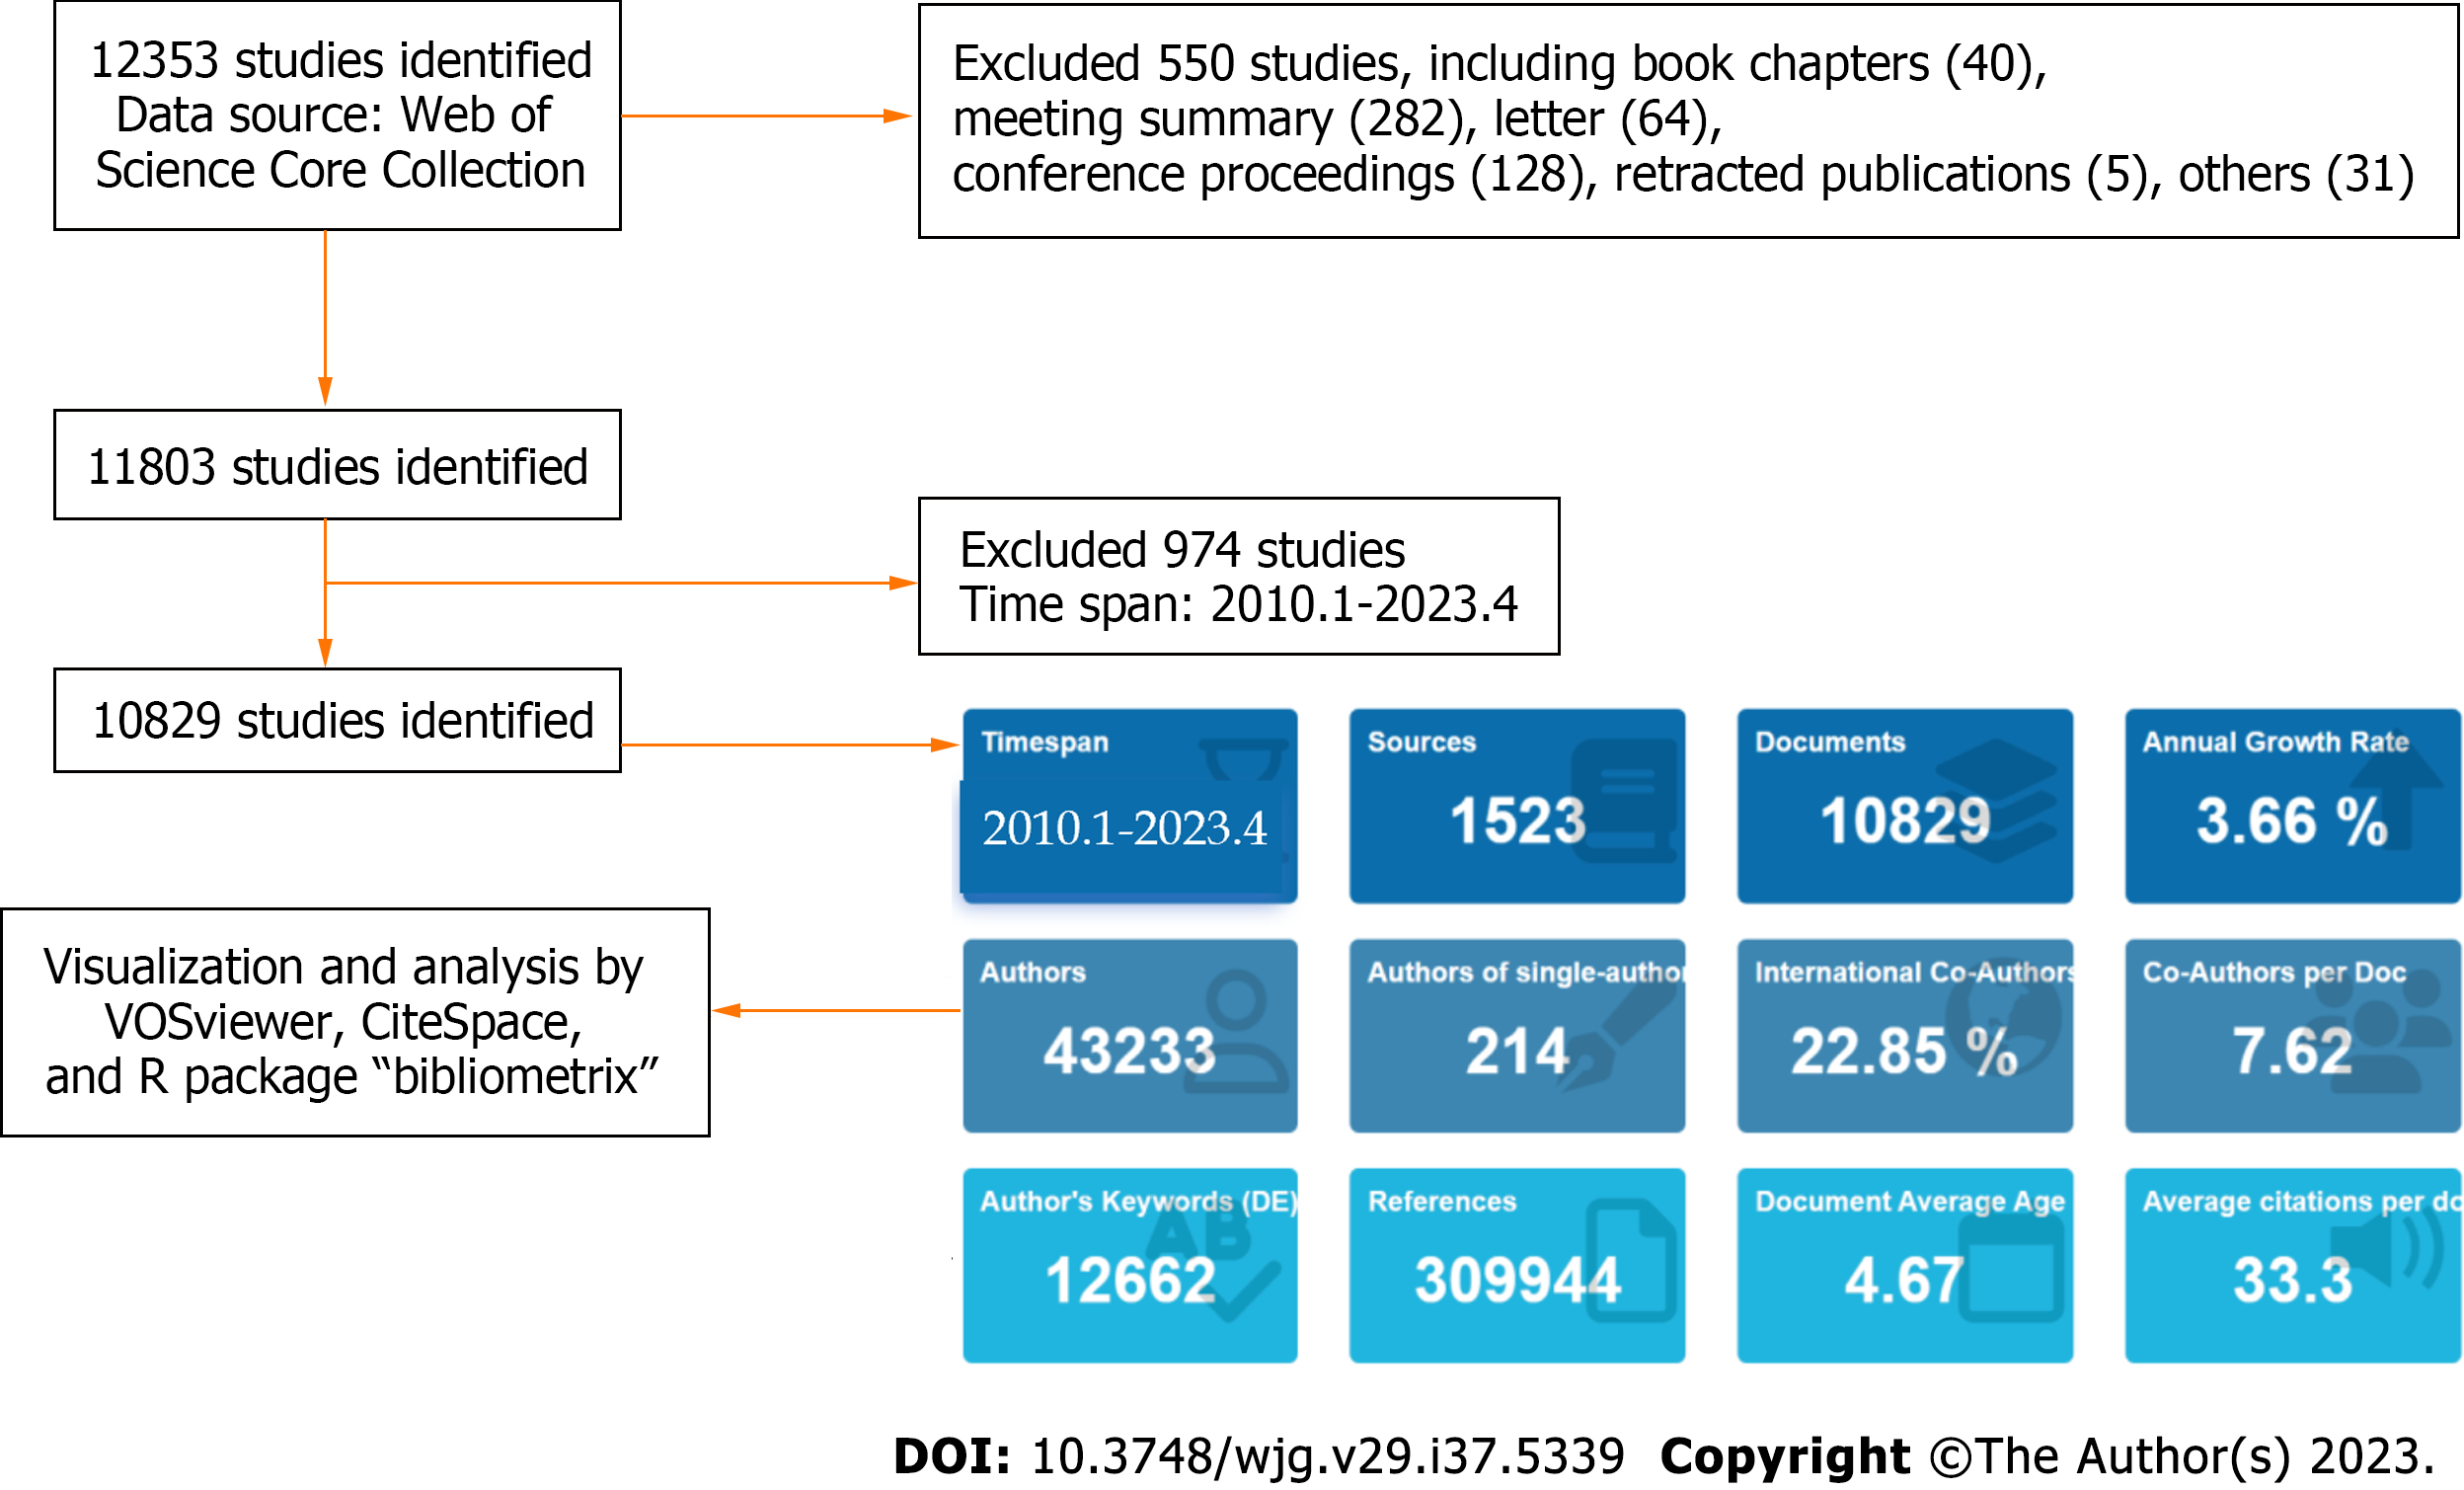
Figure 1
Flowchart for publication screening.
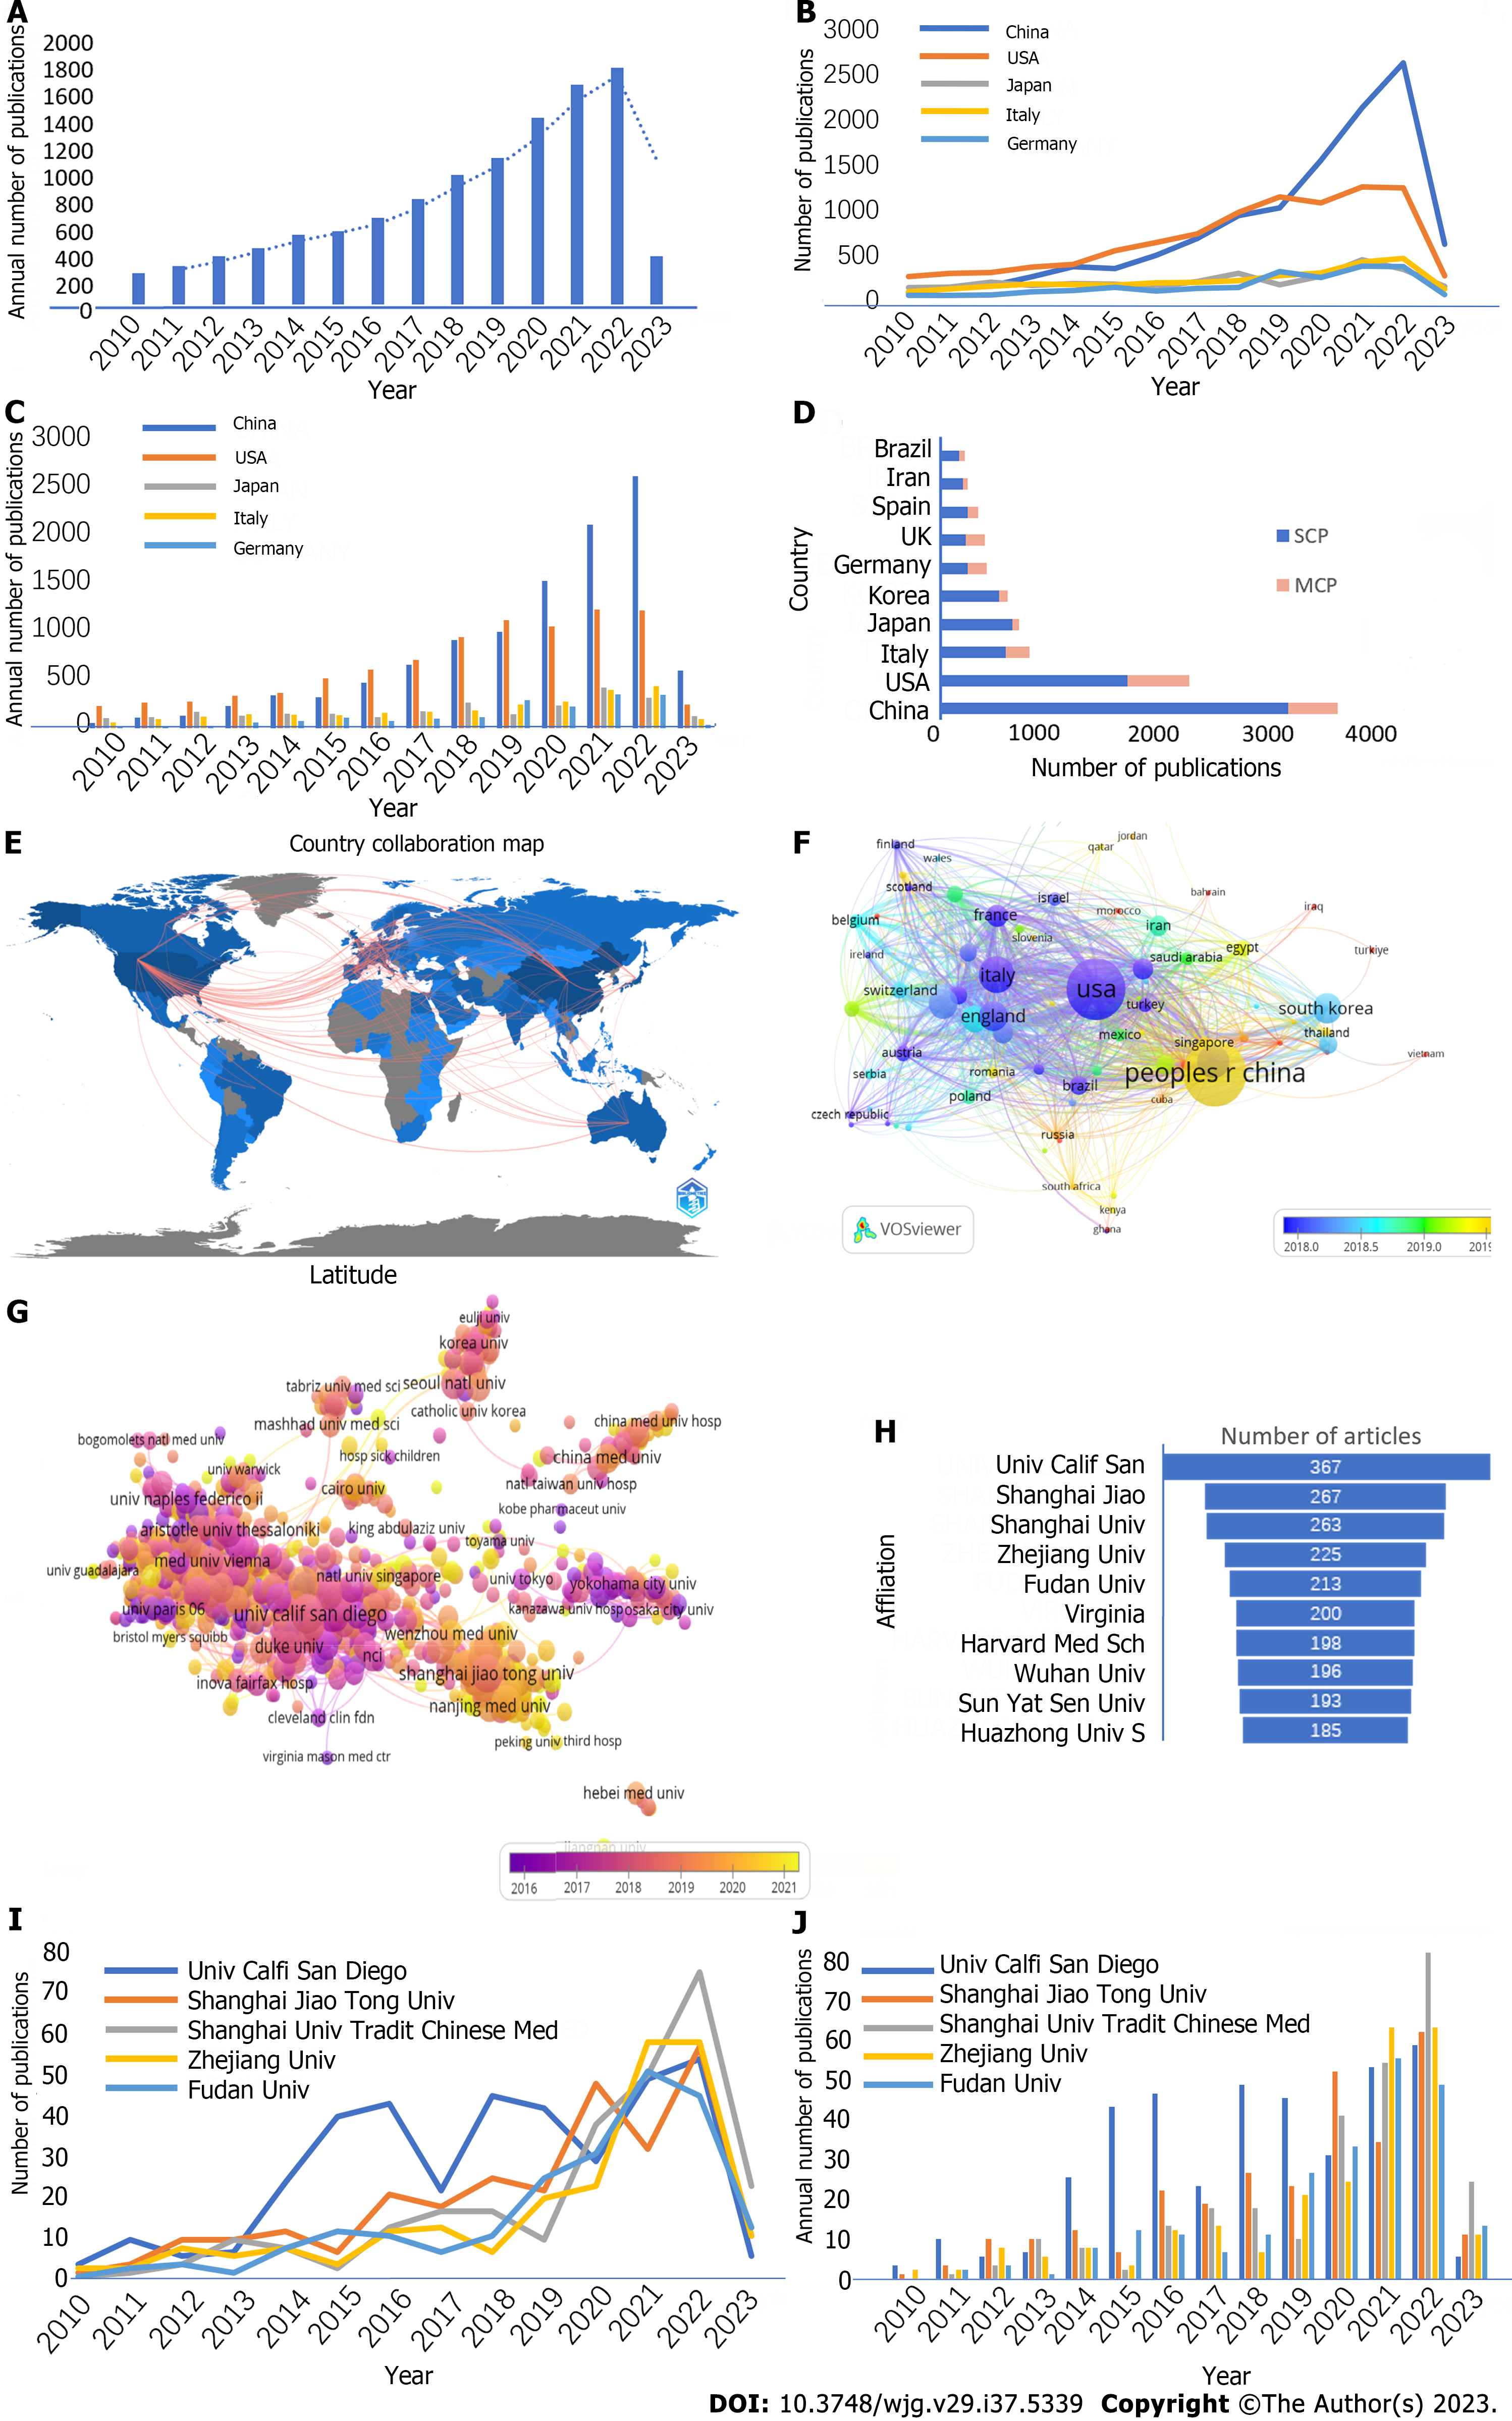
Figure 2 Quantitative analysis of publication.
A: Annual output of therapy for nonalcoholic fatty liver disease; B: Country production over time; C: Annual output by country; D: Corresponding authors’ countries; E: Country collaboration world map; F: Visualization of countries; G: Visualization of institutions on nonalcoholic fatty liver disease research; H: Most relevant affiliations; I: Institution production over time; J: Annual output by institution. MCP: Multiple country publication; SCP: Single country publication.
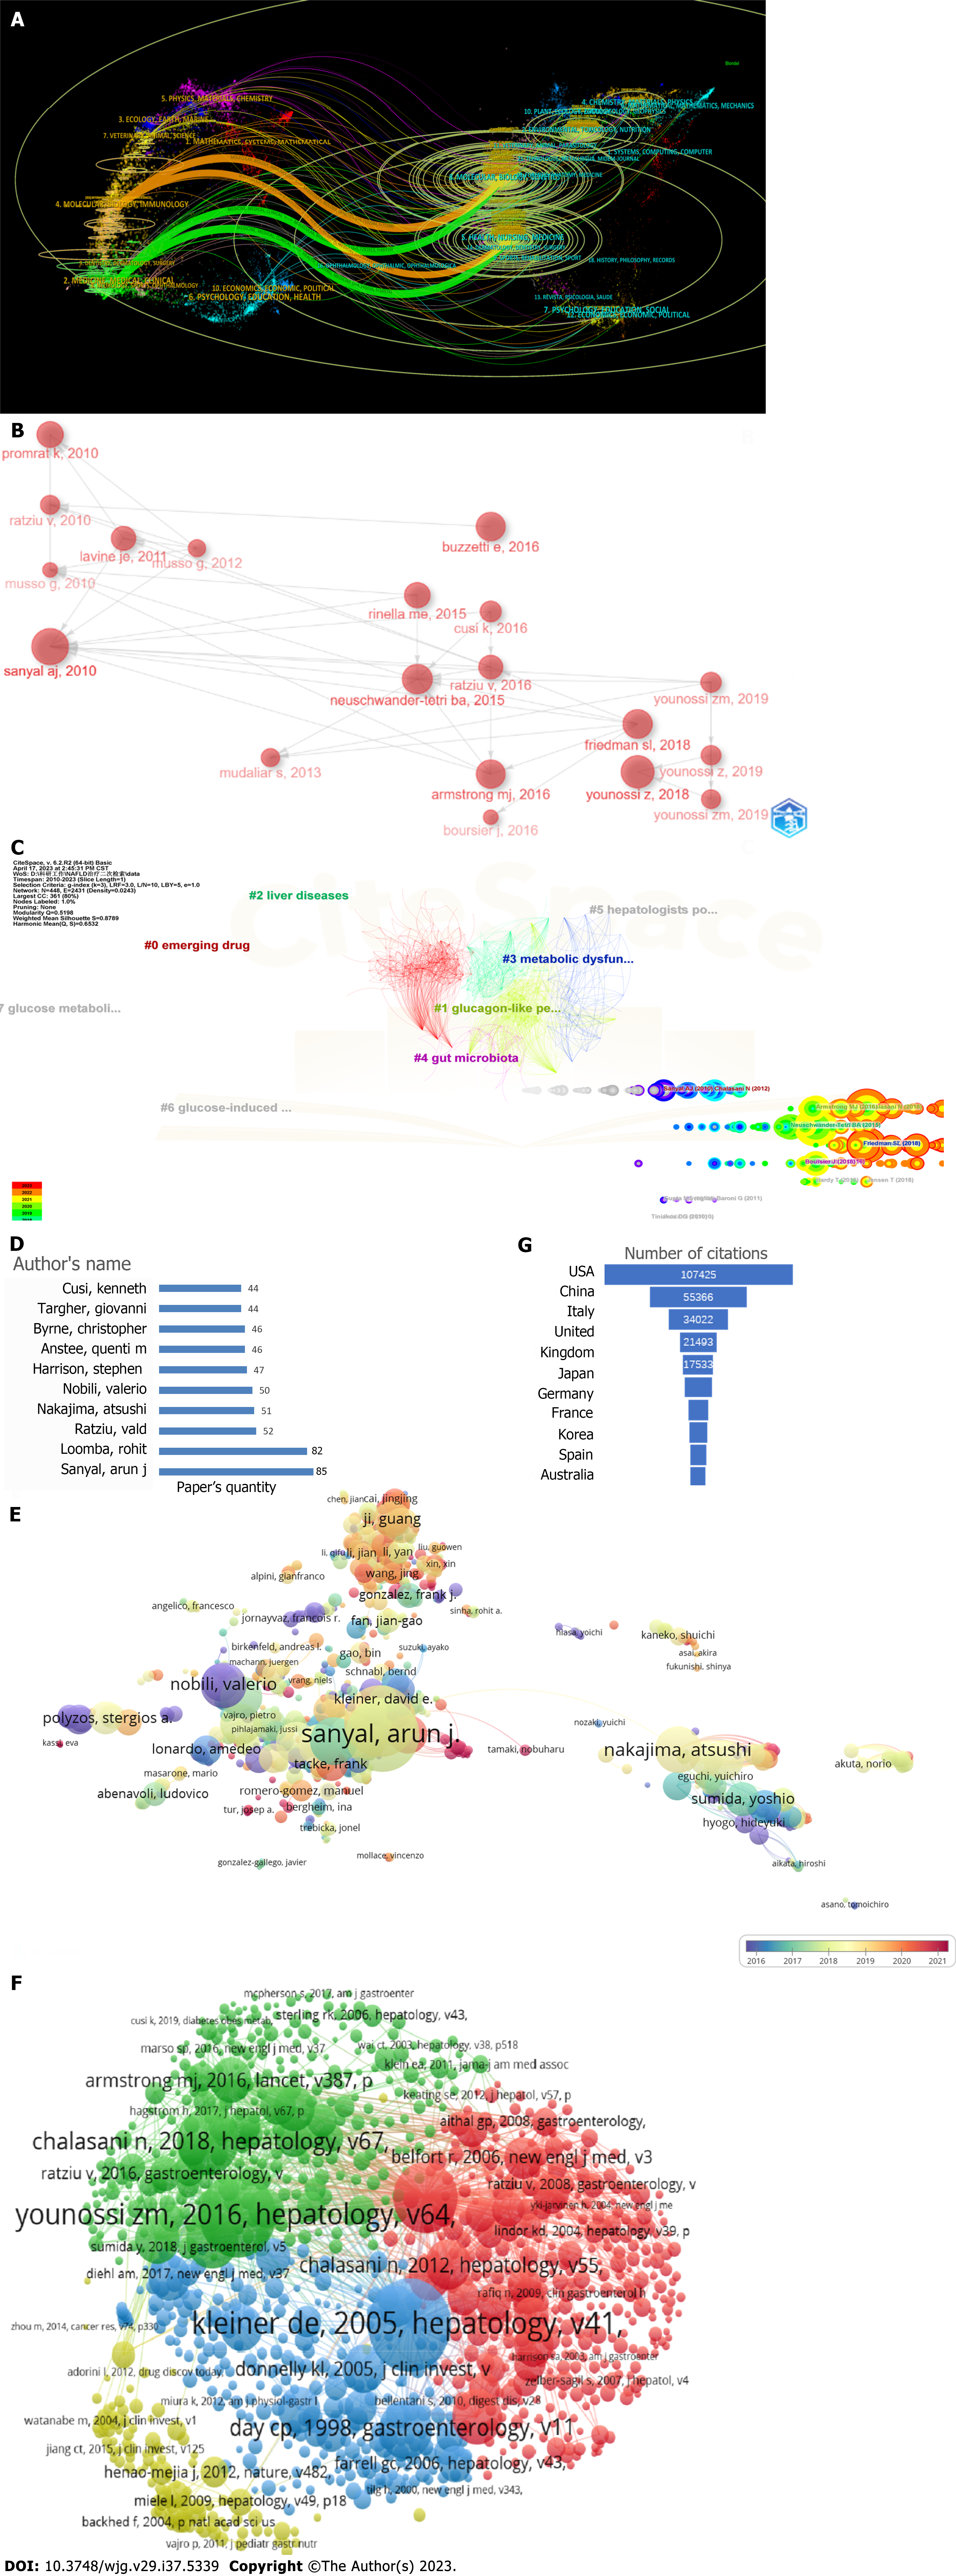
Figure 3 Research trends.
A: Dual-map overlay of journals publishing studies on the therapy for nonalcoholic fatty liver disease; B: Historiograph; C: Co-citation network of reference cluster analysis; D: Paper’s quantity of most relevant authors; E: Visualization of relevant authors; F: Visualization of co-cited references; G: Most cited country.
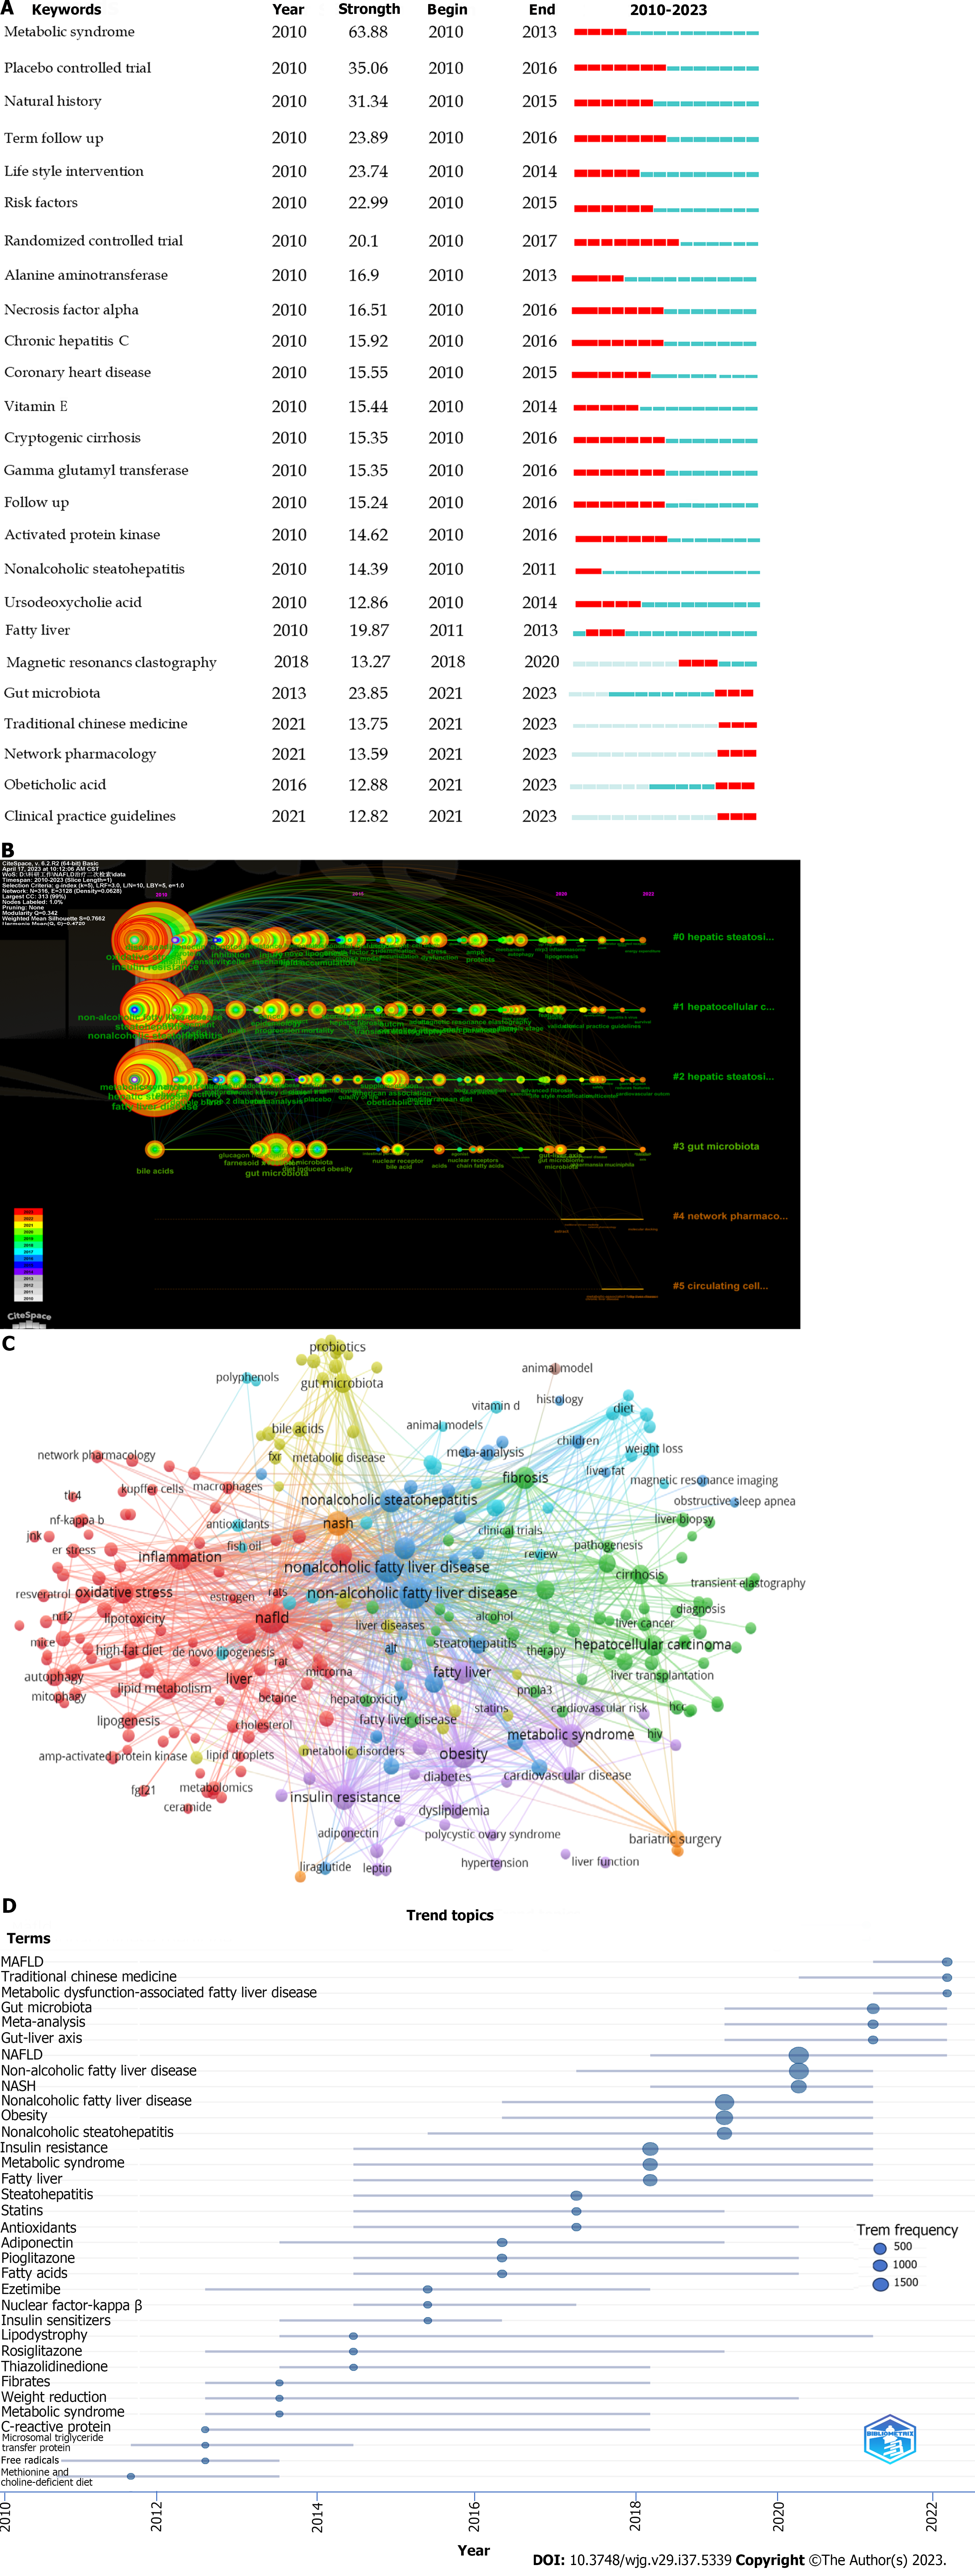
Figure 4 Research hotspots.
A: Keywords with the strongest burst strength; B: Timeline cluster analysis; C: Co-occurrence author keyword; D: Trend topics.
- Citation: Dai JJ, Zhang YF, Zhang ZH. Global trends and hotspots of treatment for nonalcoholic fatty liver disease: A bibliometric and visualization analysis (2010-2023). World J Gastroenterol 2023; 29(37): 5339-5360
- URL: https://www.wjgnet.com/1007-9327/full/v29/i37/5339.htm
- DOI: https://dx.doi.org/10.3748/wjg.v29.i37.5339


