Copyright
©The Author(s) 2023.
World J Gastroenterol. Sep 28, 2023; 29(36): 5180-5197
Published online Sep 28, 2023. doi: 10.3748/wjg.v29.i36.5180
Published online Sep 28, 2023. doi: 10.3748/wjg.v29.i36.5180
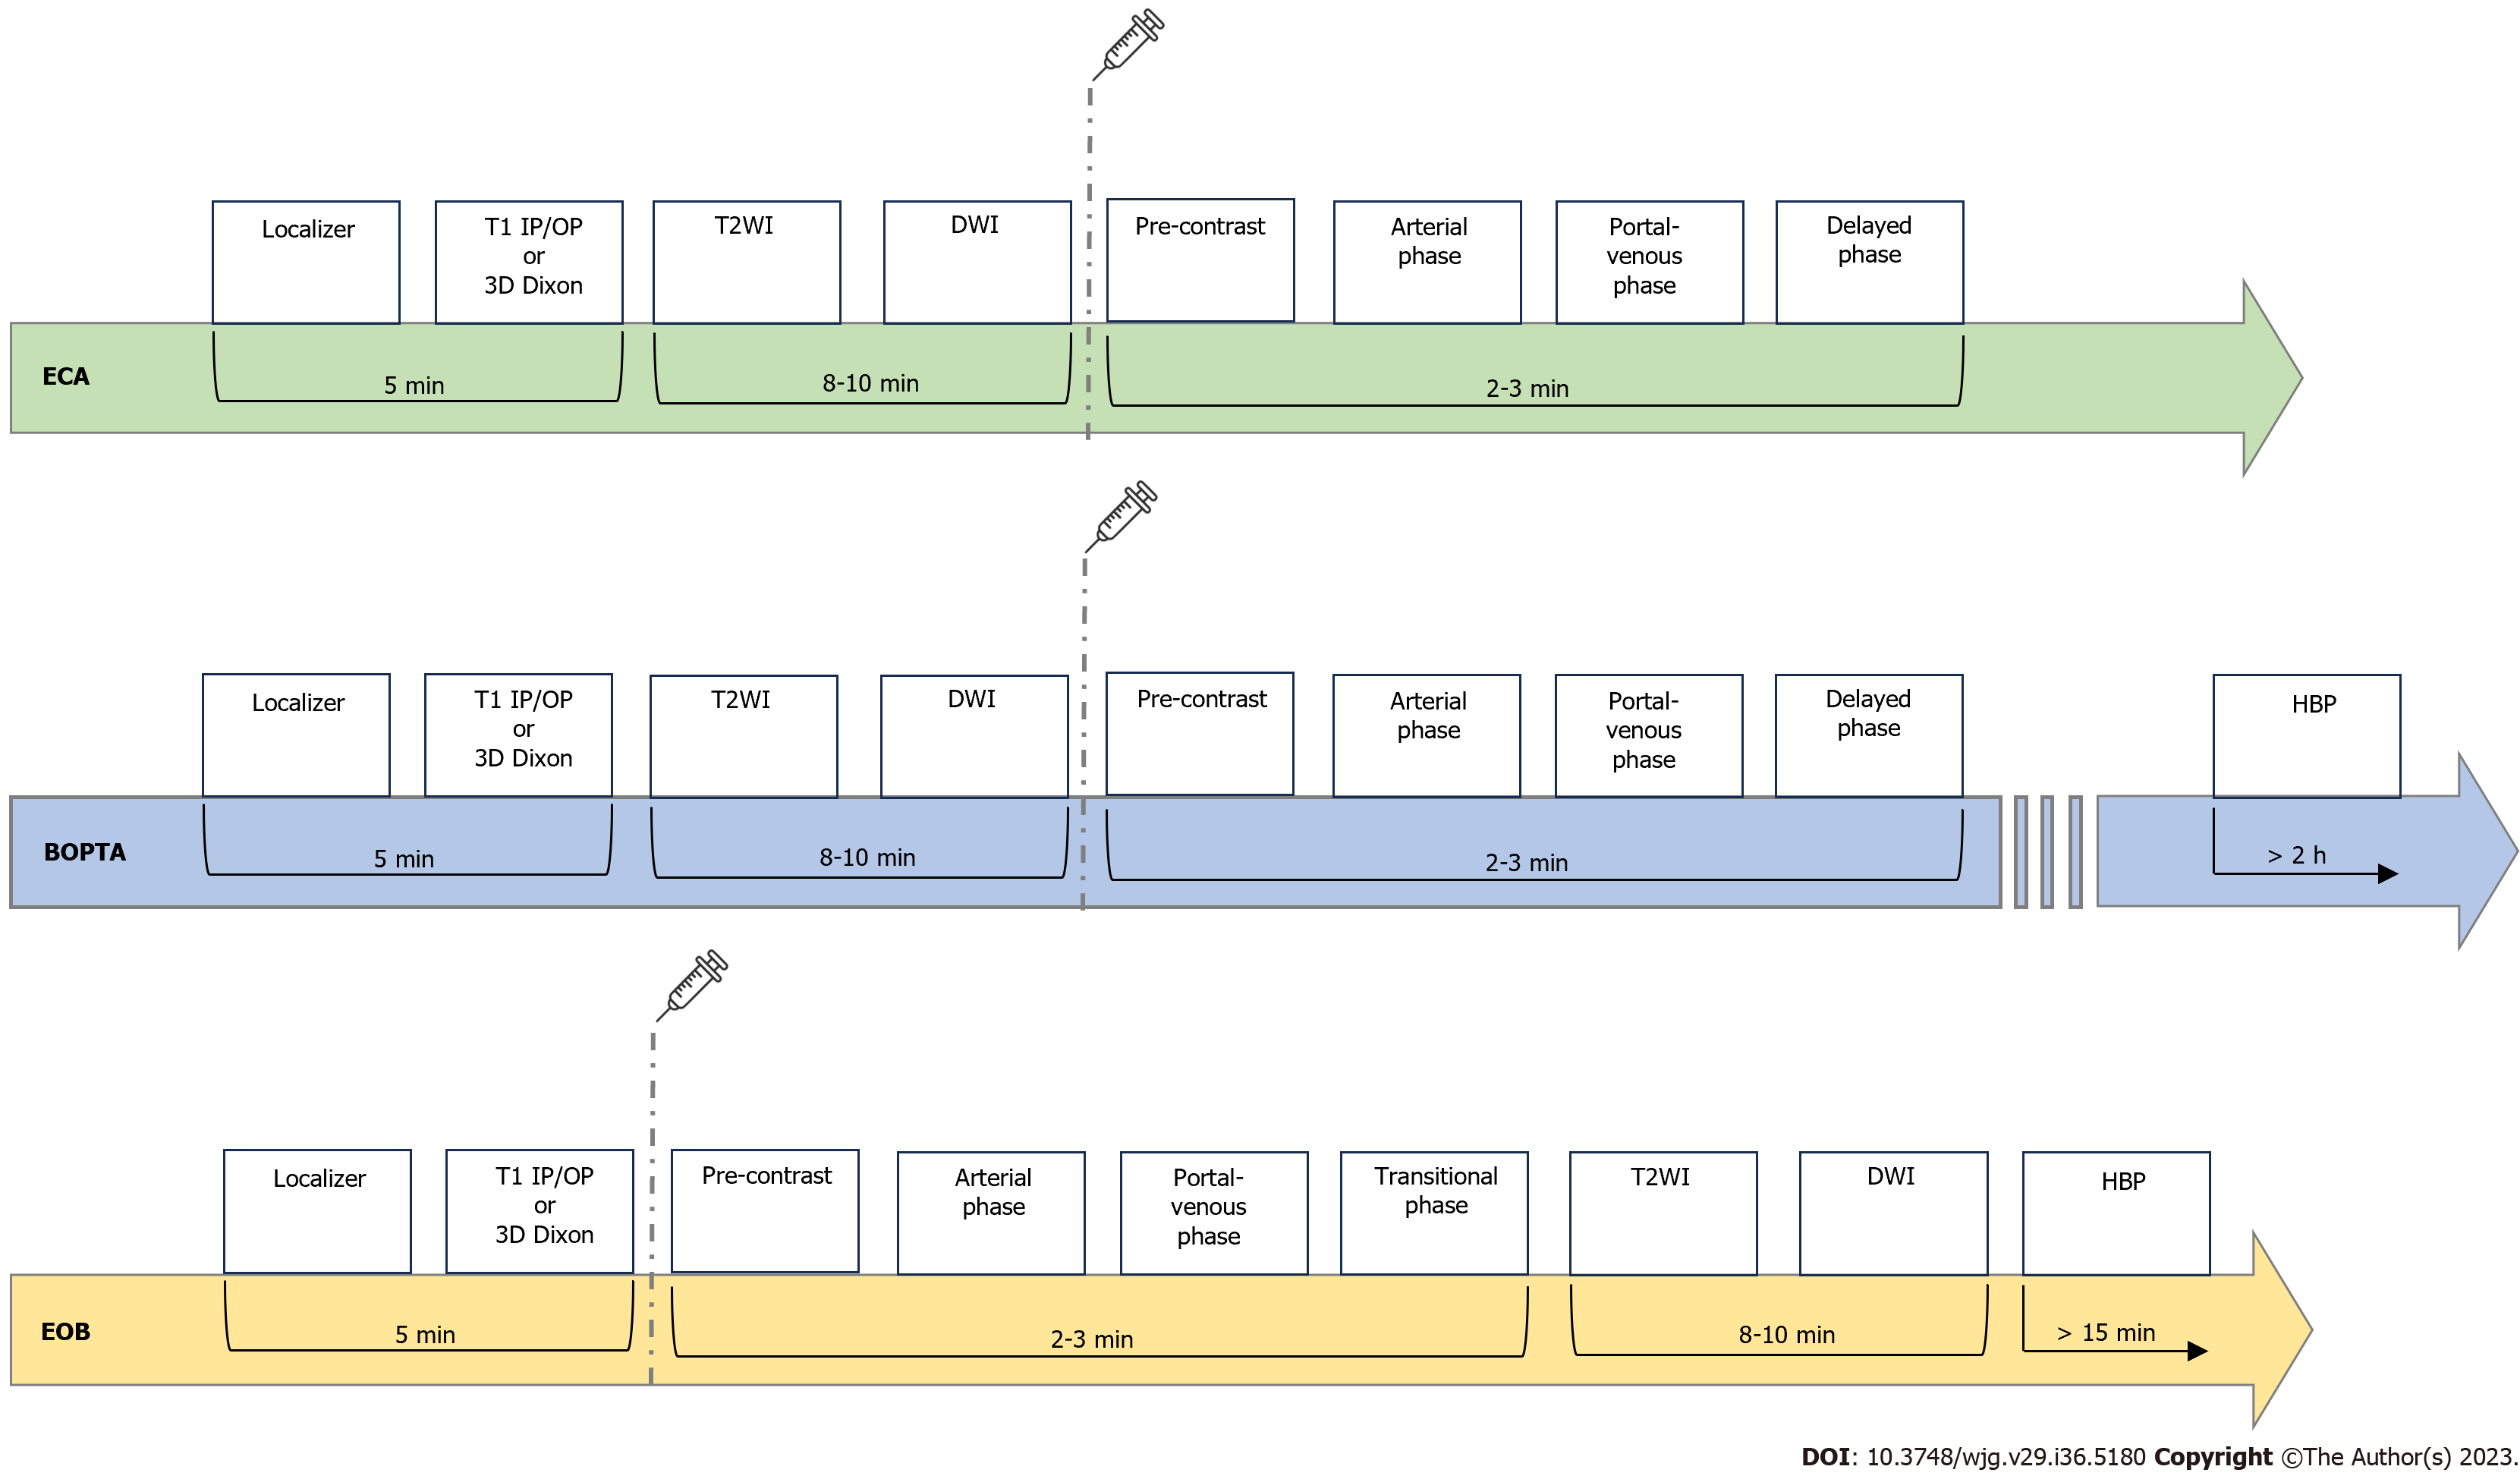
Figure 1 Schematic summary of magnetic resonance imaging protocols by using ECAs and hepatobiliary contrast agents (Gd-BOPTA and Gd-EOB-DTPA).
ECA: Extra-cellular; BOPTA: Gadobenate dimeglumine; EOB: Gadoxetic acid, disodium; T1 IP: T1-weighted in-phase imaging; T1 OP: T1-weighted out-of-phase imaging; DWI: Diffusion weighted imaging; HBP: Hepatobiliary phase; T2WI: T2-weighted imaging; HBP: Hepatobiliary phase.
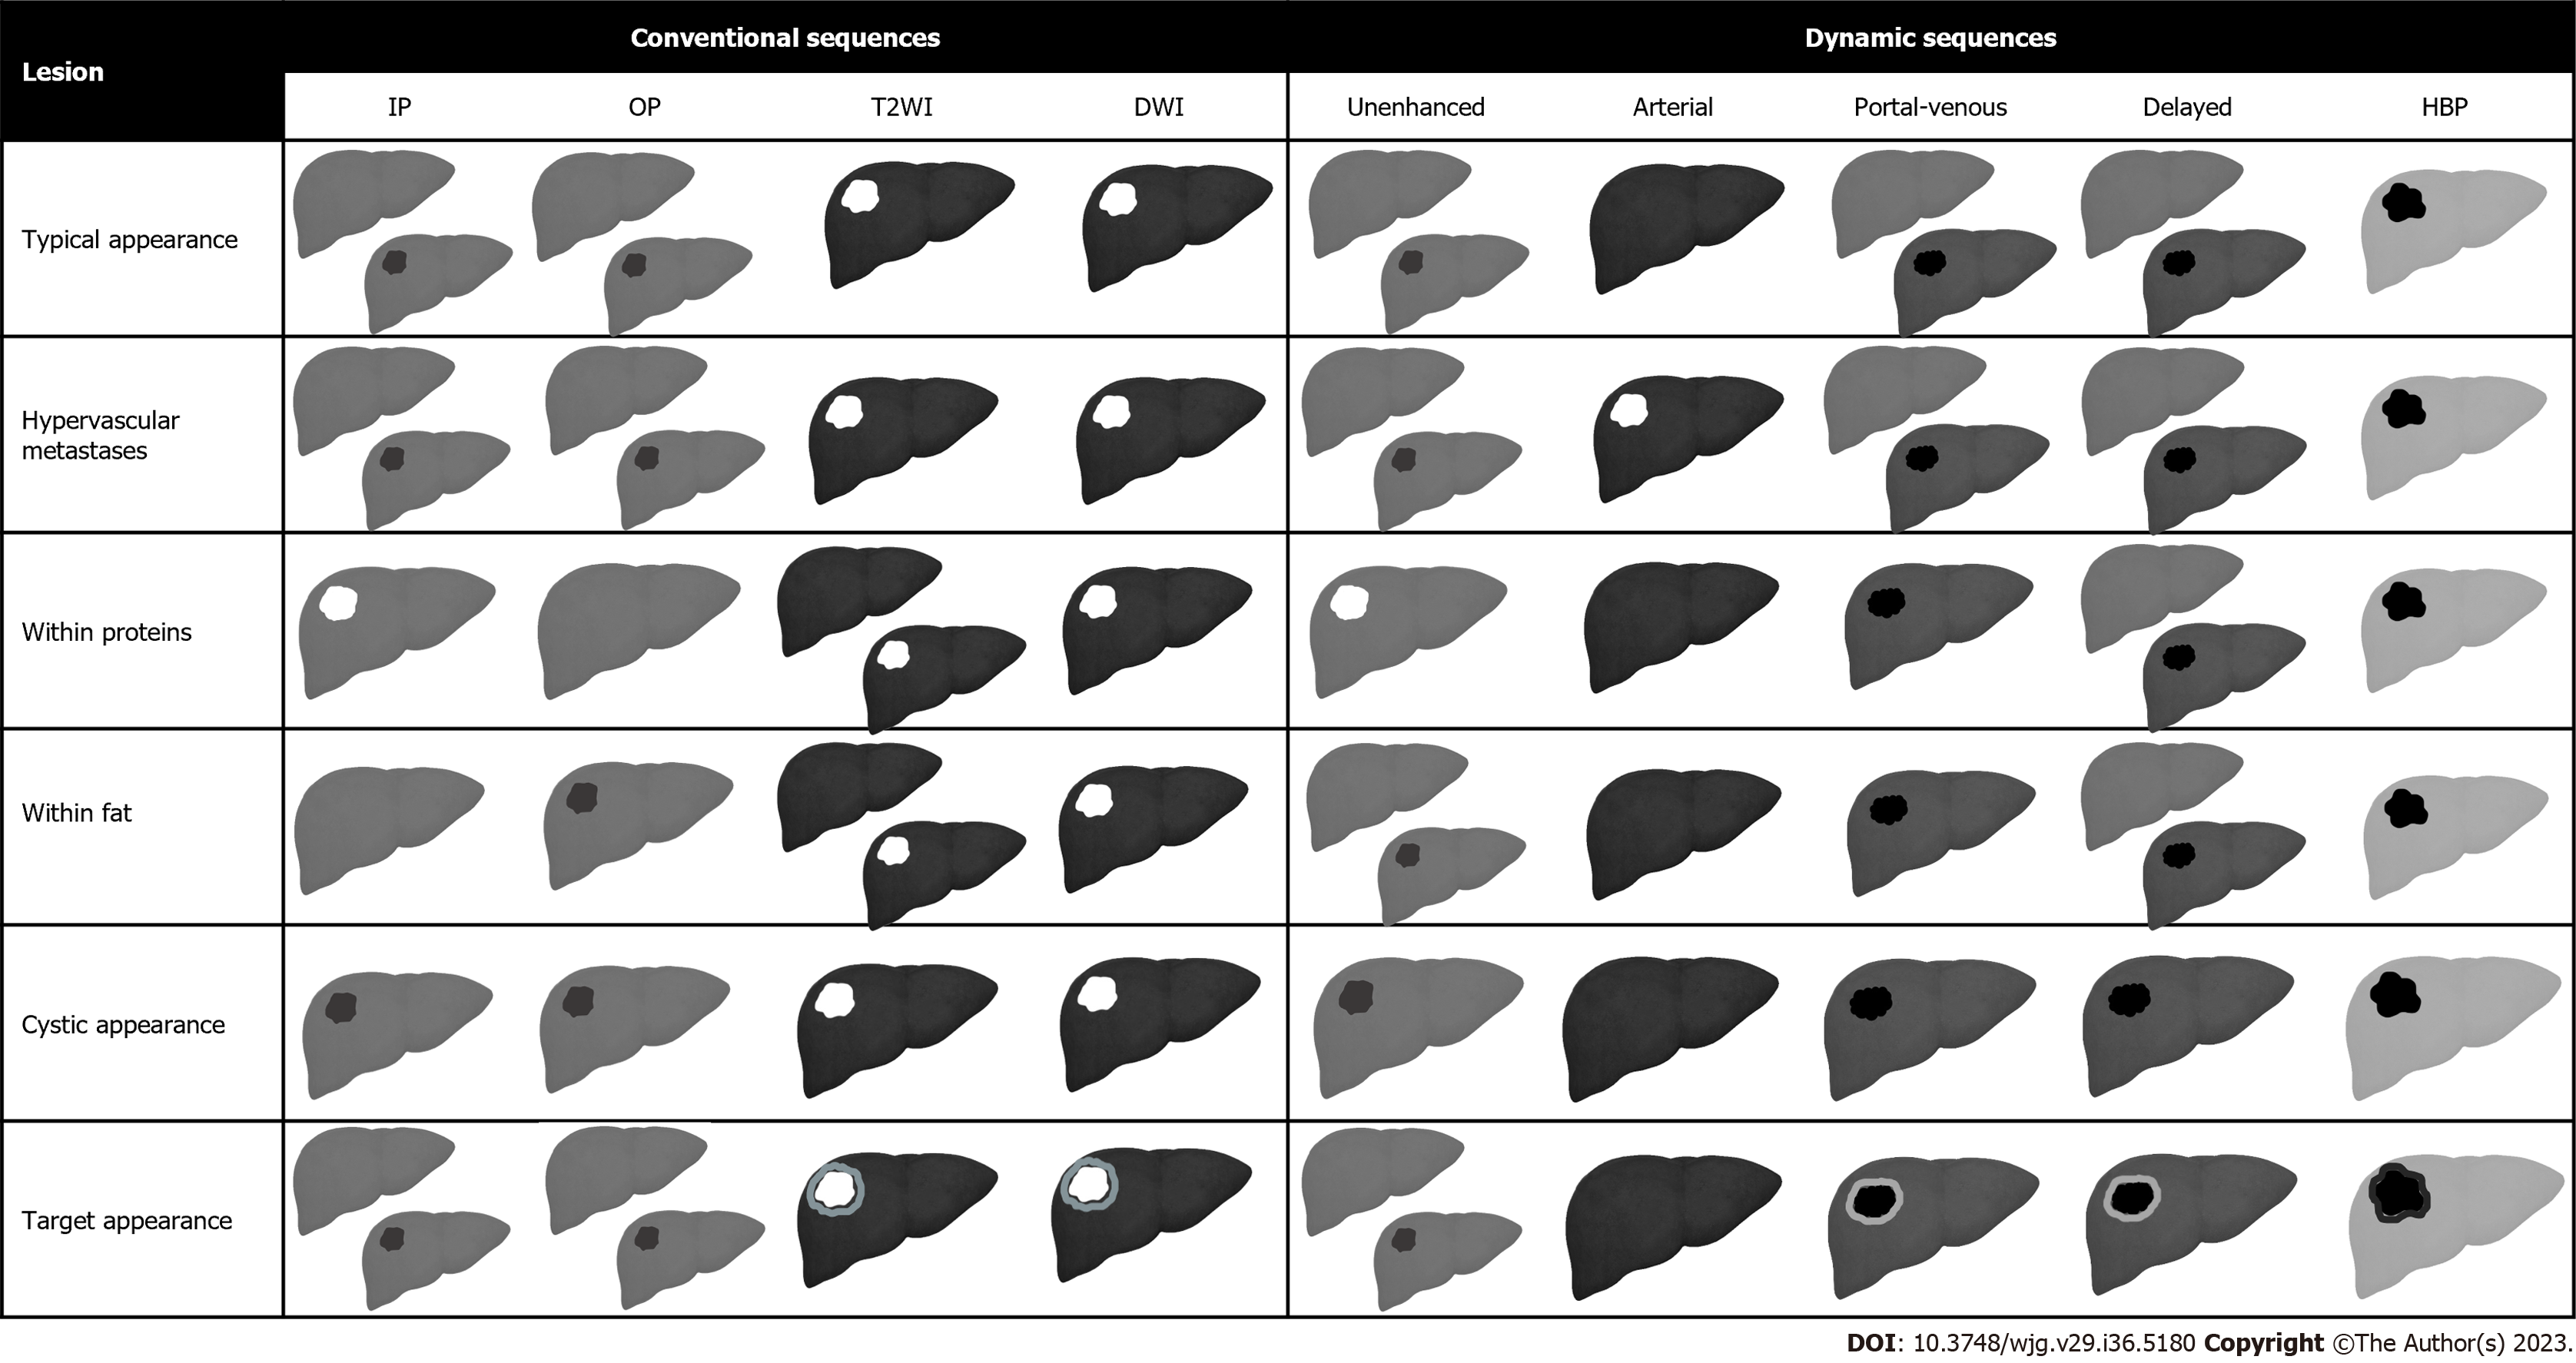
Figure 2 Schematic representation of morphological liver metastases appearance.
Figure 3 Graphical representation of liver metastases appearance on pre-contrast sequences and during the administration of hepatobiliary contrast agents.
IP: In-phase imaging; OP: Out-of-phase imaging; DWI: Diffusion weighted imaging; T2WI: T2-weighted imaging; HBP: Hepatobiliary phase.
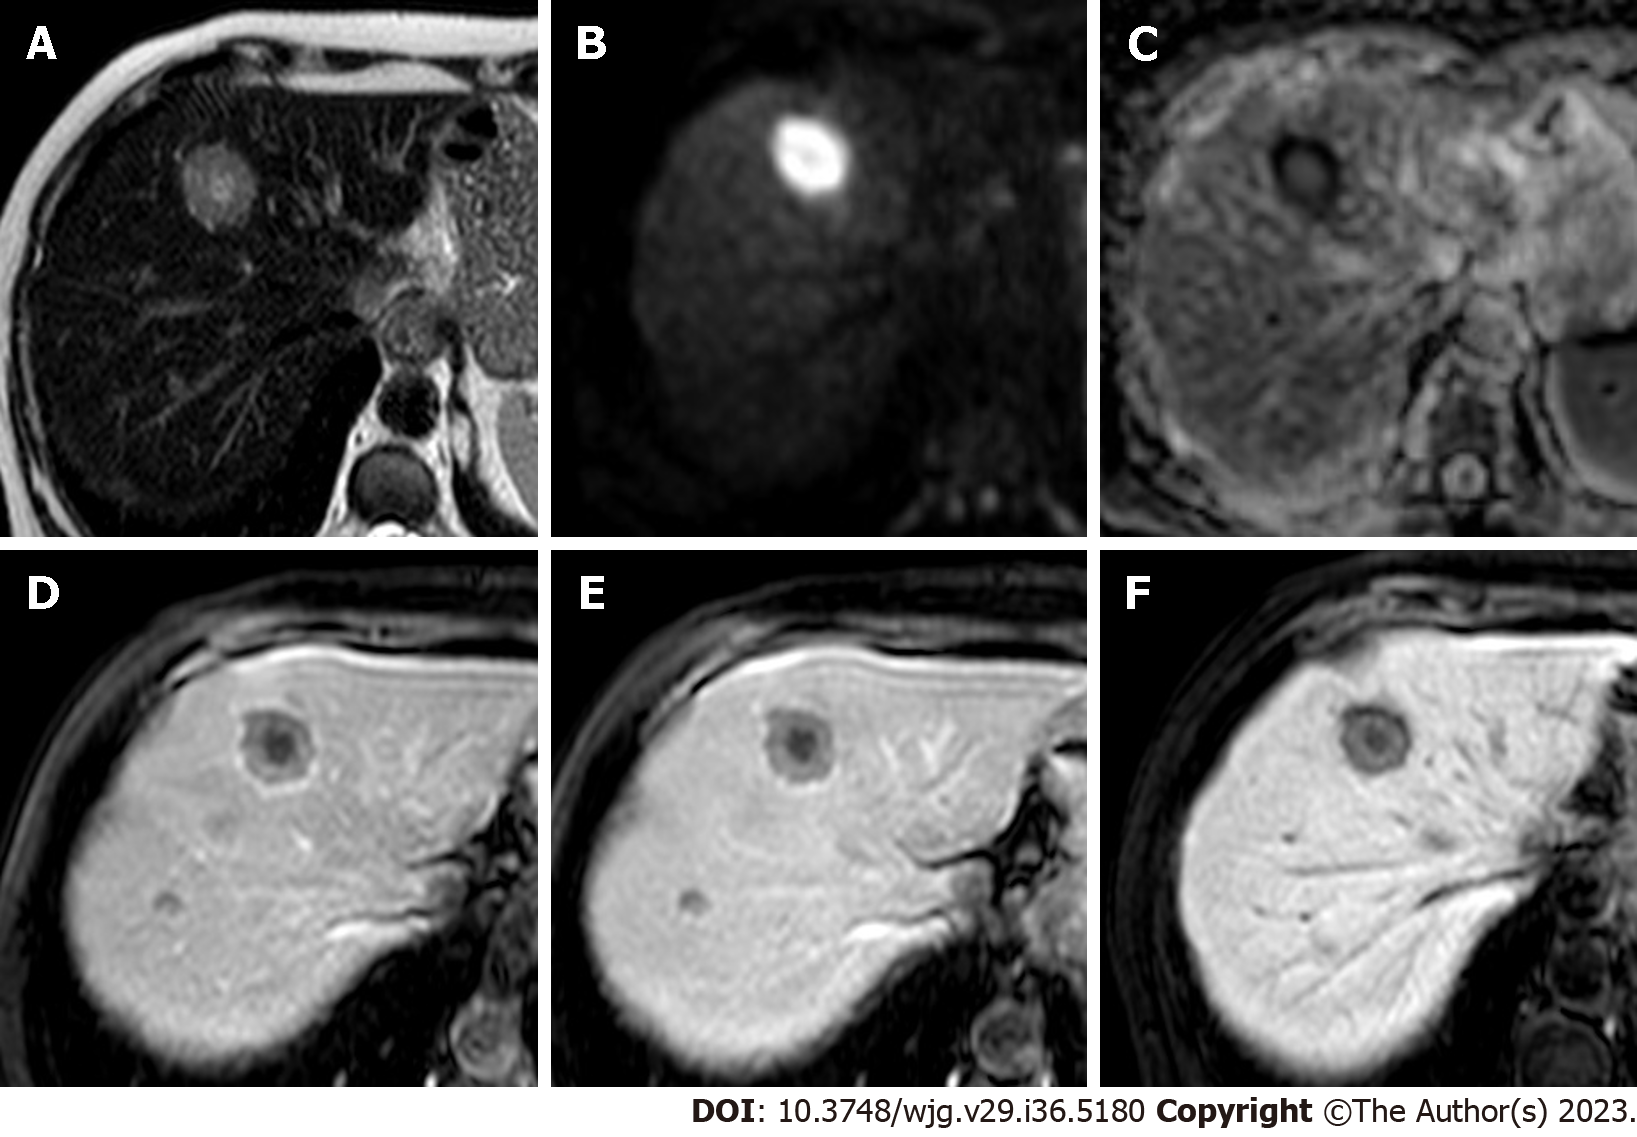
Figure 4 Liver metastases from colorectal cancer.
A: EOB-magnetic resonance imaging of a 62-year-old woman demonstrates a liver lesion with hyperintensity on T2-weighted images; B: On diffusion weighted imaging the lesion appears markedly hyperintense; C: Apparent diffusion coefficient map demonstrates a peripheral hypointensity of the lesion; D: On the post-contrast arterial phase the lesion demonstrate reduced enhancement compared to the surrounding liver parenchyma with typical targetoid hypointensity; E: On the portal-venous phase the lesion remain hypovascular with targetoid appearance; F: On the hepatobiliary phase the lesion shows persistent hypoenhancement. Multiple other metastases were present in the liver parenchyma (not shown).
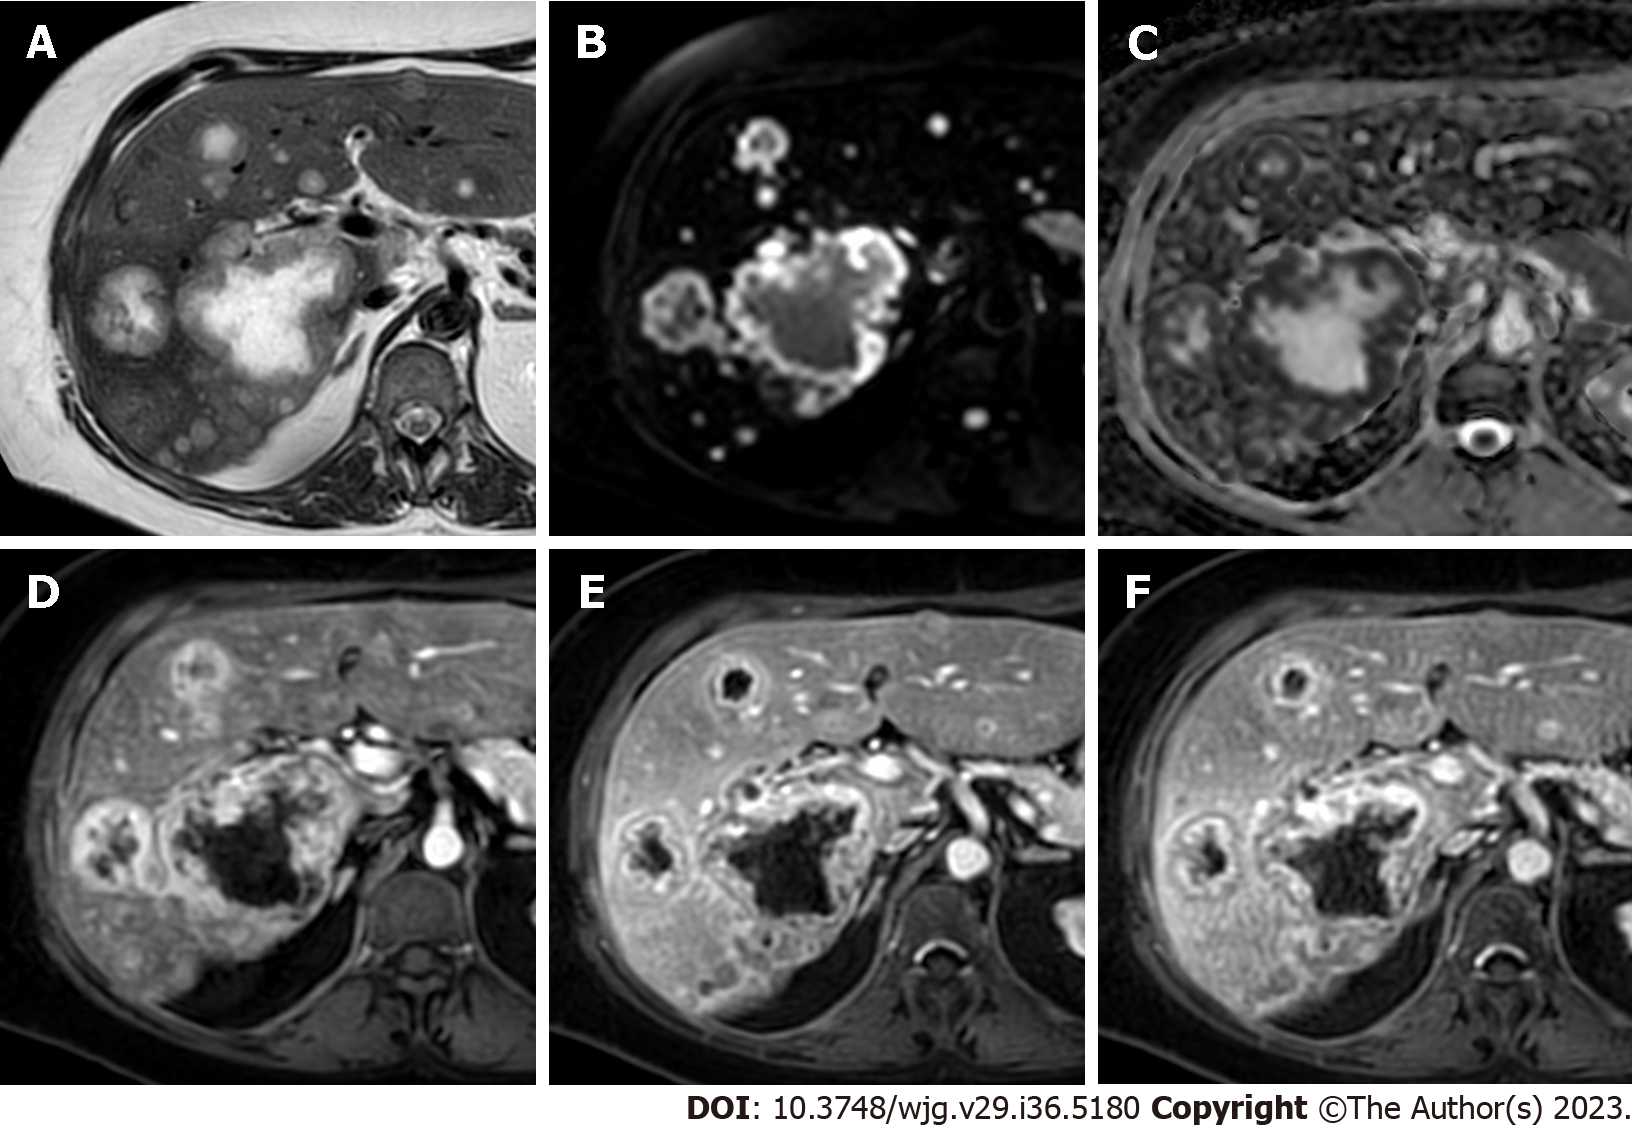
Figure 5 Multiple liver metastases from breast cancer.
A: ECA-magnetic resonance imaging of a 51-year-old woman shows multiple liver lesions with central marker hyperintensity on T2-weighted images; B: Diffusion weighted imaging sequence demonstrates lesions’ peripheral restricted diffusion; C: Apparent diffusion coefficient map shows a corresponding peripheral hypointensity of the lesions; D: On post-contrast arterial phase the lesions demonstrate a peripheral hyperenhancement rim with a central hypo-perfused area; E: On portal venous a corresponding peripheral washout is observed; F: On delayed post-contrast phase the peripheral hypoenhancement persists.
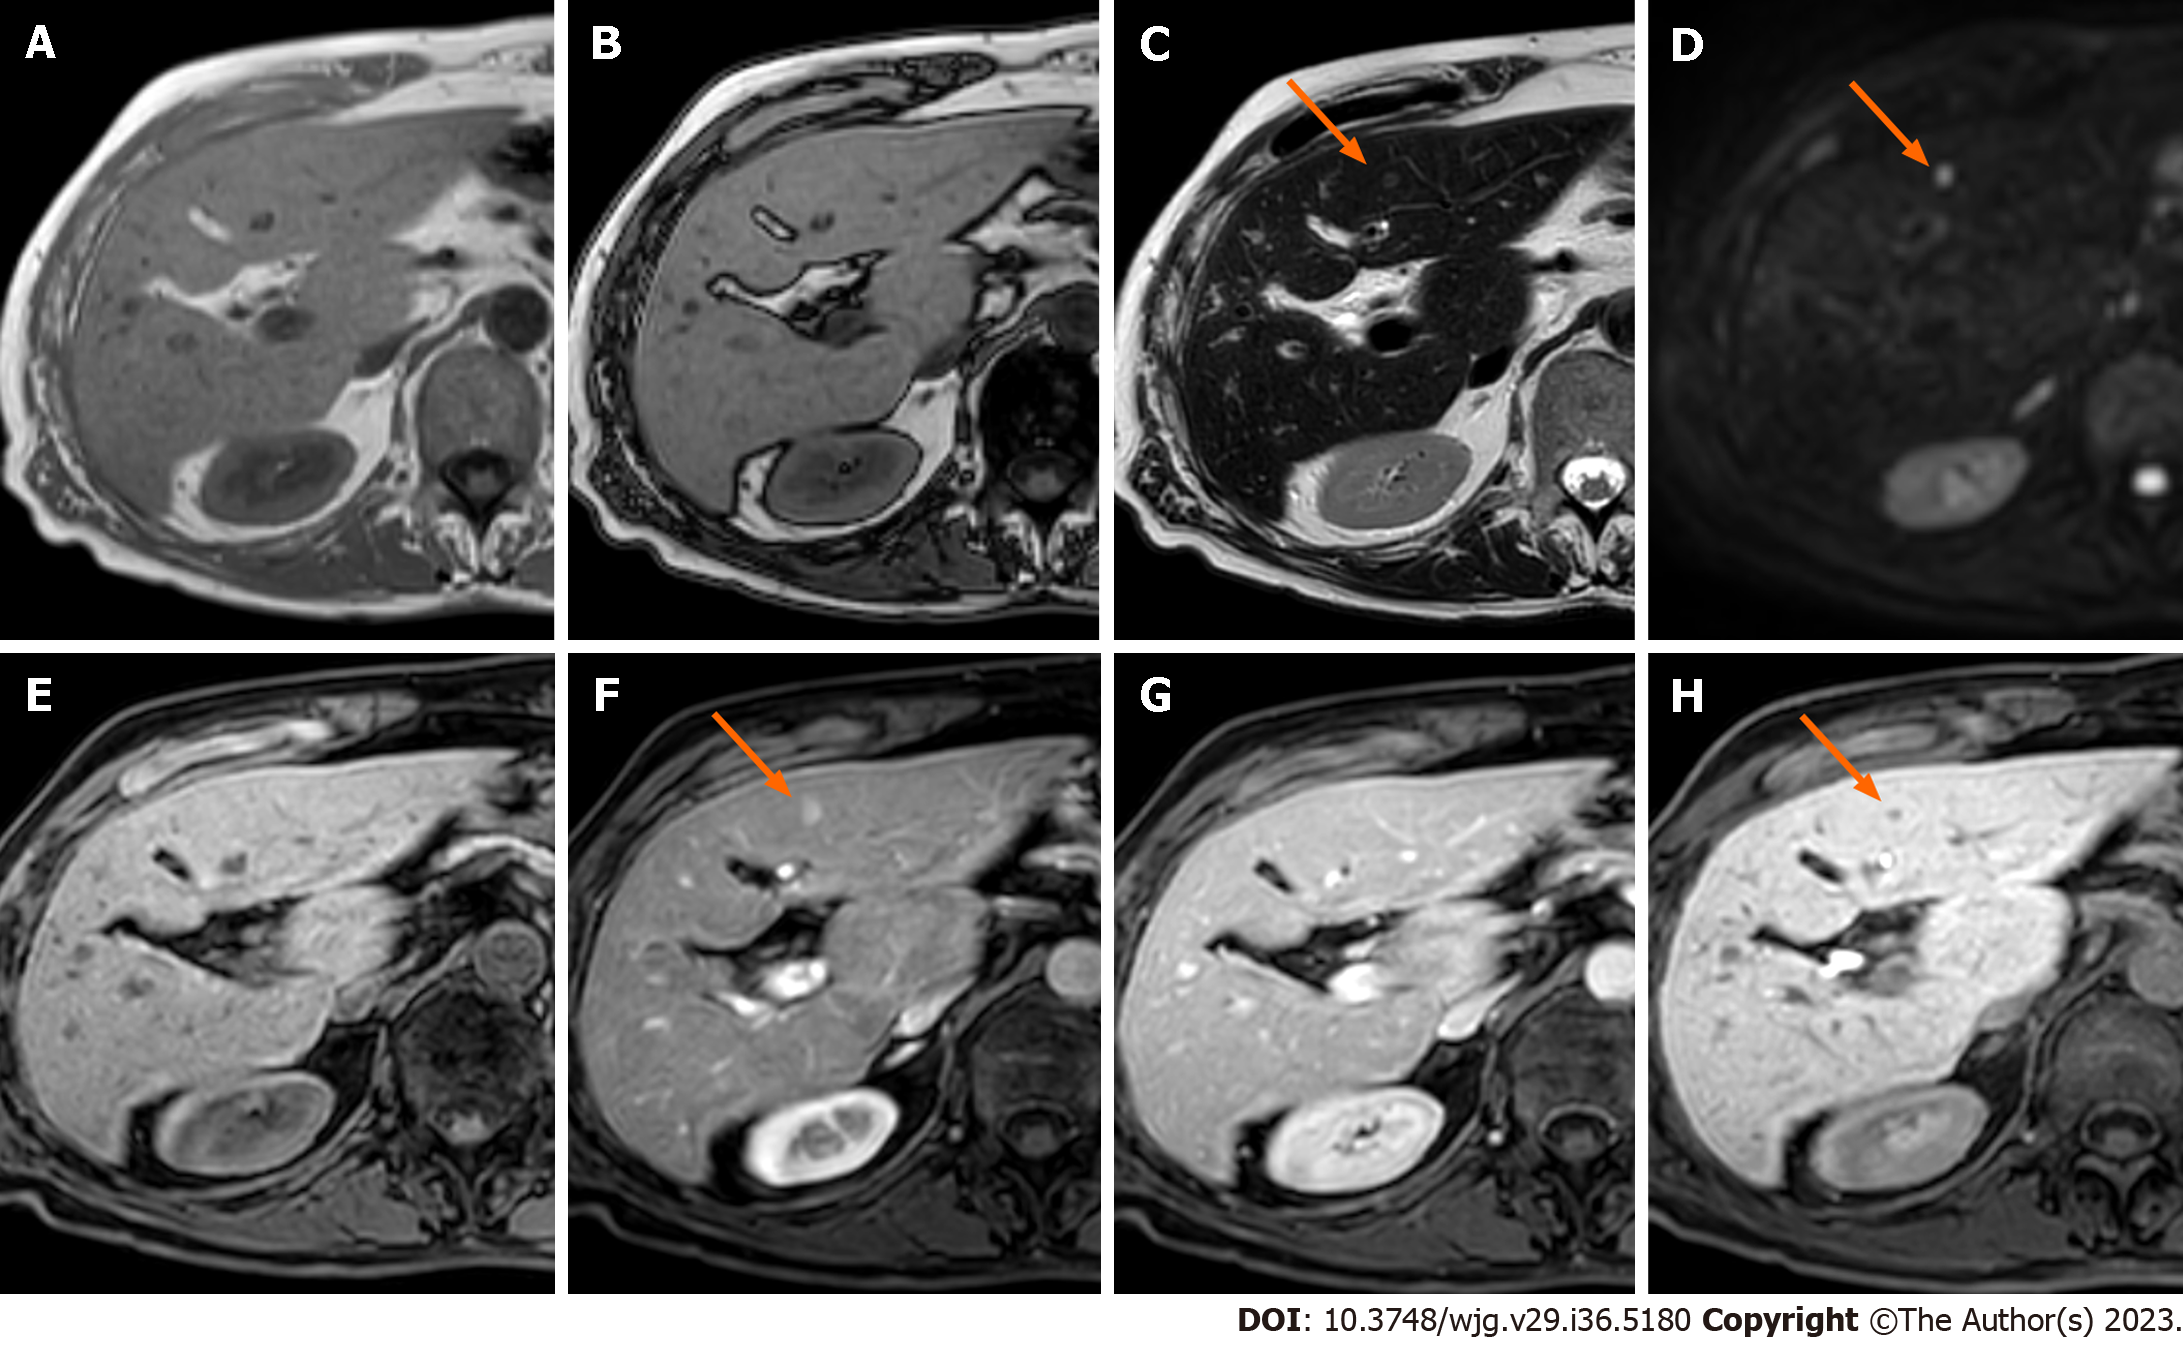
Figure 6 Liver metastases from ileal neuroendocrine tumor.
A: EOB-magnetic resonance imaging of a 55-year-old female patient shows a focal liver lesion isointense on in-phase images; B: On out-of-phase images, the lesions persist isointense compared to the healthy liver parenchyma; C: On T2-weighted images the lesion appears slightly hyperintense (orange arrow); D: Diffusion weighted imaging reveal restriction of diffusion of the lesion (orange arrow); E: Before contrast administration the lesion is isointense; F: During the post-contrast late hepatic arterial phase the lesion appears hypervascular (orange arrow); G: The lesion is isointense on the portal-venous phase; H: On the hepatobiliary phase lesion’s low signal intensity is observed (orange arrow).
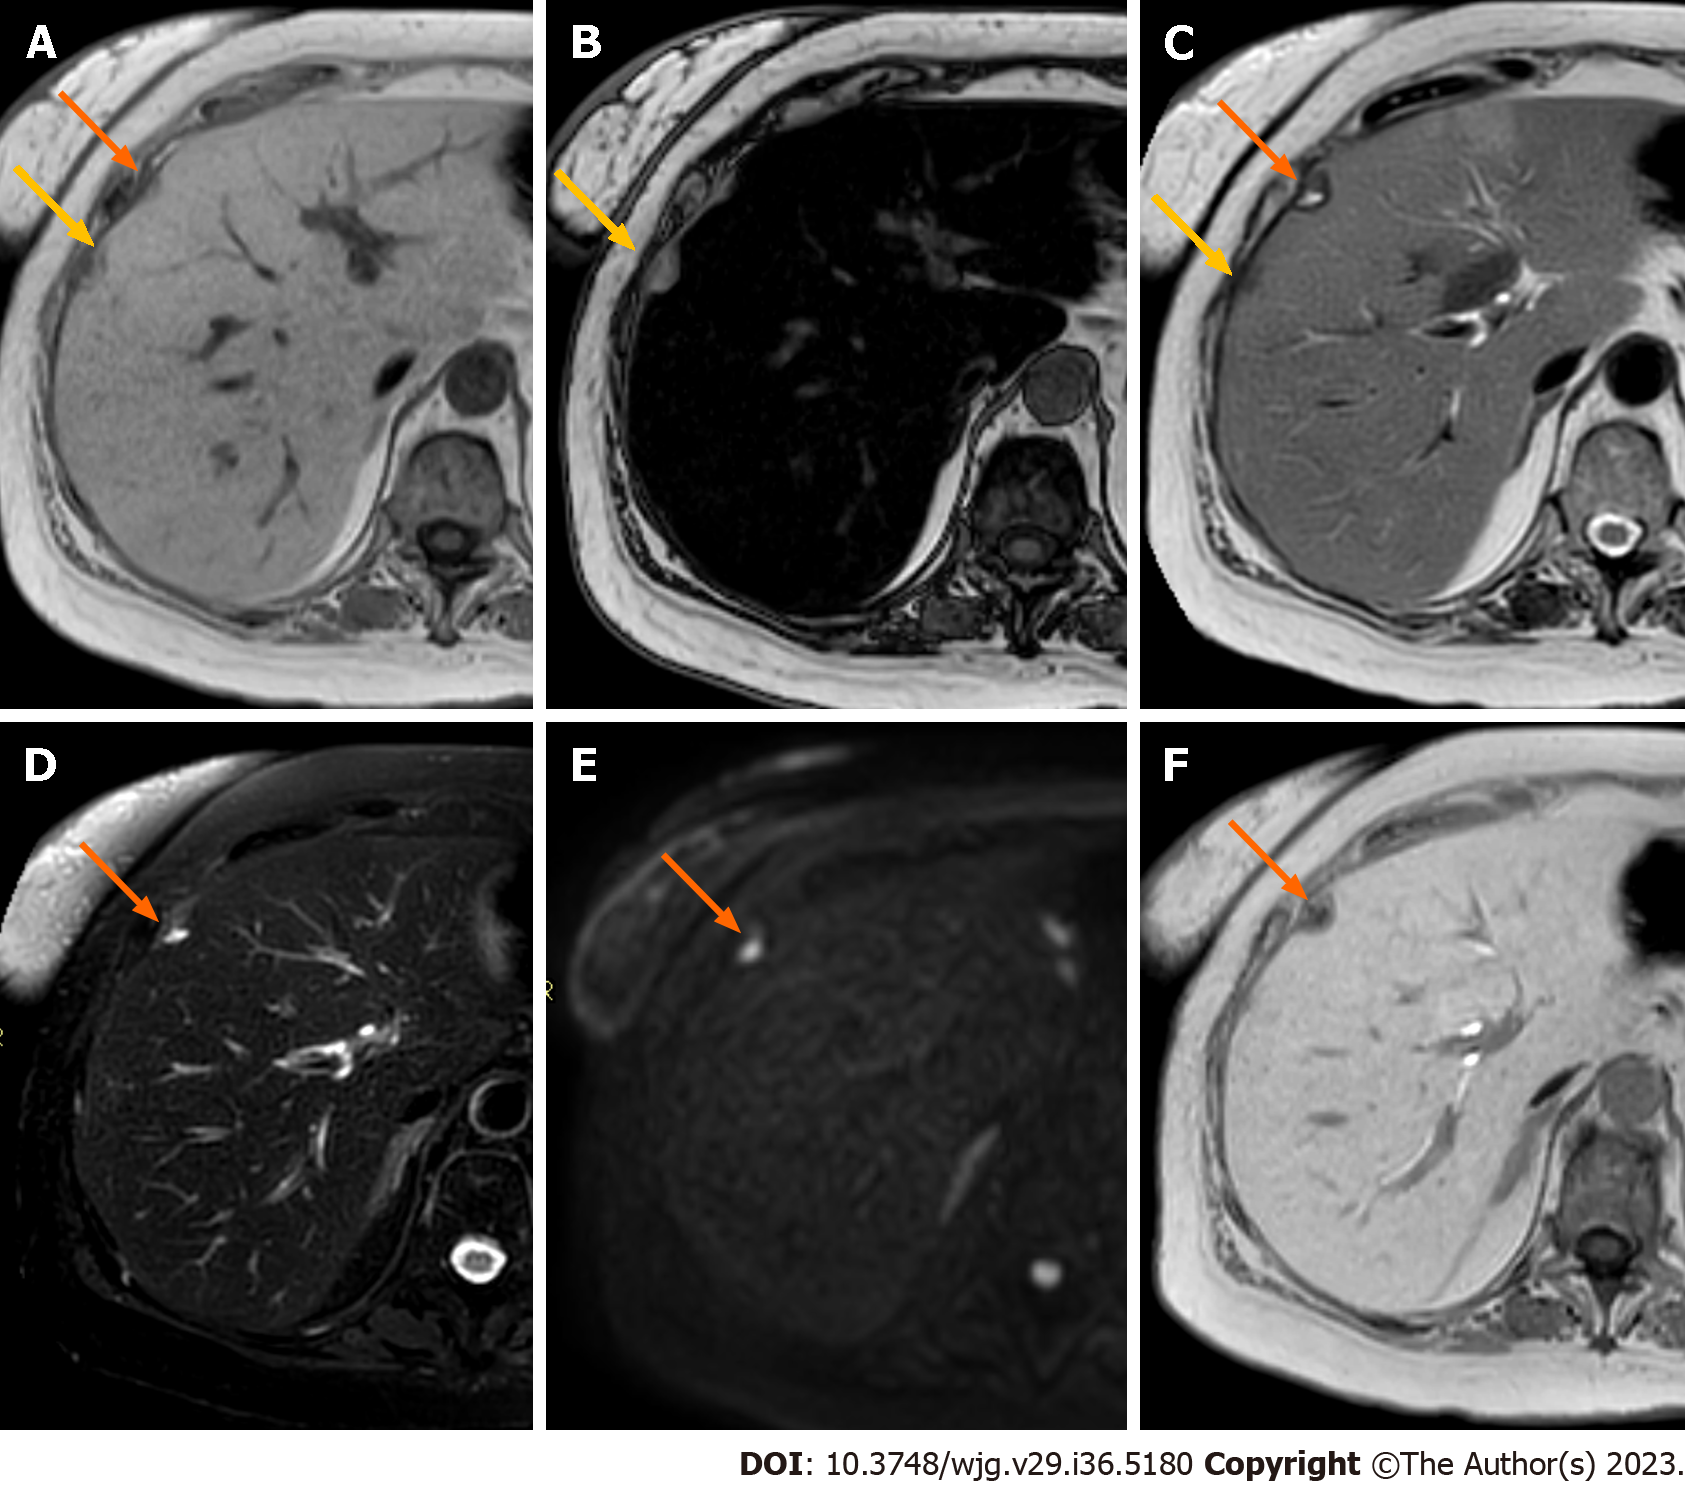
Figure 7 Liver metastases from pancreatic adenocarcinoma.
A: EOB-magnetic resonance imaging (MRI) of a 64-year-old woman shows two adjacent focal liver lesions (yellow and orange arrows) in the subcapsular region on the in-phase imaging; B: On out-phase imaging, one lesion (yellow arrow) shows hyperintensity, while the other one shows slight hypointensity. The liver is characterized by severe steatosis, considering the important signal drop-off between in-phase and out-of-phase imaging; C: On T2-weighted (T2W) imaging, one lesion (yellow arrow) is hypointense, while the other one (orange arrow) demonstrates inhomogeneous hyperintense signal; D: On fat-sat T2W sequence the low signal of the first lesion and the inhomogeneous high signal of the second one (orange arrow) are confirmed; E: Diffusion weighted imaging reveals focal restriction of diffusion corresponding to only one of the two lesions (orange arrow); F: On the hepatobiliary phase one lesion is isointense to liver parenchyma, while the second lesion shows a hypointense aspect. The final diagnosis for the lesion tagged by the orange arrow was liver metastasis from pancreatic adenocarcinoma, while the MRI characteristics of the lesion tagged by the yellow arrow are consistent with a focal fatty-sparing area.
- Citation: Maino C, Vernuccio F, Cannella R, Cortese F, Franco PN, Gaetani C, Giannini V, Inchingolo R, Ippolito D, Defeudis A, Pilato G, Tore D, Faletti R, Gatti M. Liver metastases: The role of magnetic resonance imaging. World J Gastroenterol 2023; 29(36): 5180-5197
- URL: https://www.wjgnet.com/1007-9327/full/v29/i36/5180.htm
- DOI: https://dx.doi.org/10.3748/wjg.v29.i36.5180


