Copyright
©The Author(s) 2023.
World J Gastroenterol. Jul 28, 2023; 29(28): 4466-4480
Published online Jul 28, 2023. doi: 10.3748/wjg.v29.i28.4466
Published online Jul 28, 2023. doi: 10.3748/wjg.v29.i28.4466
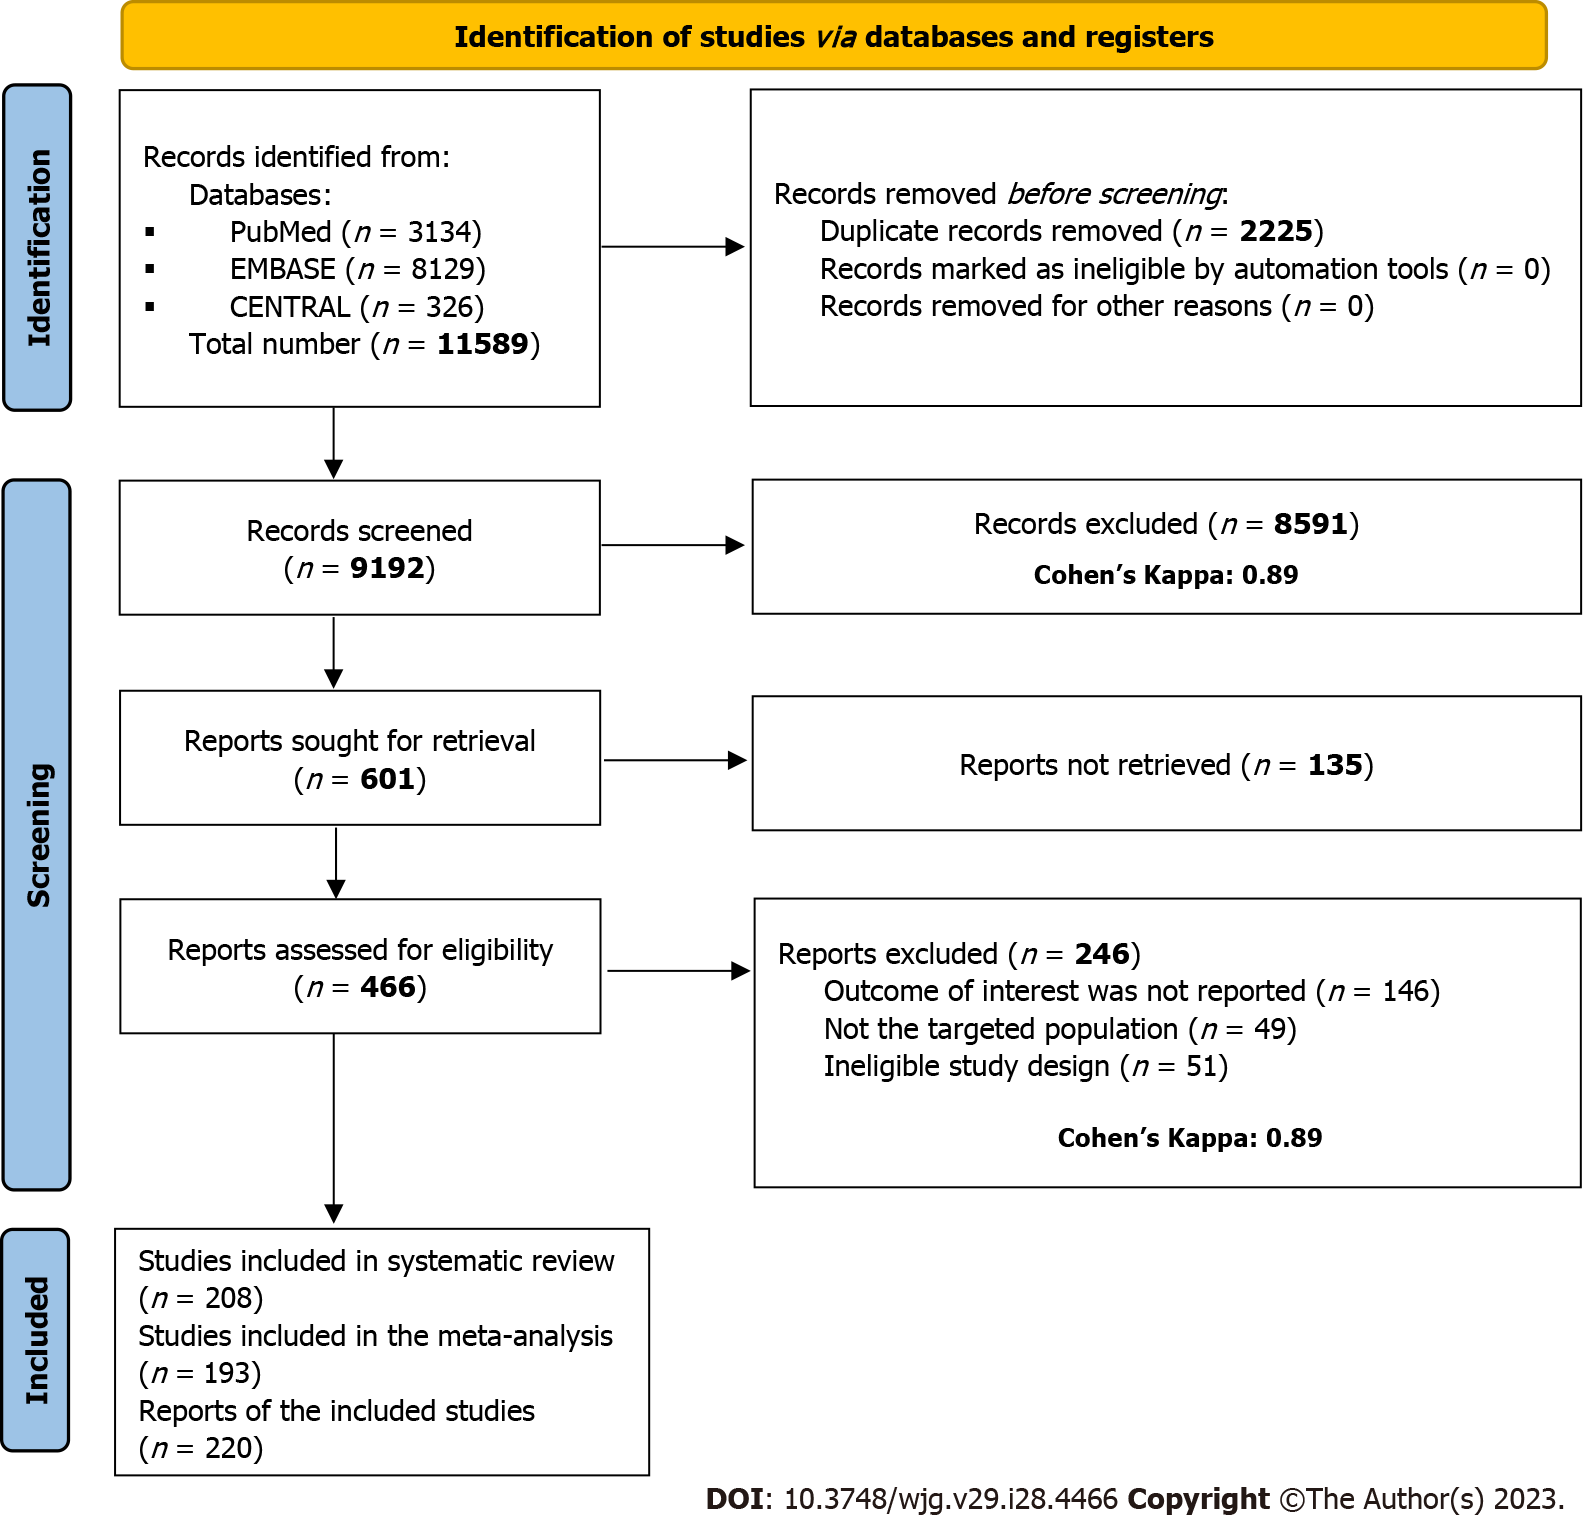
Figure 1 PRISMA 2020 flow chart of the screening and selection process of the studies.
Figure 2 Forest plot demonstrating the proportion rates for hemodynamic instability and shock in general gastrointestinal bleeding sources.
GIB: Gastrointestinal bleeding.
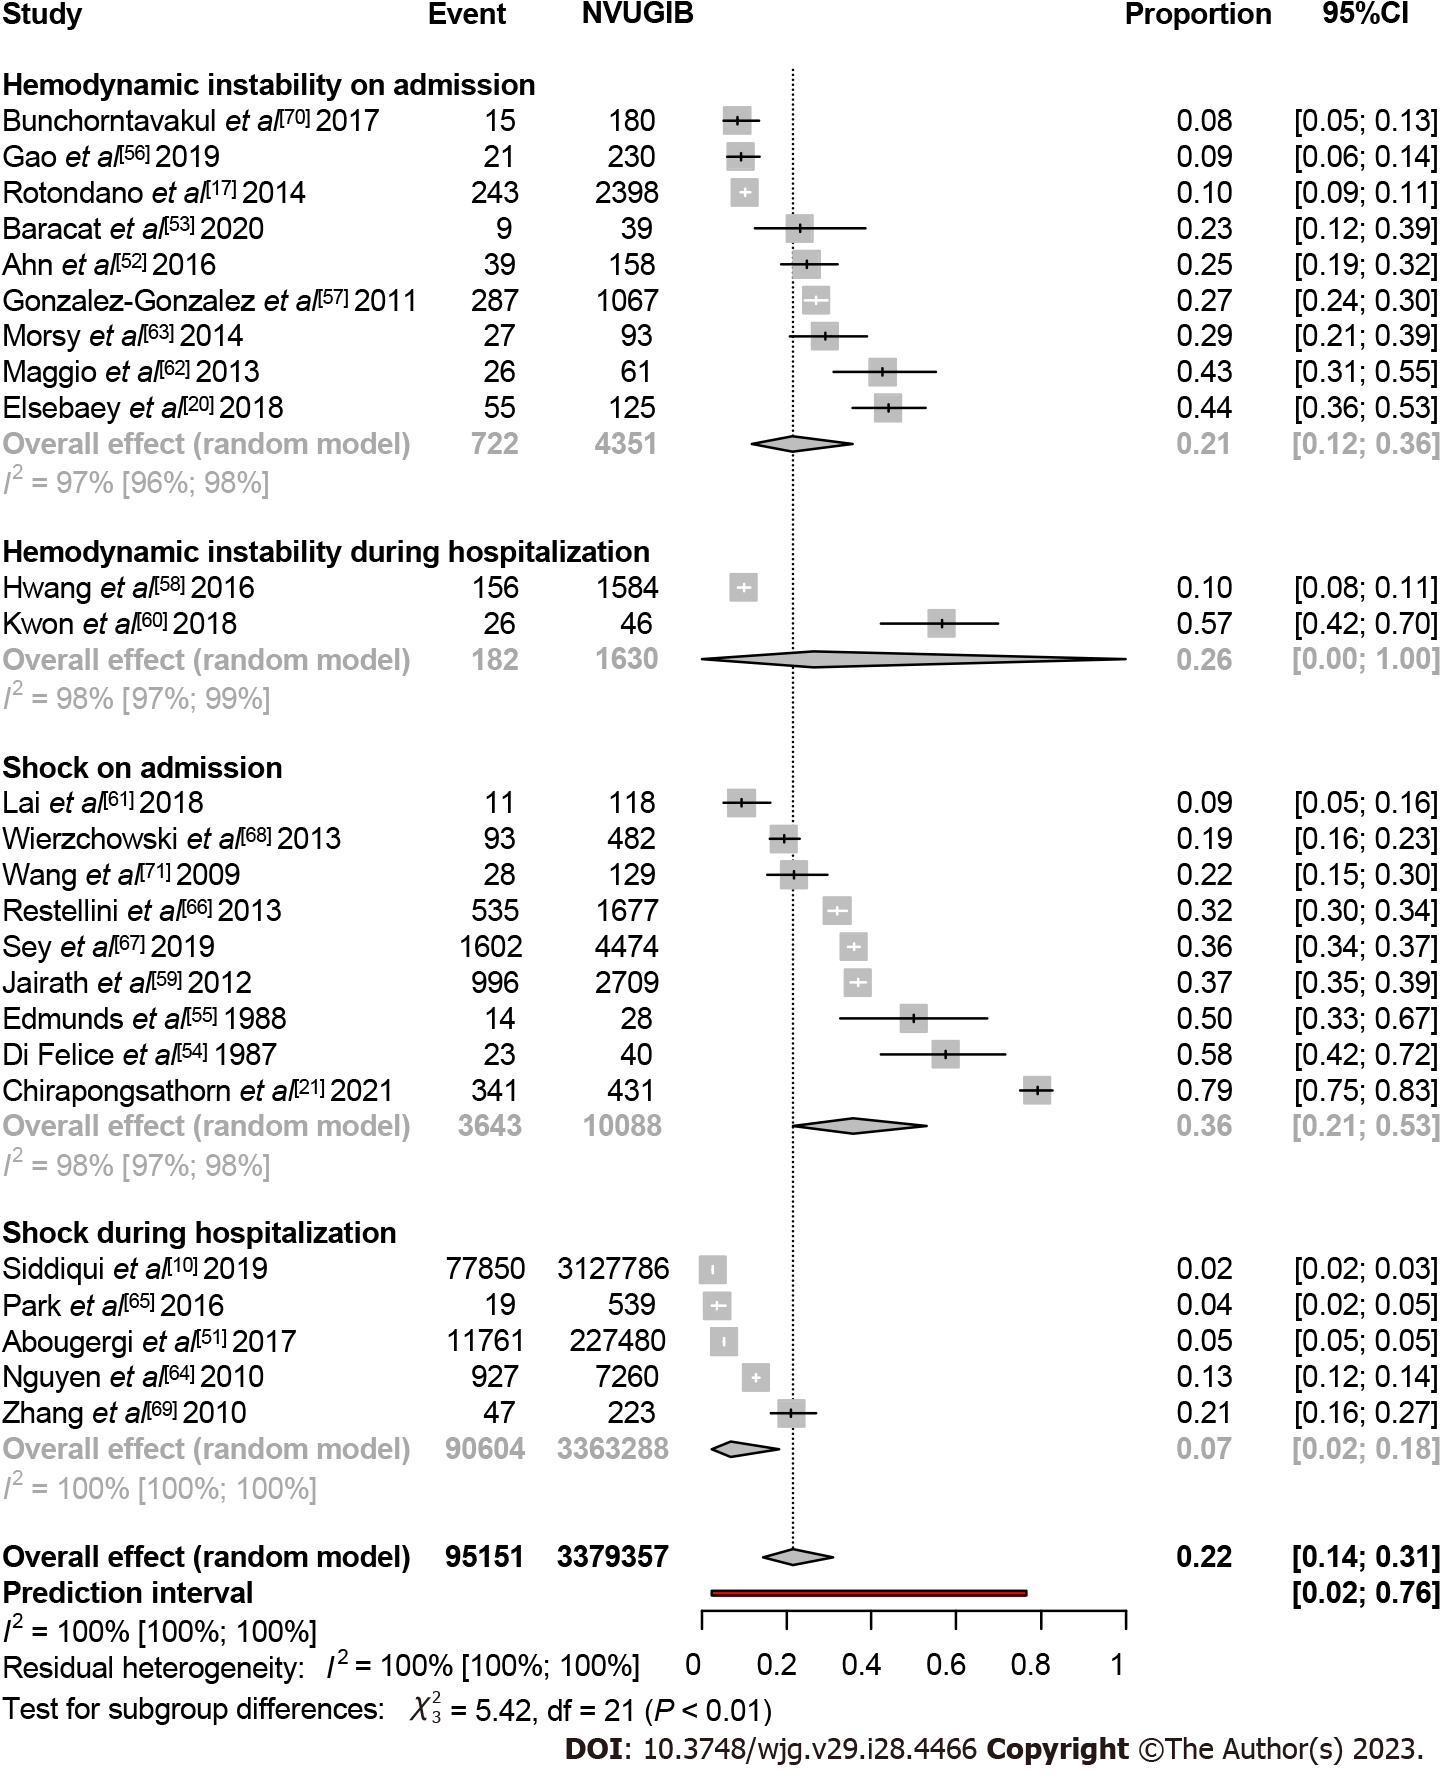
Figure 3 Forest plot demonstrating the proportion rates for hemodynamic instability and shock in non-variceal bleeding.
NVUGIB: Non-variceal upper gastrointestinal bleeding.
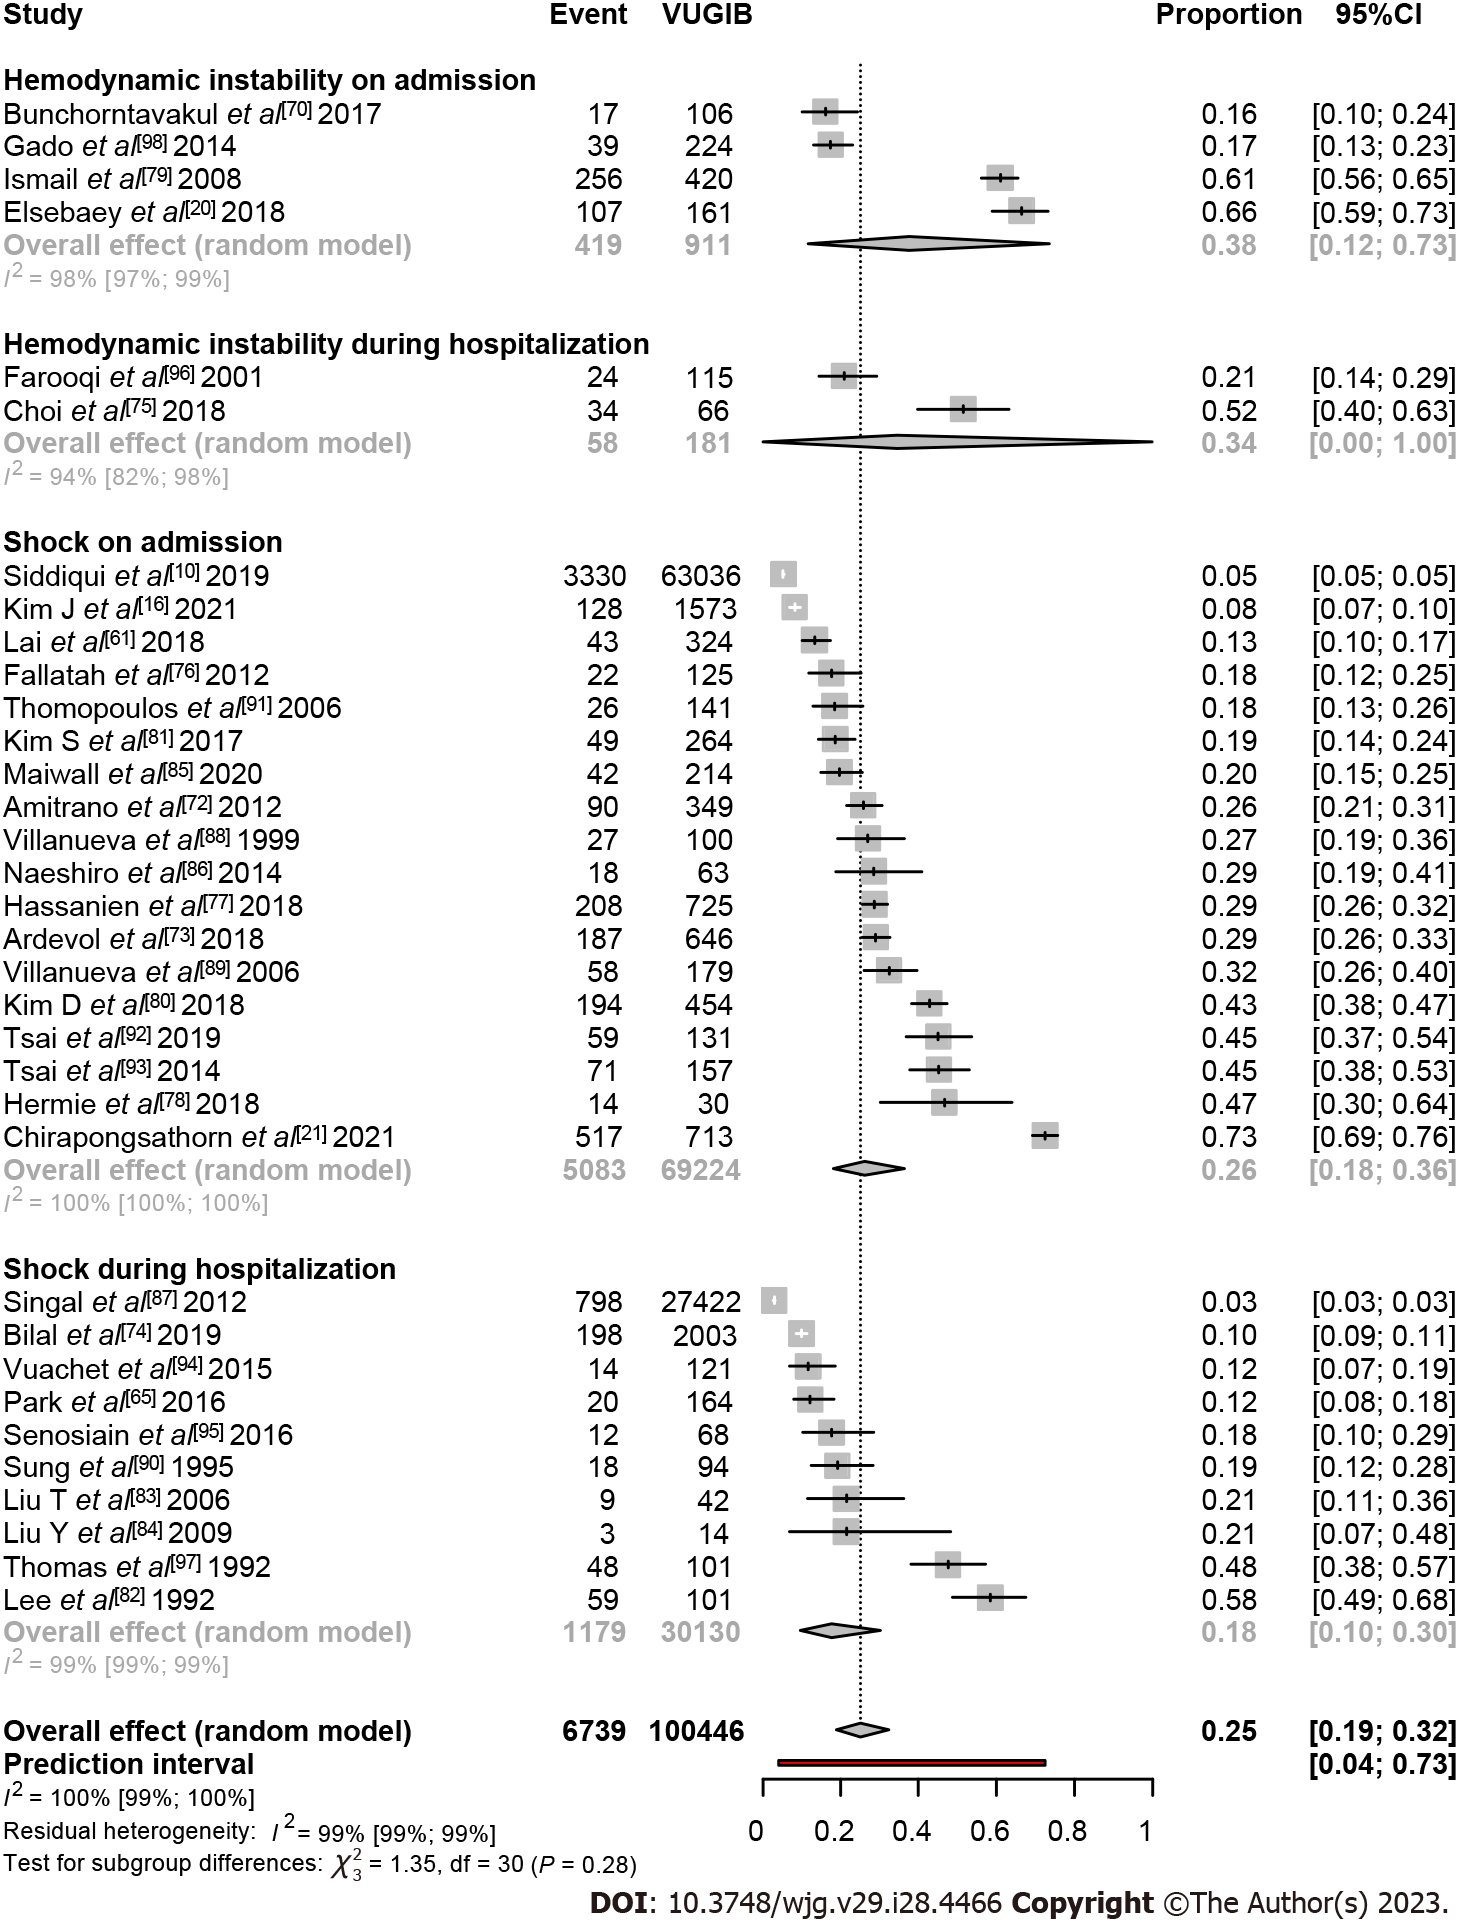
Figure 4 Forest plot demonstrating the proportion rates for hemodynamic instability and shock in variceal bleeding.
VUGIB: Variceal upper gastrointestinal bleeding.
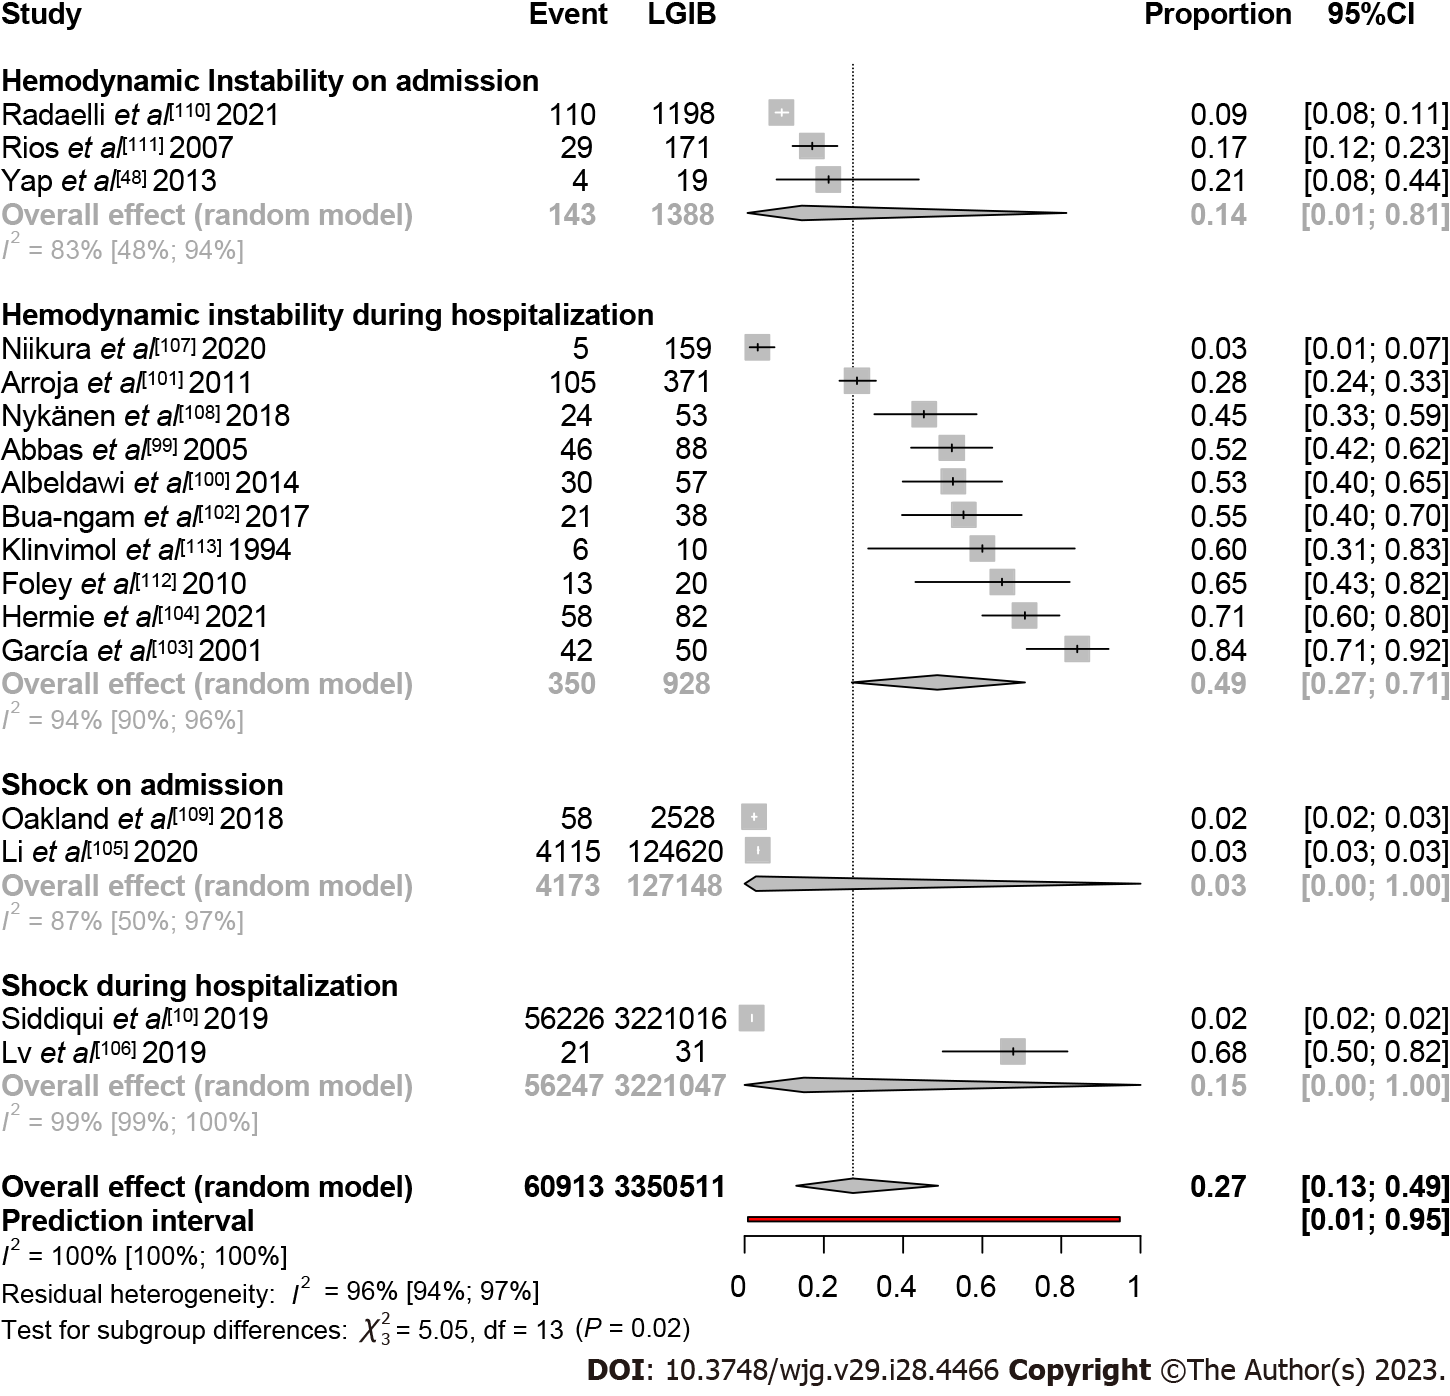
Figure 5 Forest plot demonstrating the proportion rates for hemodynamic instability and shock in lower gastrointestinal bleeding sources.
LGIB: Lower gastrointestinal bleeding.
- Citation: Obeidat M, Teutsch B, Rancz A, Tari E, Márta K, Veres DS, Hosszúfalusi N, Mihály E, Hegyi P, Erőss B. One in four patients with gastrointestinal bleeding develops shock or hemodynamic instability: A systematic review and meta-analysis. World J Gastroenterol 2023; 29(28): 4466-4480
- URL: https://www.wjgnet.com/1007-9327/full/v29/i28/4466.htm
- DOI: https://dx.doi.org/10.3748/wjg.v29.i28.4466


