©The Author(s) 2023.
World J Gastroenterol. Jul 7, 2023; 29(25): 4053-4071
Published online Jul 7, 2023. doi: 10.3748/wjg.v29.i25.4053
Published online Jul 7, 2023. doi: 10.3748/wjg.v29.i25.4053
Figure 1 Cholangiocarcinogenesis driven by cell cycle and Notch associated pathways.
A: Rank-based gene set enrichment analysis of genes preferentially activated in tumors identified the tumorigenic pathways, cell cycle and Notch from Hallmark gene sets, in CHOL transcriptome from TCGA database. Upper: Cell cycle associated pathways, including G2M checkpoint, E2F Targets, and Mitotic spindle gene sets; Lower: Notch associated pathways, including epithelial mesenchymal transition, Hedgehog, and apical junction gene sets. The mRNA expression levels from the leading edges of cell cycle (B) and Notch (C) associated pathways were analyzed in human normal bile ducts (n = 9) and CCA samples (n = 35) using TCGA database, suggesting up-regulation of cell cycle and Notch associated genes in CCA samples. TPM: Transcripts per kilobase million; Red: Cholangiocarcinoma (iCCA/eCCA), Blue: Normal bile ducts and/or para-cancerous liver; EMT: Rpithelial mesenchymal transition. cP < 0.001 when compared with the normal control.
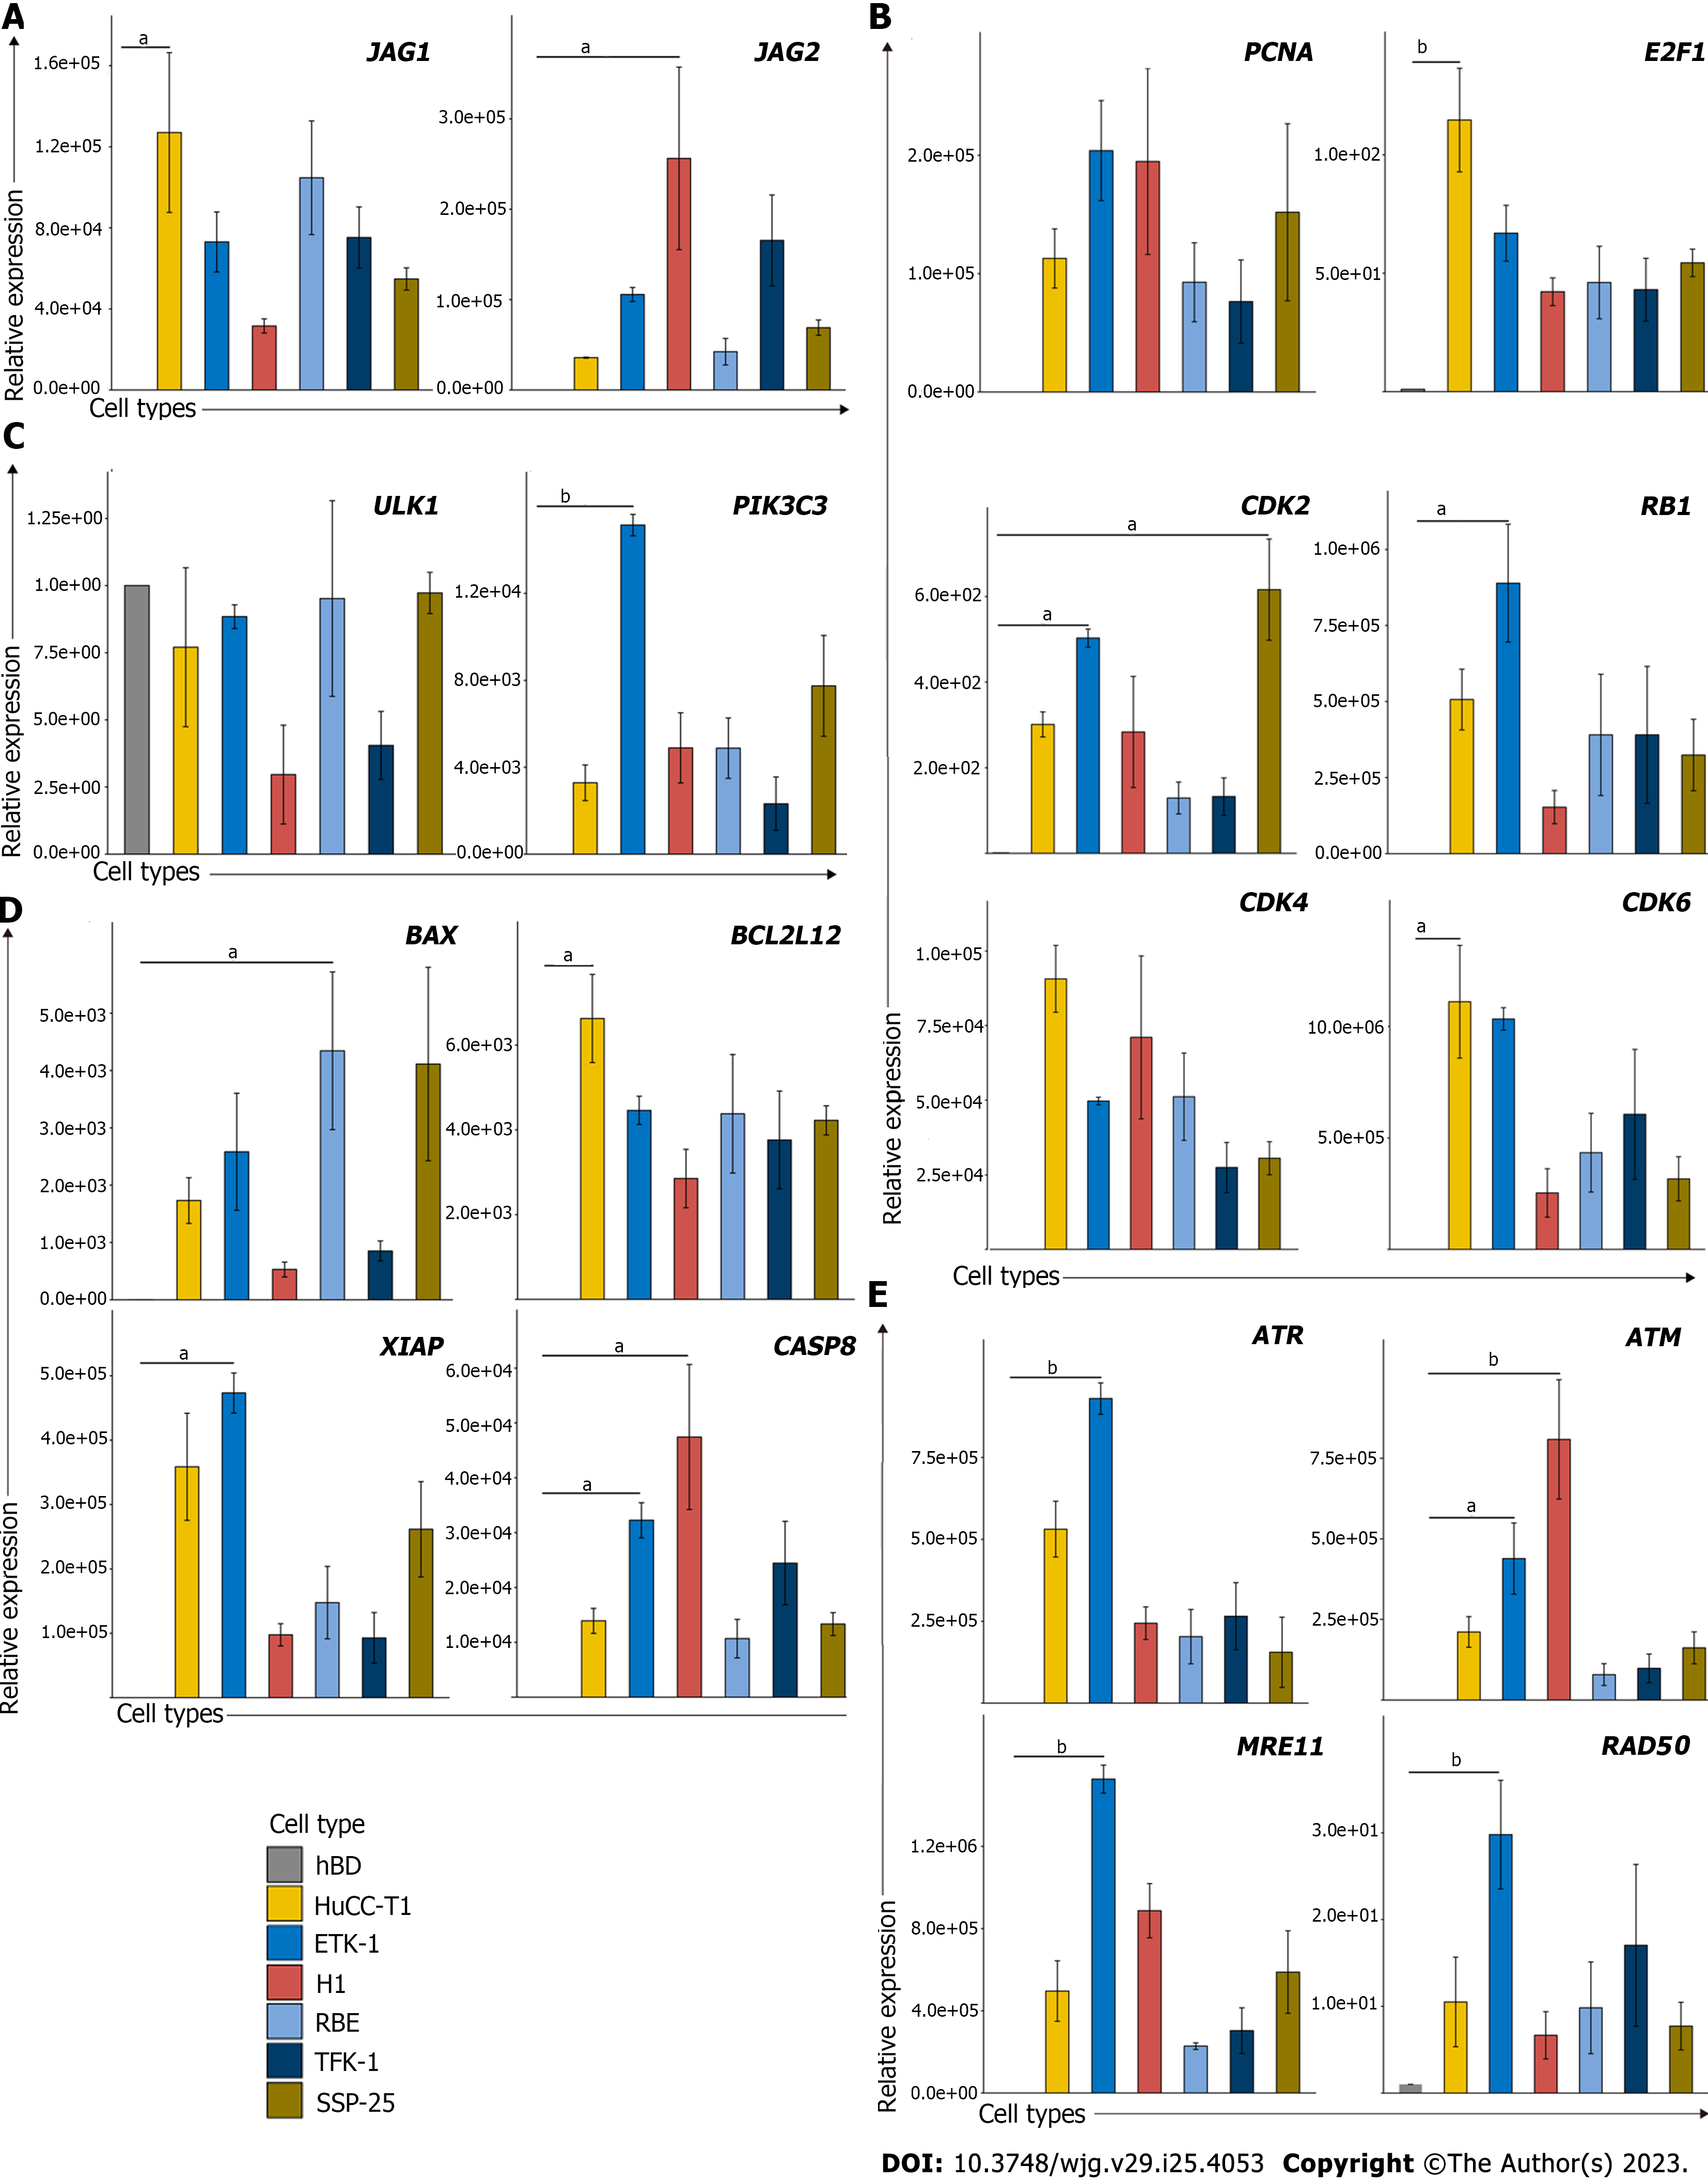
Figure 2 Cell cycle and Notch associated pathways are increased in cholangiocarcinoma cell lines in vitro.
The mRNA expression levels of leading-edge genes from (A) Notch, (B) cell cycle, (C) autophagy, (D) cell death, and (E) DNA damage were examined in cholangiocarcinoma (CCA) cell lines compared to normal biliary epithelial cells (hBD), indicating up-regulation of these genes in CCA tumor samples. CCA tumor cell lines including HuCCT1, ETK-1, H1, RBE, TFK-1 and SSP25. Data are relative to hBD cell line and normalized to 18S rRNA.
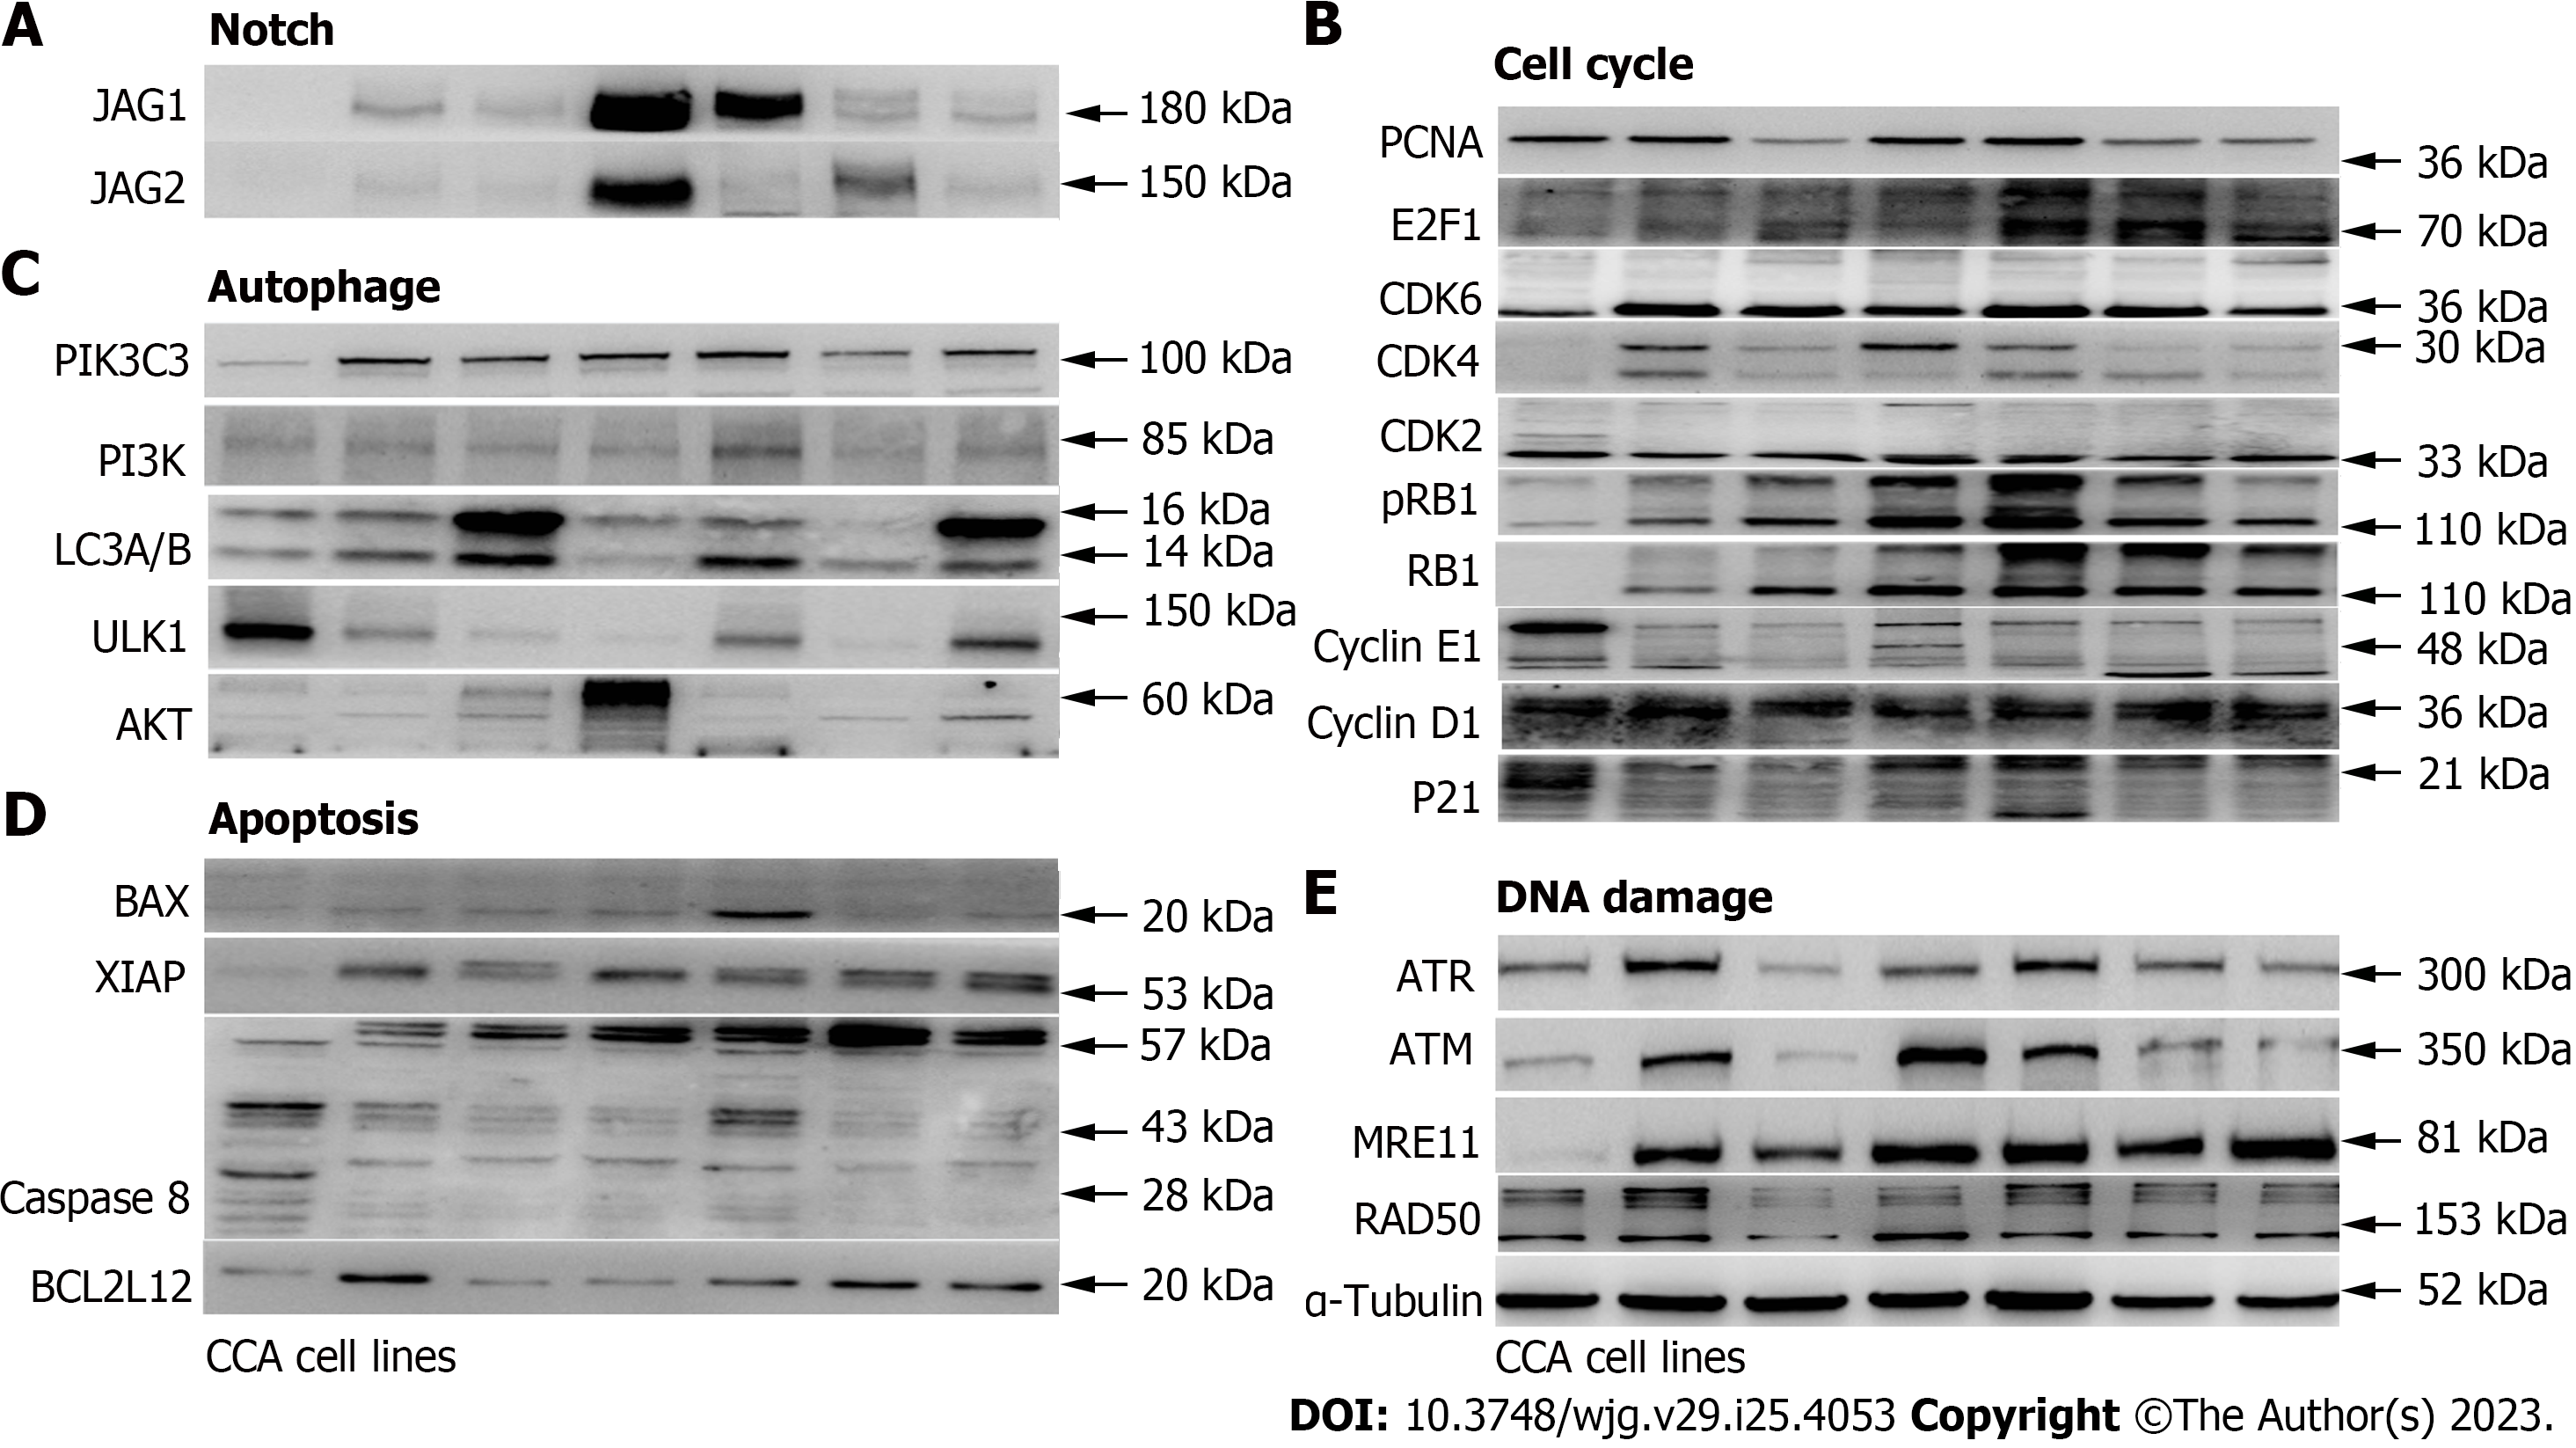
Figure 3 The cell cycle and Notch pathway associated protein expression levels are up-regulated in cholangiocarcinoma cell lines compared to the normal human bile duct cells.
The protein expression levels of leading-edge genes from (A) Notch, (B) cell cycle, (C) autophagy, (D) cell death, and (E) DNA damage were determined in cholangiocarcinoma (CCA) cell lines compared to hBD. Several cell cycle and Notch associated genes, including CDK4, CDK6, E2F1, JAG1, and JAG2, were up-regulated in CCA cell lines. CCA tumor cell lines including HuCCT1, ETK-1, H1, RBE, TFK-1 and SSP25. α-Tubulin served as the loading control.
Figure 4 Validation of the identified cell cycle and Notch associated genes in the triple transgenic cholangiocarcinoma mouse model.
A: The cartoon diagram of the genetically engineered mouse modeling (GEM) strategies. Triple transgenic mice bearing Albumin-Cre transgene, LSL-KrasG12D, and floxed-p53 were conditionally activated KrasG12D and heterozygous knocked out P53 in the liver. B: The genotyping data presenting positive Cre (red triangle), KrasG12D (blue triangle), and homozygous floxed P53 genes (green triangle). C: The gross image of representative tumor (upper right, scale bar = 5 mm), and the corresponding histopathology (lower right, scale bar = 100 μm) with inset showing glandular appearance (arrow, scale bar = 20 μm). D: Histology of human bile duct
(upper, scale bar = 100 μm) with inset showing biliary epithelium (arrow, scale bar = 20 μm), and cholangiocarcinoma (lower, scale bar = 100 μm) with inset showing mitotic figure (arrowhead, scale bar = 20 μm) and glandular appearance (arrow, scale bar = 20 μm). E: The protein expression levels of leading-edge genes from cell cycle and Notch associated pathways, and genes involved in autophagy, cell death and DNA damage in CCA tumor tissues from the GEM (50 wk) compared to the normal bile ducts of control mice (50 wk). GAPDH was used as the loading control.
Figure 5 Targeting cell cycle and Notch pathways inhibited cell growth of human cholangiocarcinoma cell lines.
Growth curves of three cholangiocarcinoma cell lines with different genetic background, e.g., HuCCT1 (KRAS and P53 mutations), RBE (IDH1 mutation), and H1, treated with cell cycle and Notch inhibitors, respectively. For targeting cell cycle pathways, (A) D1-dependent CDK4 inhibitor Arcyriaflavin a, (B) pan-CDK inhibitor Flavopiridol, (C) selected CDK inhibitor Roscovitine were utilized, and (D) the γ-secretase inhibitor (DAPT) was used against Notch pathway. Absorbance at OD570 nm and 650 nm analyzed by MTT, and then normalized to vehicle control (0.1% DMSO or the corresponding medium; n = 6 wells/dose point). The relative cell proliferation rates were calculated as OD570 - OD650. aP < 0.05, bP < 0.01, and cP < 0.001 when compared with the vehicle control at day 7.
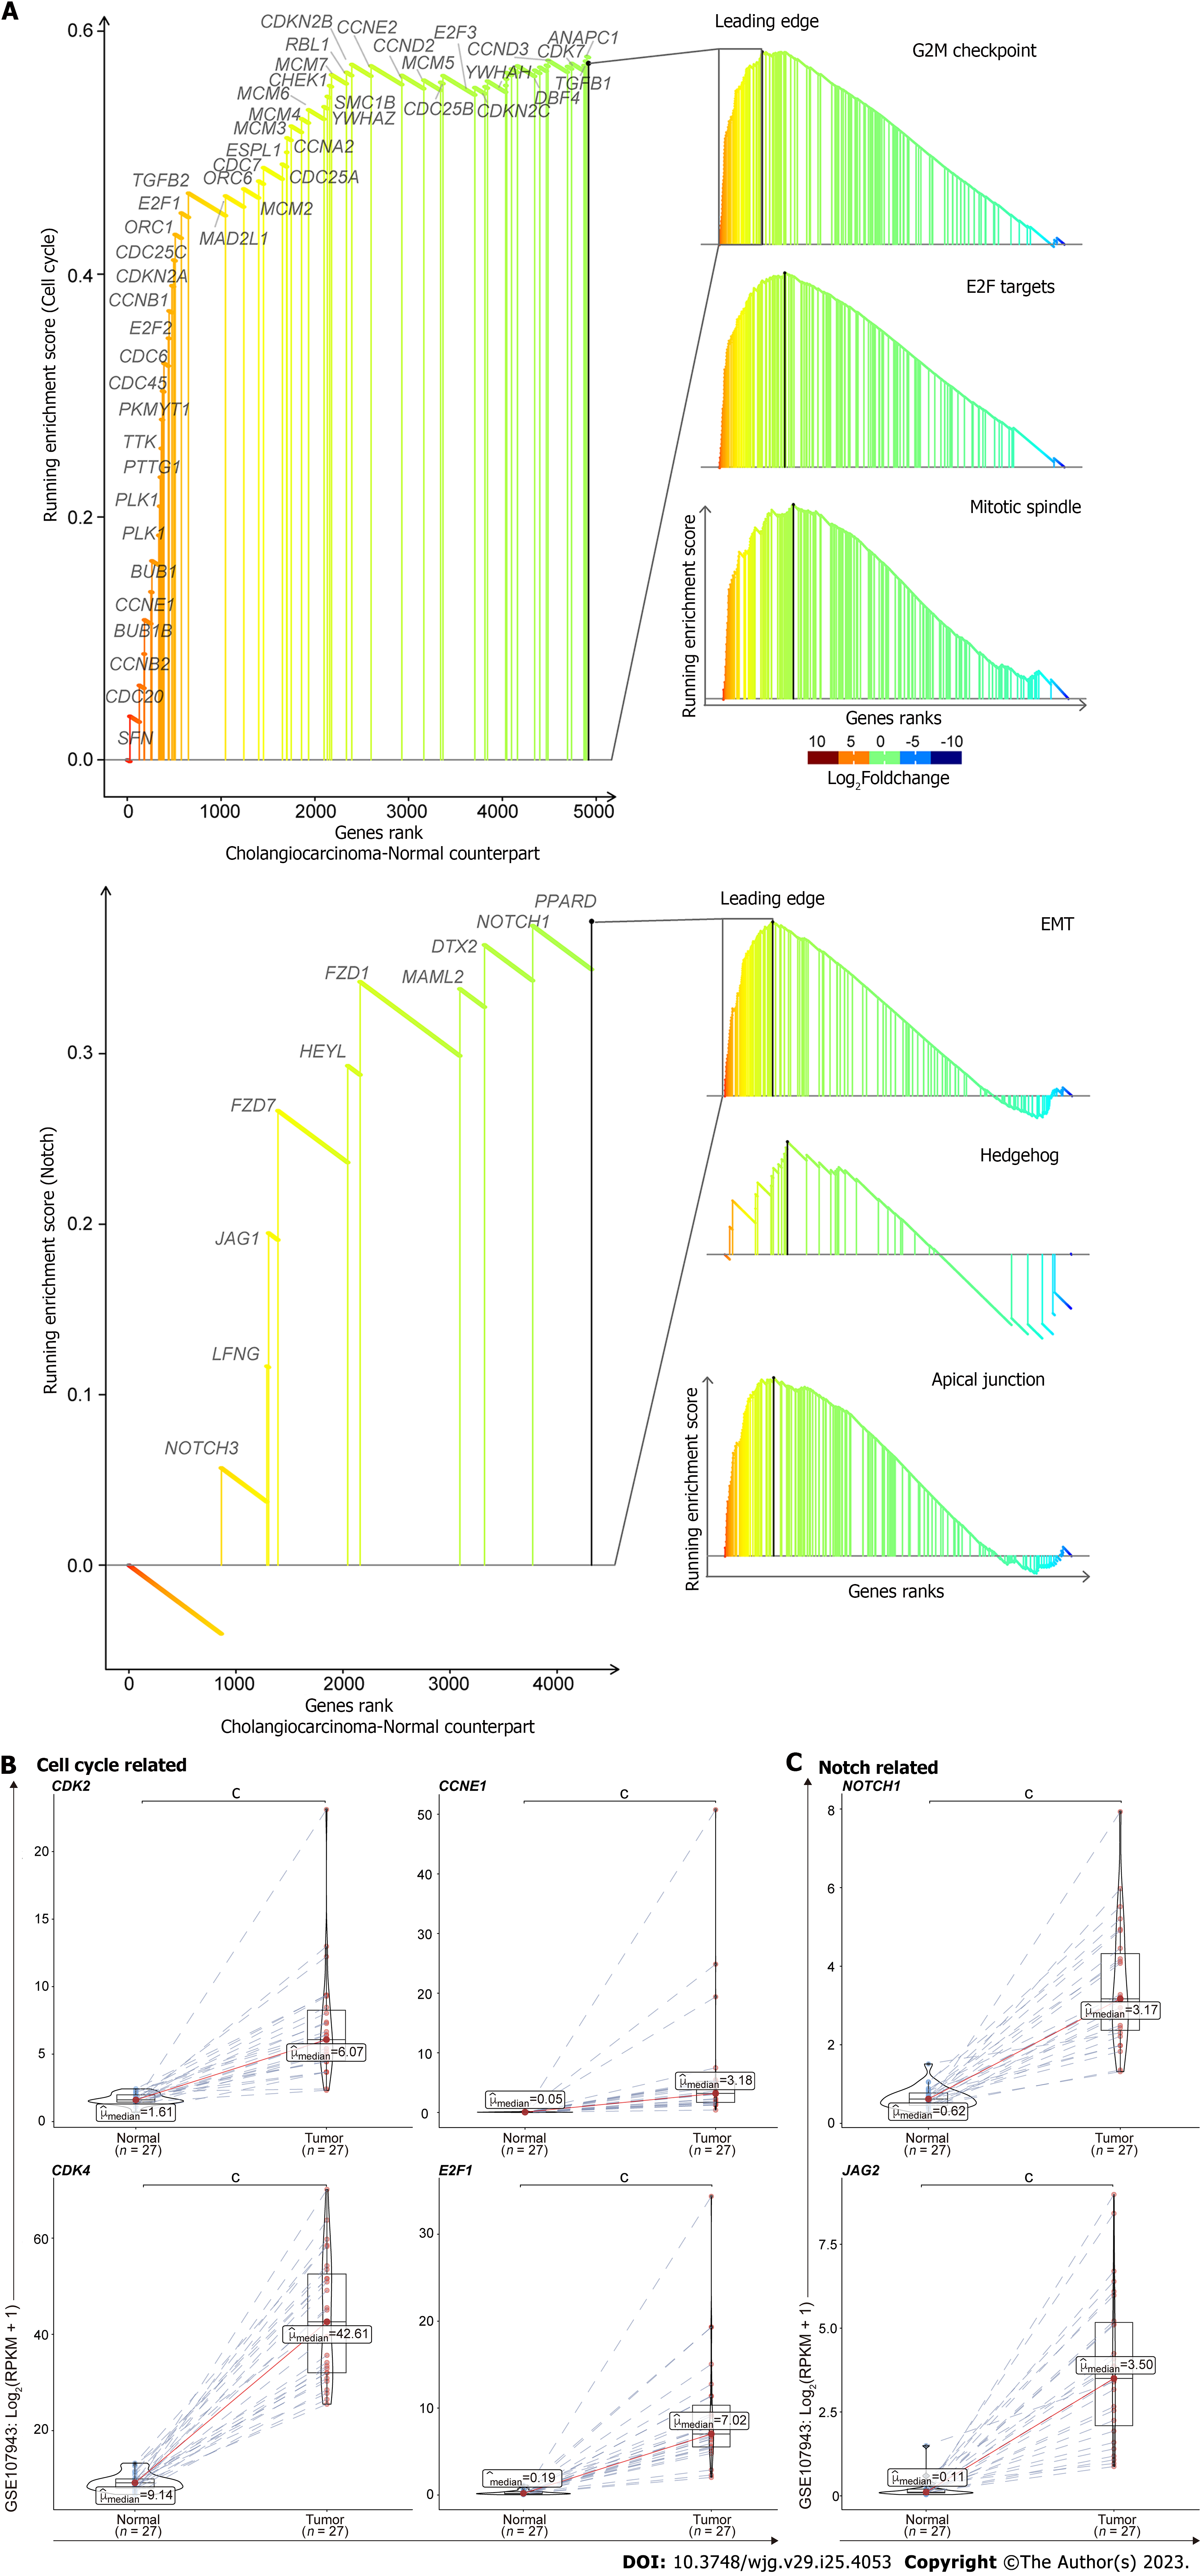
Figure 6 The generalizable oncogenic traits of cell cycle and Notch associated pathways in cholangiocarcinoma.
GSEA identified cell cycle and Notch associated pathways significantly activated in tumors compared to the corresponding adjacent normal livers from GEO database (GSE107943) (A). Upper: Cell cycle associated pathways, including G2M checkpoint, E2F Targets, and Mitotic spindle gene sets; lower: Notch associated pathways, including epithelial mesenchymal transition, Hedgehog, and apical junction gene sets. The mRNA expression levels from the leading edges of cell cycle (B) and Notch (C) associated pathways were analyzed in CCA samples compared to the corresponding adjacent normal livers (pairs = 27). RPKM: Reads per kilobase million; Red: Intrahepatic cholangiocarcinoma; Blue: Para-cancerous normal liver; cP < 0.001 when compared with the relevant normal control.
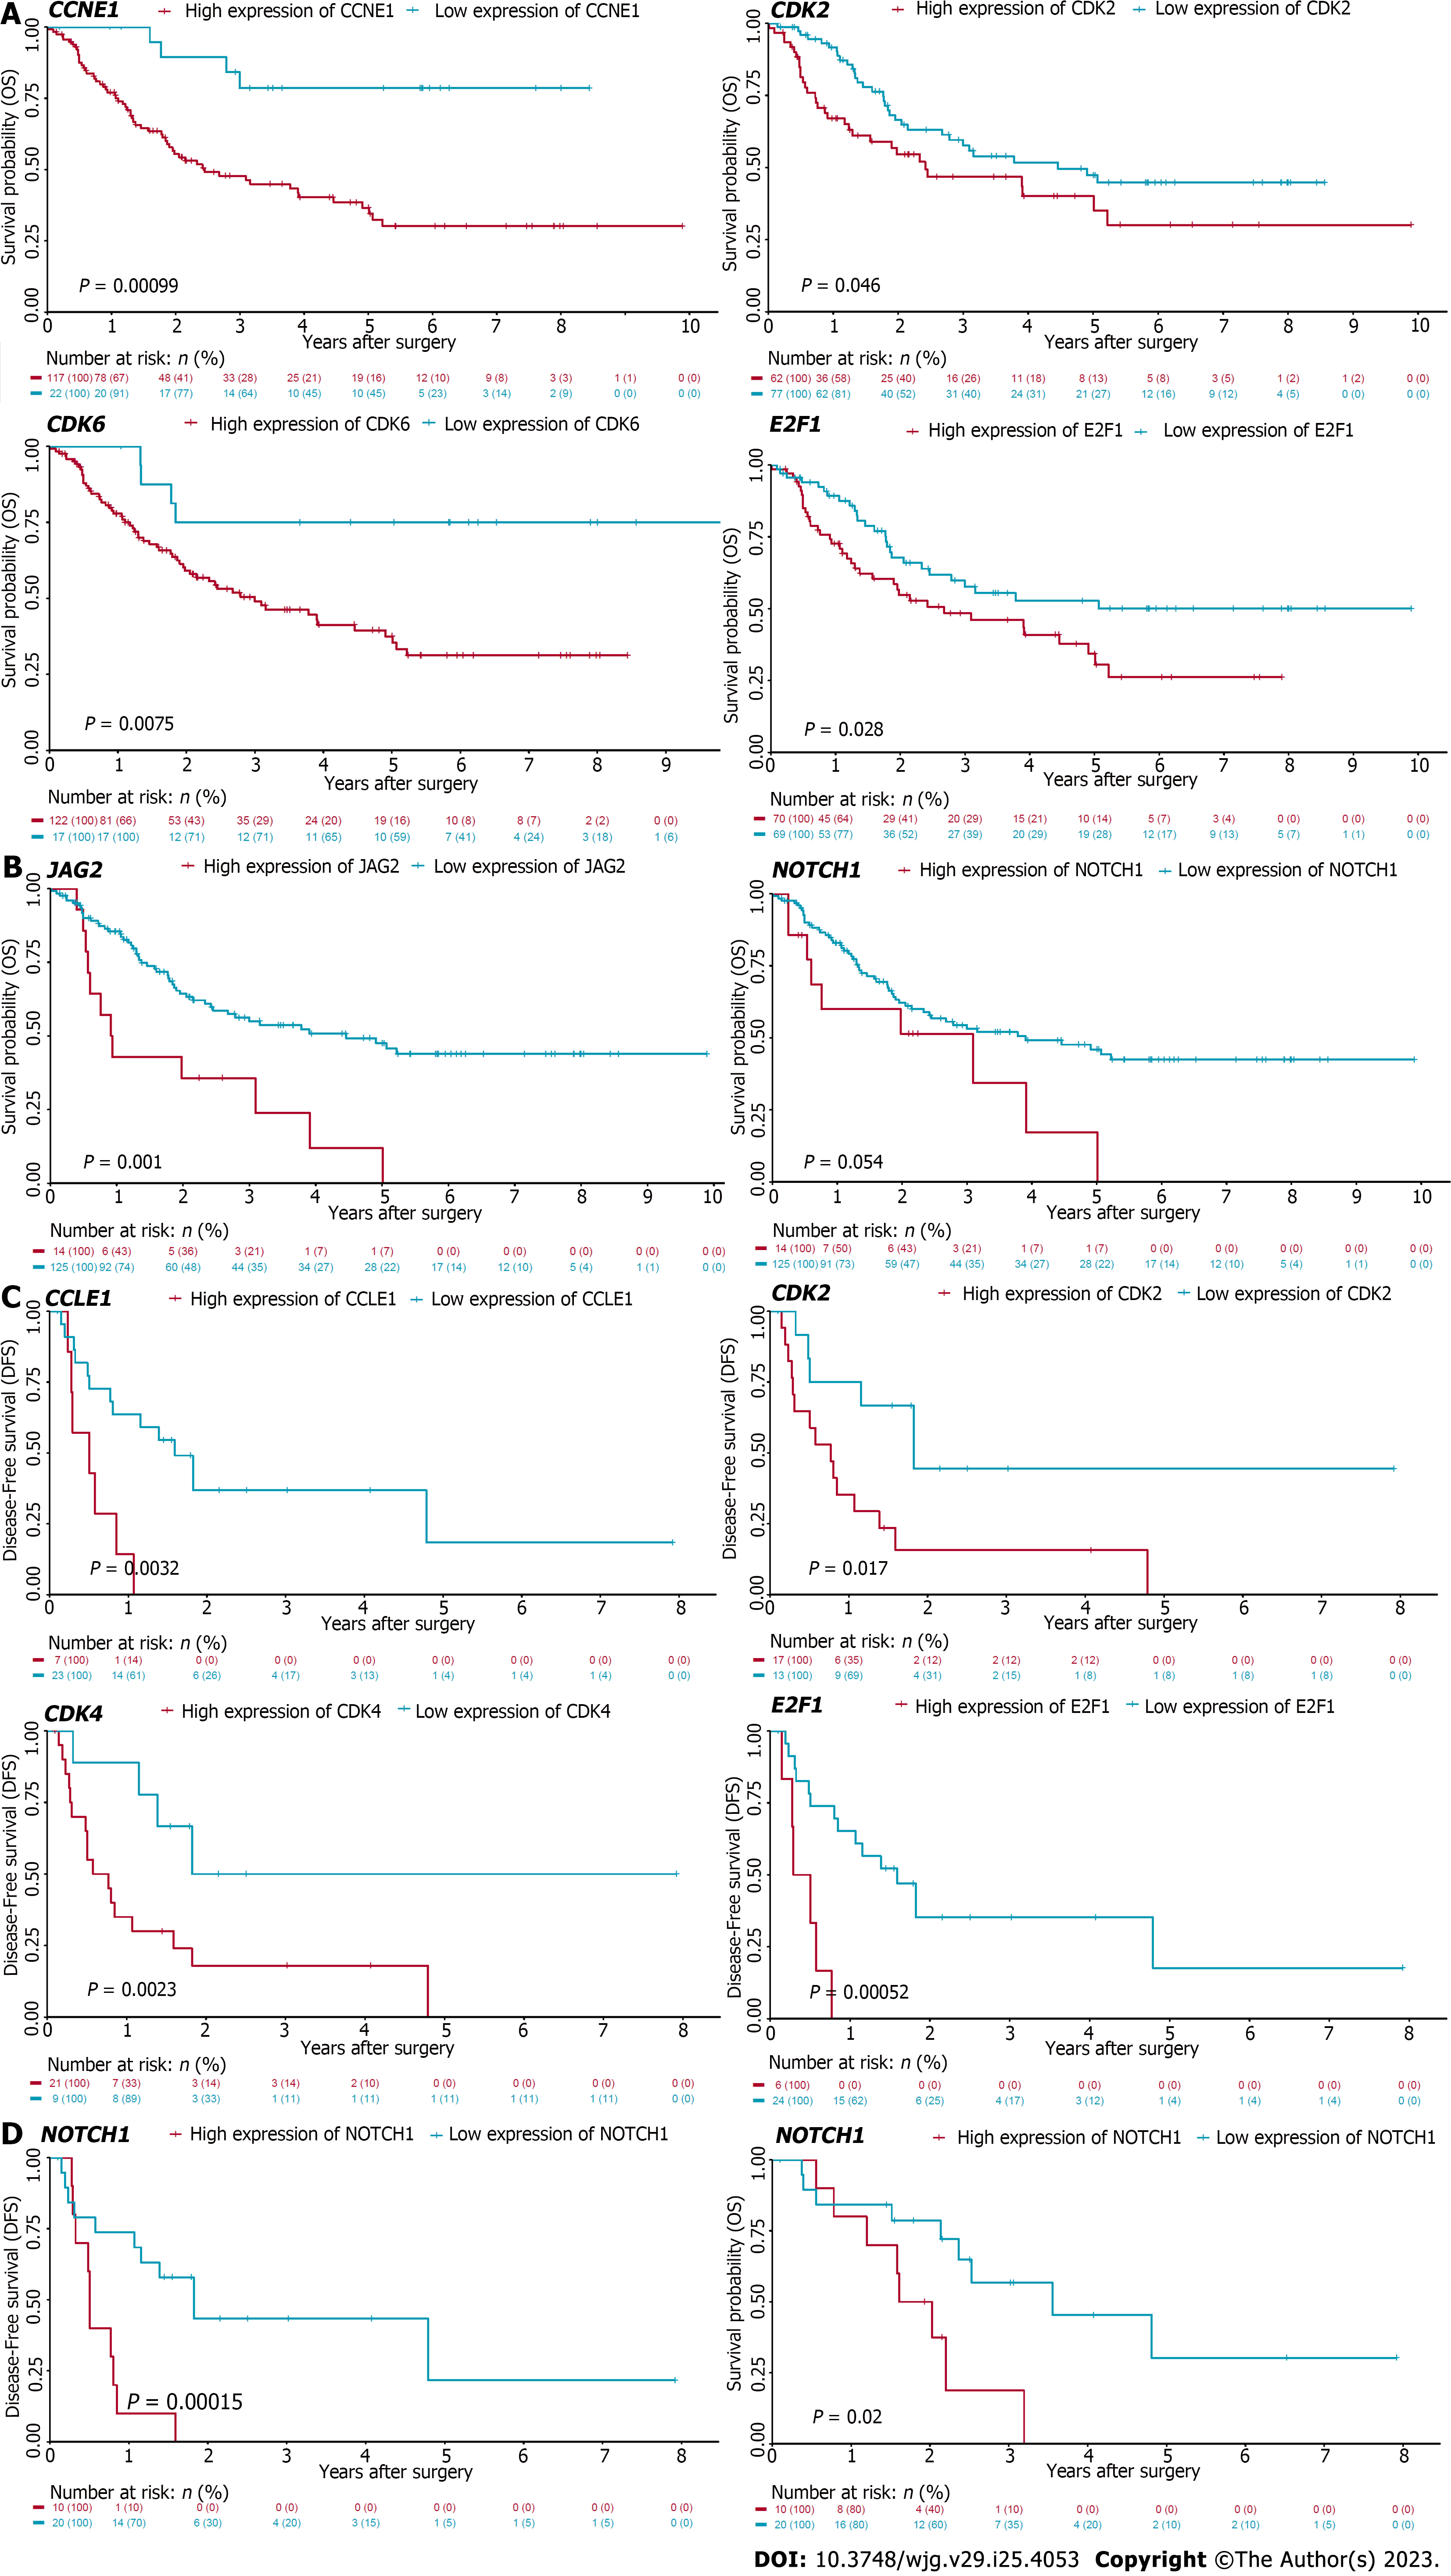
Figure 7 Cell cycle and Notch associated genes correlate with dismal survival in patients with cholangiocarcinoma.
Kaplan-Meier analysis of cholangiocarcinoma patients in EBI-EGAD00001001076 (A and B) and GSE107943 (C and D) database. The optimal cutoff of genes from the leading edges of cell cycle (A and C) and Notch (B and D) associated pathways was calculated by maximally selected rank statistics. And then the difference between two groups was analyzed by log-rank test. Red: Higher expression of the indicated genes, Blue: Lower expression of indicated genes; DFS: Disease-free survival, OS: Overall survival.
Figure 8 The summary of dysregulated cell cycle and Notch pathways in cholangiocarcinoma progression.
The cholangiocarcinogenesis driven by aberrant cell cycle and Notch pathways, which may be targeted by small molecular inhibitors.
- Citation: Liu D, Shi Y, Chen H, Nisar MA, Jabara N, Langwinski N, Mattson S, Nagaoka K, Bai X, Lu S, Huang CK. Molecular profiling reveals potential targets in cholangiocarcinoma. World J Gastroenterol 2023; 29(25): 4053-4071
- URL: https://www.wjgnet.com/1007-9327/full/v29/i25/4053.htm
- DOI: https://dx.doi.org/10.3748/wjg.v29.i25.4053


