Copyright
©The Author(s) 2023.
World J Gastroenterol. Jun 21, 2023; 29(23): 3678-3687
Published online Jun 21, 2023. doi: 10.3748/wjg.v29.i23.3678
Published online Jun 21, 2023. doi: 10.3748/wjg.v29.i23.3678
Figure 1 Scatter plot illustrating the correlation.
A: Scatter plot illustrating the correlation between lymphocyte-to-white blood cell ratio (LWR) and Child-Turcotte-Pugh scores; B: Scatter plot illustrating the correlation between LWR and model for end-stage liver disease scores; C: Scatter plot illustrating the correlation between LWR and Chinese group on the study of severe Hepatitis B-Acute-on-chronic liver failure II scores. CTPs: Child-Turcotte-Pugh score; MELDs: Model for end-stage liver disease score; COSSHACLFIIs: Chinese group on the study of severe Hepatitis B-Acute-on-chronic liver failure II score; LWR: Lymphocyte-to-white blood cell ratio.
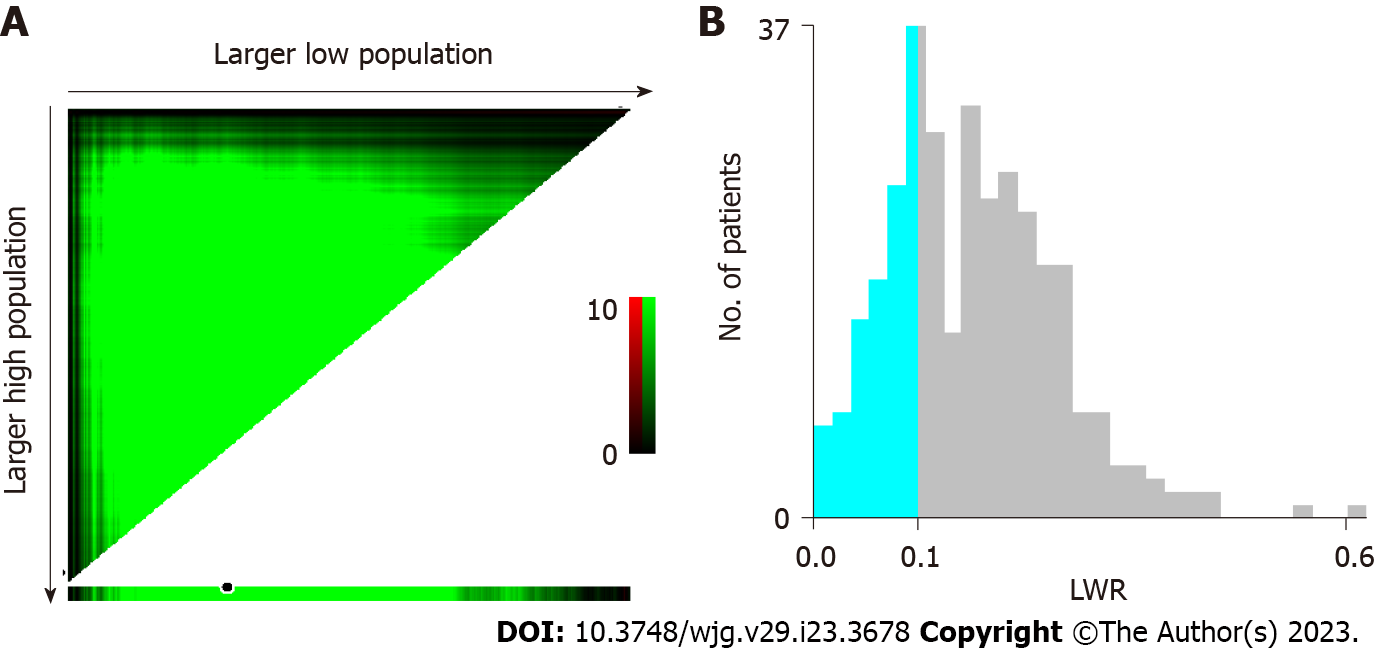
Figure 2 Analysis of lymphocyte-to-white blood cell ratio by using X-tile.
A: The data on the horizontal ordinate increase from the left to the right, defined as the larger low population. The data on the vertical ordinate decrease from the top to the bottom, defined as the larger high population; B: The prognostic significance of lymphocyte-to-white blood cell ratio for hepatitis B virus-acute on chronic liver failure patients was determined by using a statistical algorithm in X-tile to calculate the most efficient cutoff point. LWR: Lymphocyte-to-white blood cell ratio.
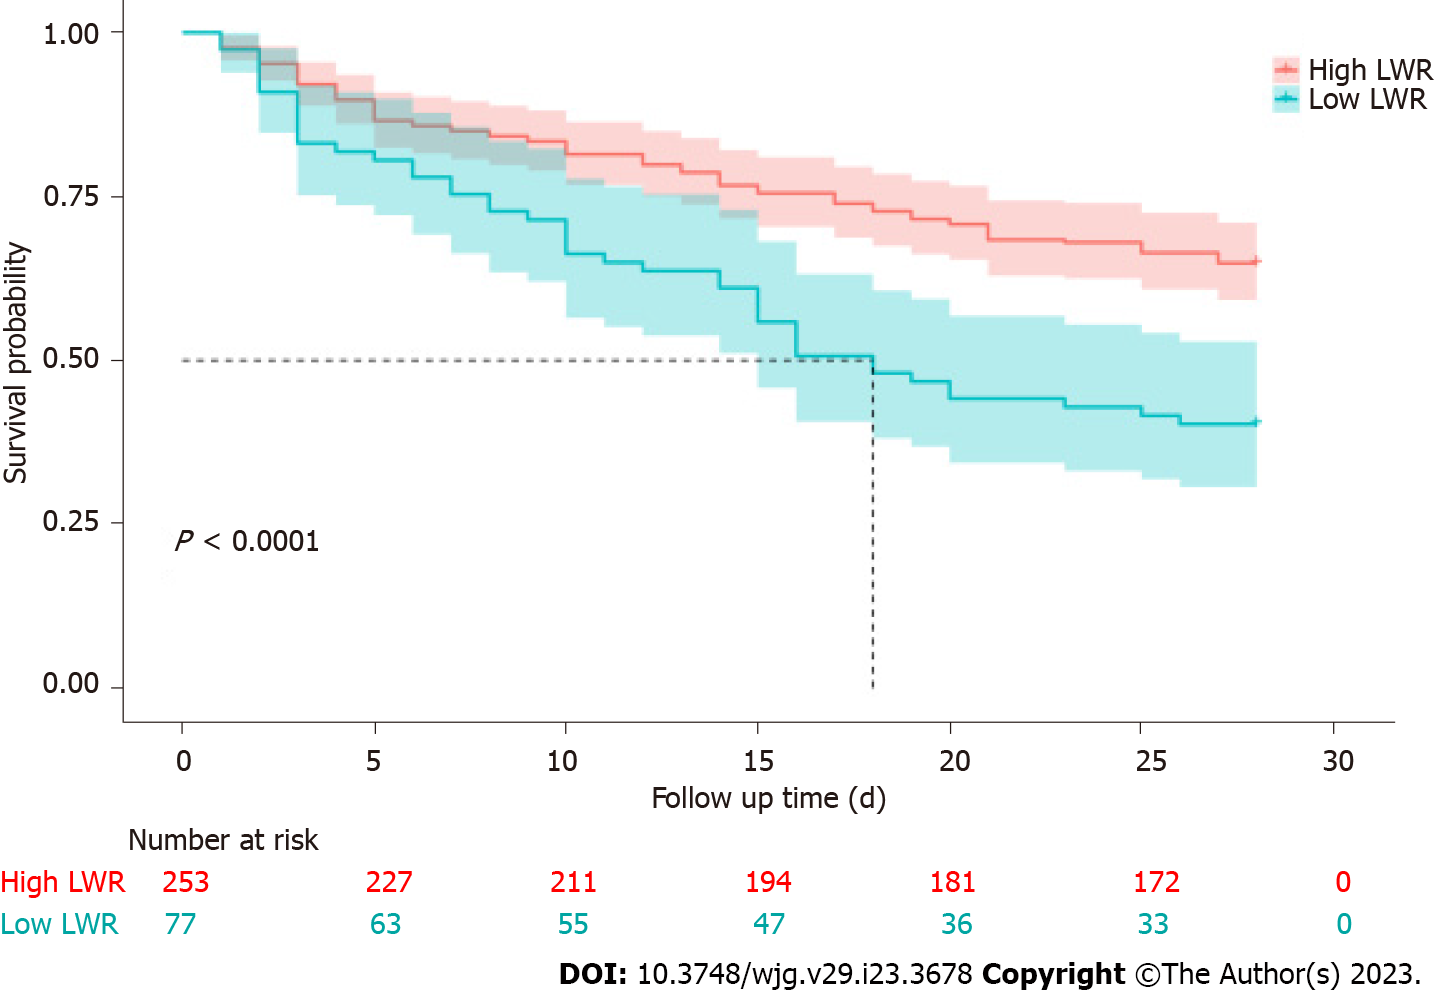
Figure 3 Kaplan-Meier analysis of 28-d overall survival.
The mortality rate was higher in patients with lymphocyte-to-white blood cell ratio (LWR) < 0.11 than in patients with LWR ≥ 0.11. LWR: Lymphocyte-to-white blood cell ratio.
- Citation: Zhang Y, Chen P, Zhu X. Lymphocyte-to-white blood cell ratio is associated with outcome in patients with hepatitis B virus-related acute-on-chronic liver failure. World J Gastroenterol 2023; 29(23): 3678-3687
- URL: https://www.wjgnet.com/1007-9327/full/v29/i23/3678.htm
- DOI: https://dx.doi.org/10.3748/wjg.v29.i23.3678


