©The Author(s) 2022.
World J Gastroenterol. Feb 7, 2022; 28(5): 547-569
Published online Feb 7, 2022. doi: 10.3748/wjg.v28.i5.547
Published online Feb 7, 2022. doi: 10.3748/wjg.v28.i5.547
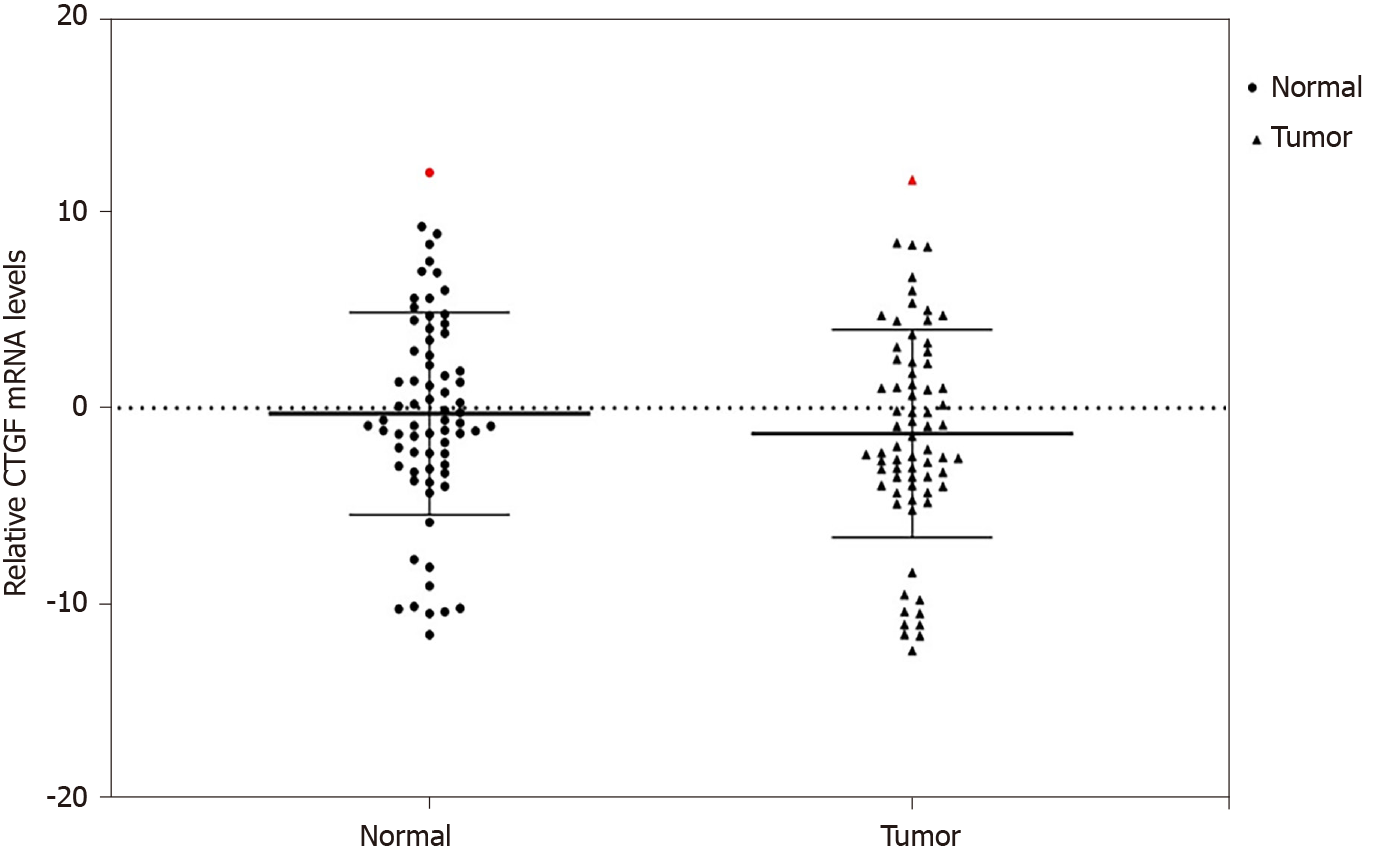
Figure 1 Quantitative real-time polymerase chain reaction analysis of connective tissue growth factor mRNA across the colorectal cancer tissues and their adjacent normals (n = 71).
mRNA: Messenger RNA; CTGF: Connective tissue growth factor.
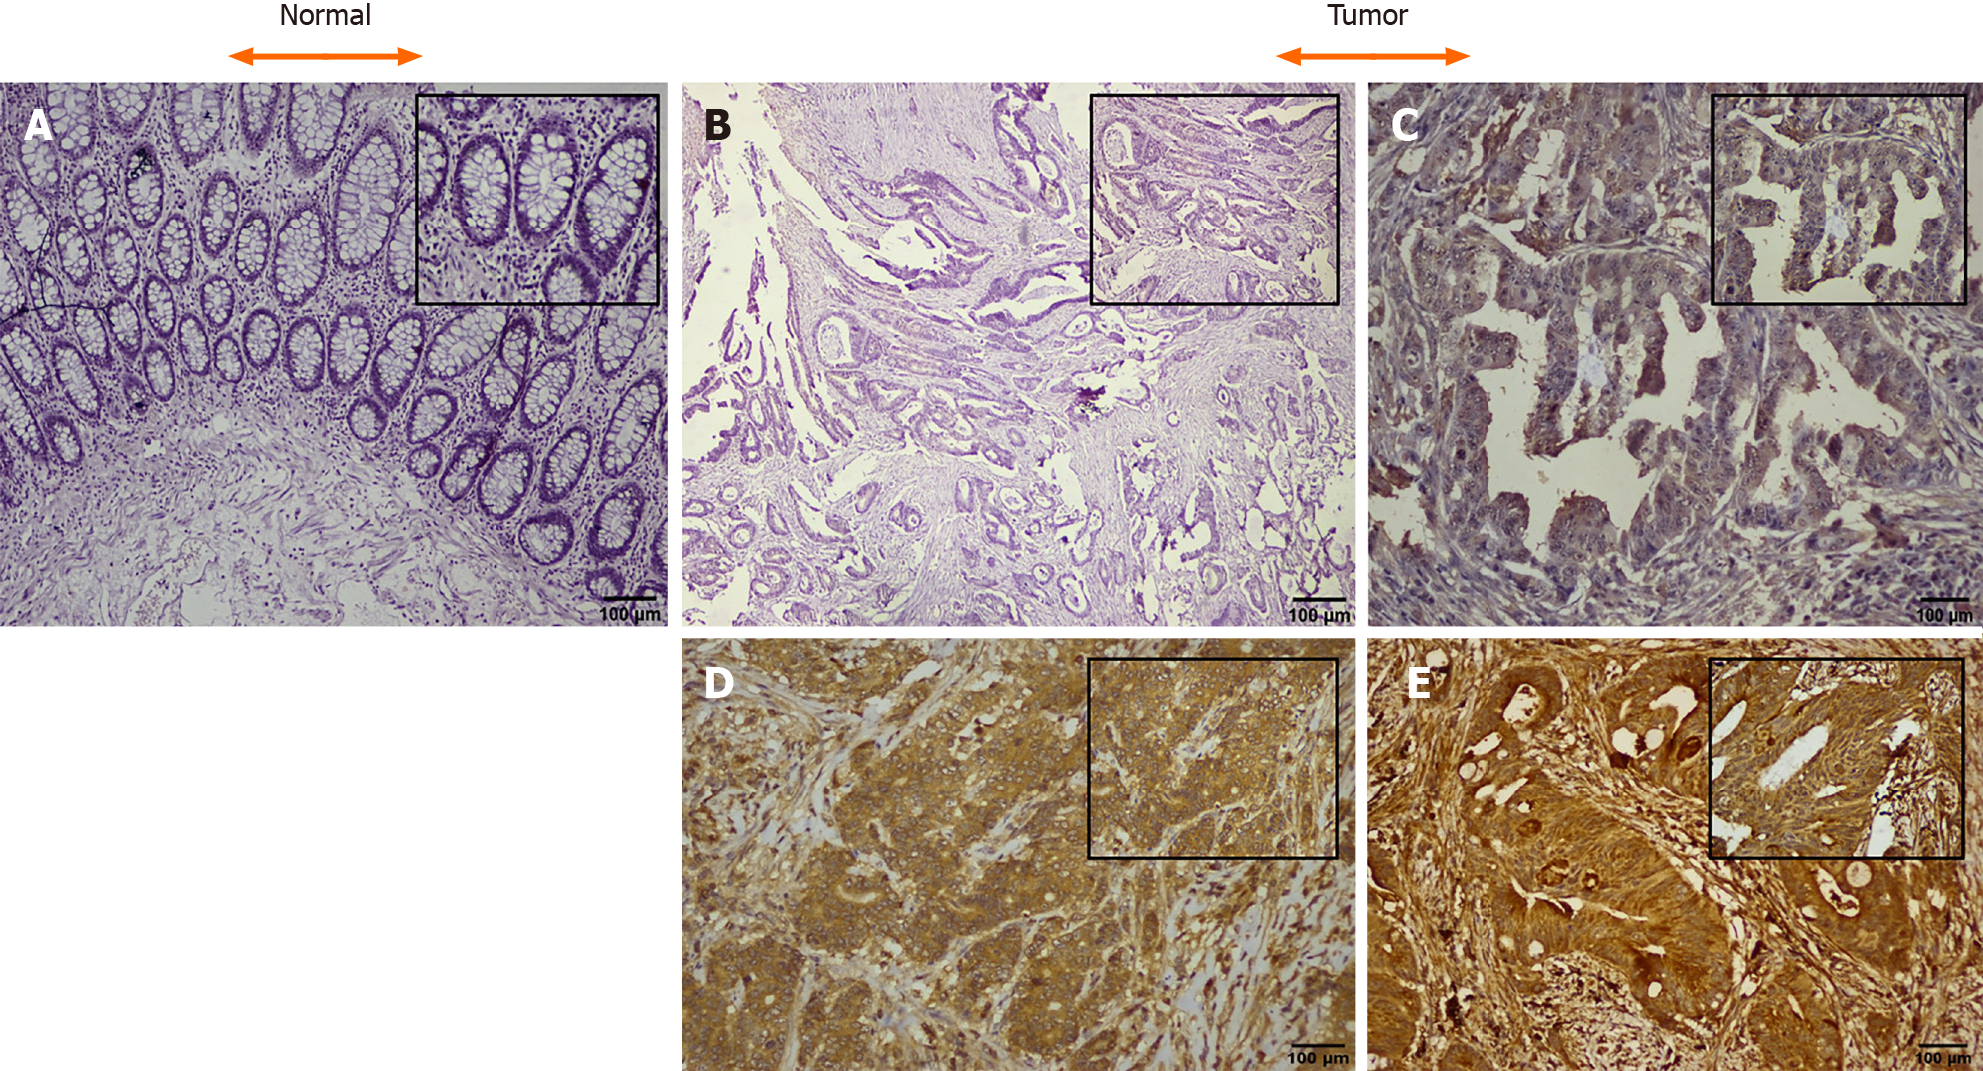
Figure 2 Representative images of immunohistochemical expression of the connective tissue growth factor protein in colorectal cancer and adjacent normal (H & E and DAB Chromogen × 100 insect × 400).
A: Negative control; B: Tumor negative staining; C: Tumor + 1, weak staining; D: Tumor + 2, moderate staining; E: Tumor + 3, strong staining. Scale bars: 100 μM.
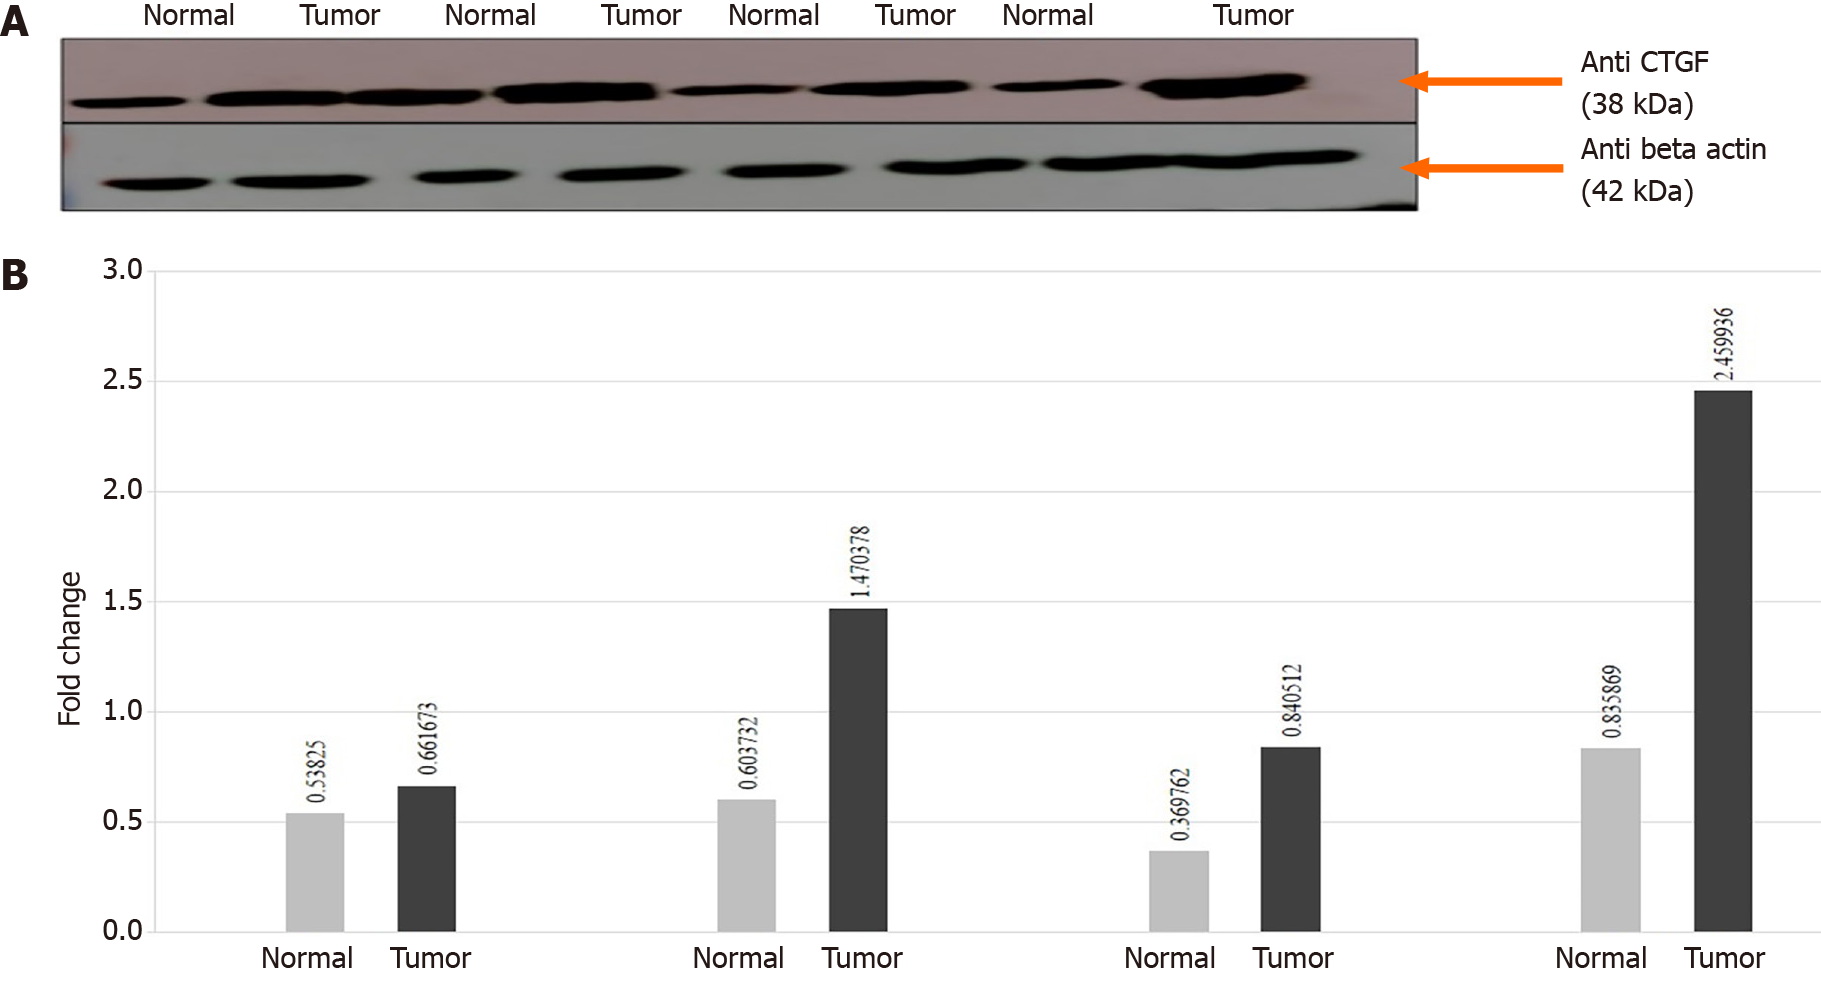
Figure 3 Connective tissue growth factor.
A: The connective tissue growth factor (CTGF) is upregulated in human colorectal cancer (CRC) samples. Representative Immunoblot showing expression of tumors and their adjacent normals in CRC. Lane N: Normal; Lane T: Tumor. β-actin is used as a loading control. About 40 μg protein loaded on 12% sodium dodecyl sulphate-Gel transferred to polyvinylidene difluoride membrane, anti-β actin primary Ab (1:1000), anti-CTGF primary Ab (1:500); B: Normalized densitometric values. The experiments were performed in triplicates; mean and standard error was calculated. CTGF: Connective tissue growth factor.
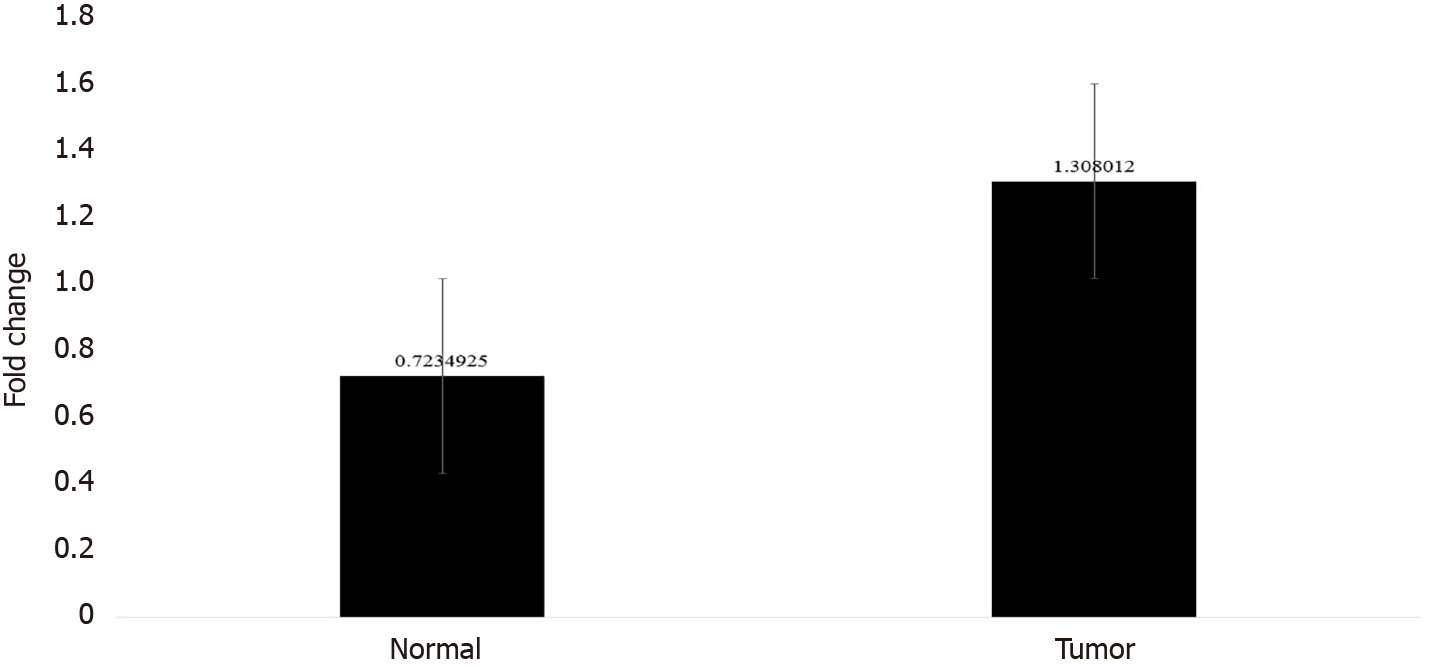
Figure 4 Bar graph showing the average fold change of connective tissue growth factor overexpression in colorectal cancer tumors and their adjacent normal tissue with error bars.
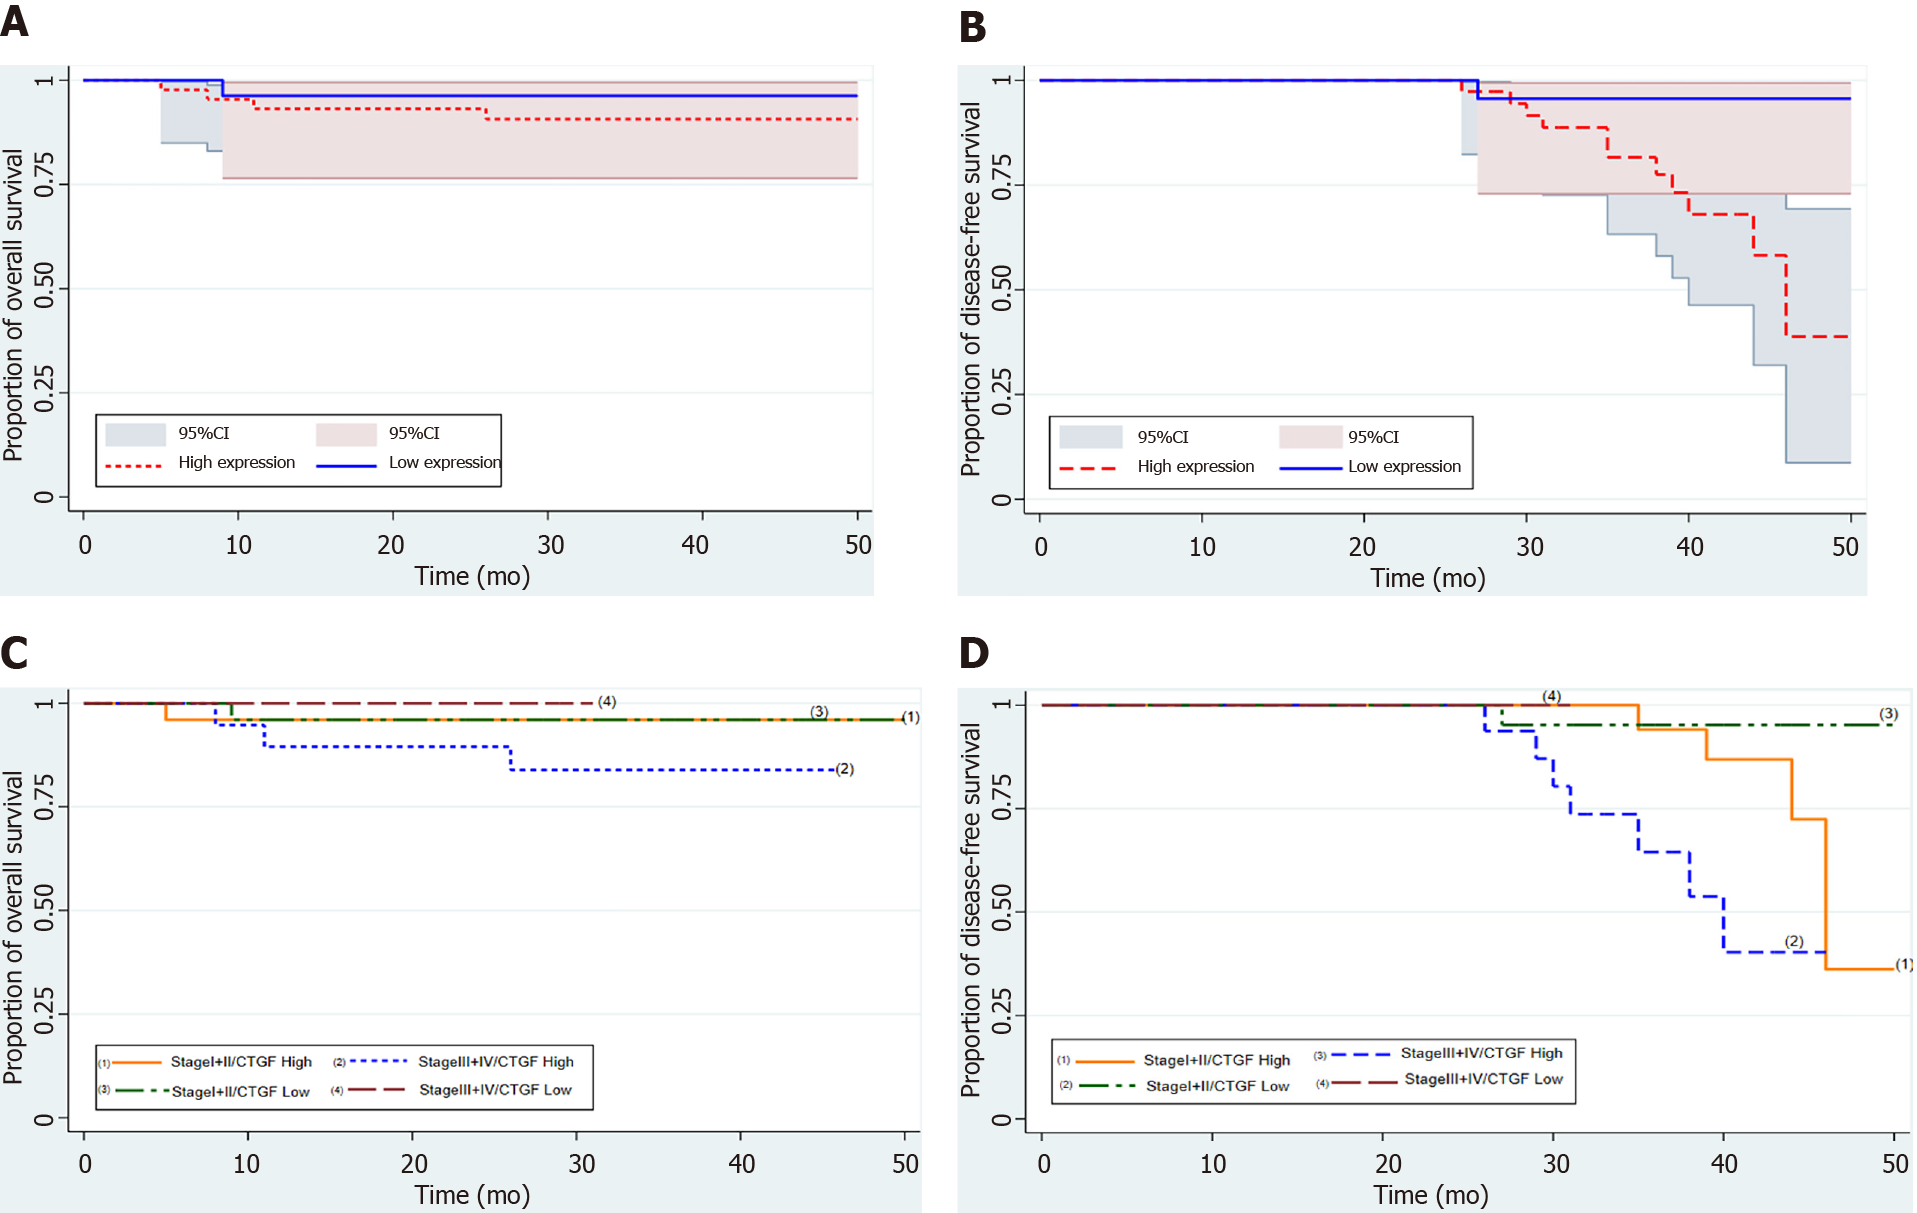
Figure 5 Kaplan-Meier survival analysis of 71 colorectal cancer patients from the time of diagnosis of the disease with connective tissue growth factor protein expression.
A: Overall survival (OS) with connective tissue growth factor (CTGF) High and low expression; B: Disease-free survival (DFS) with CTGF High and Low expression; C and D: Depict OS and DFS of colorectal cancer patients respectively stratified as Stage I + II and III + IV.
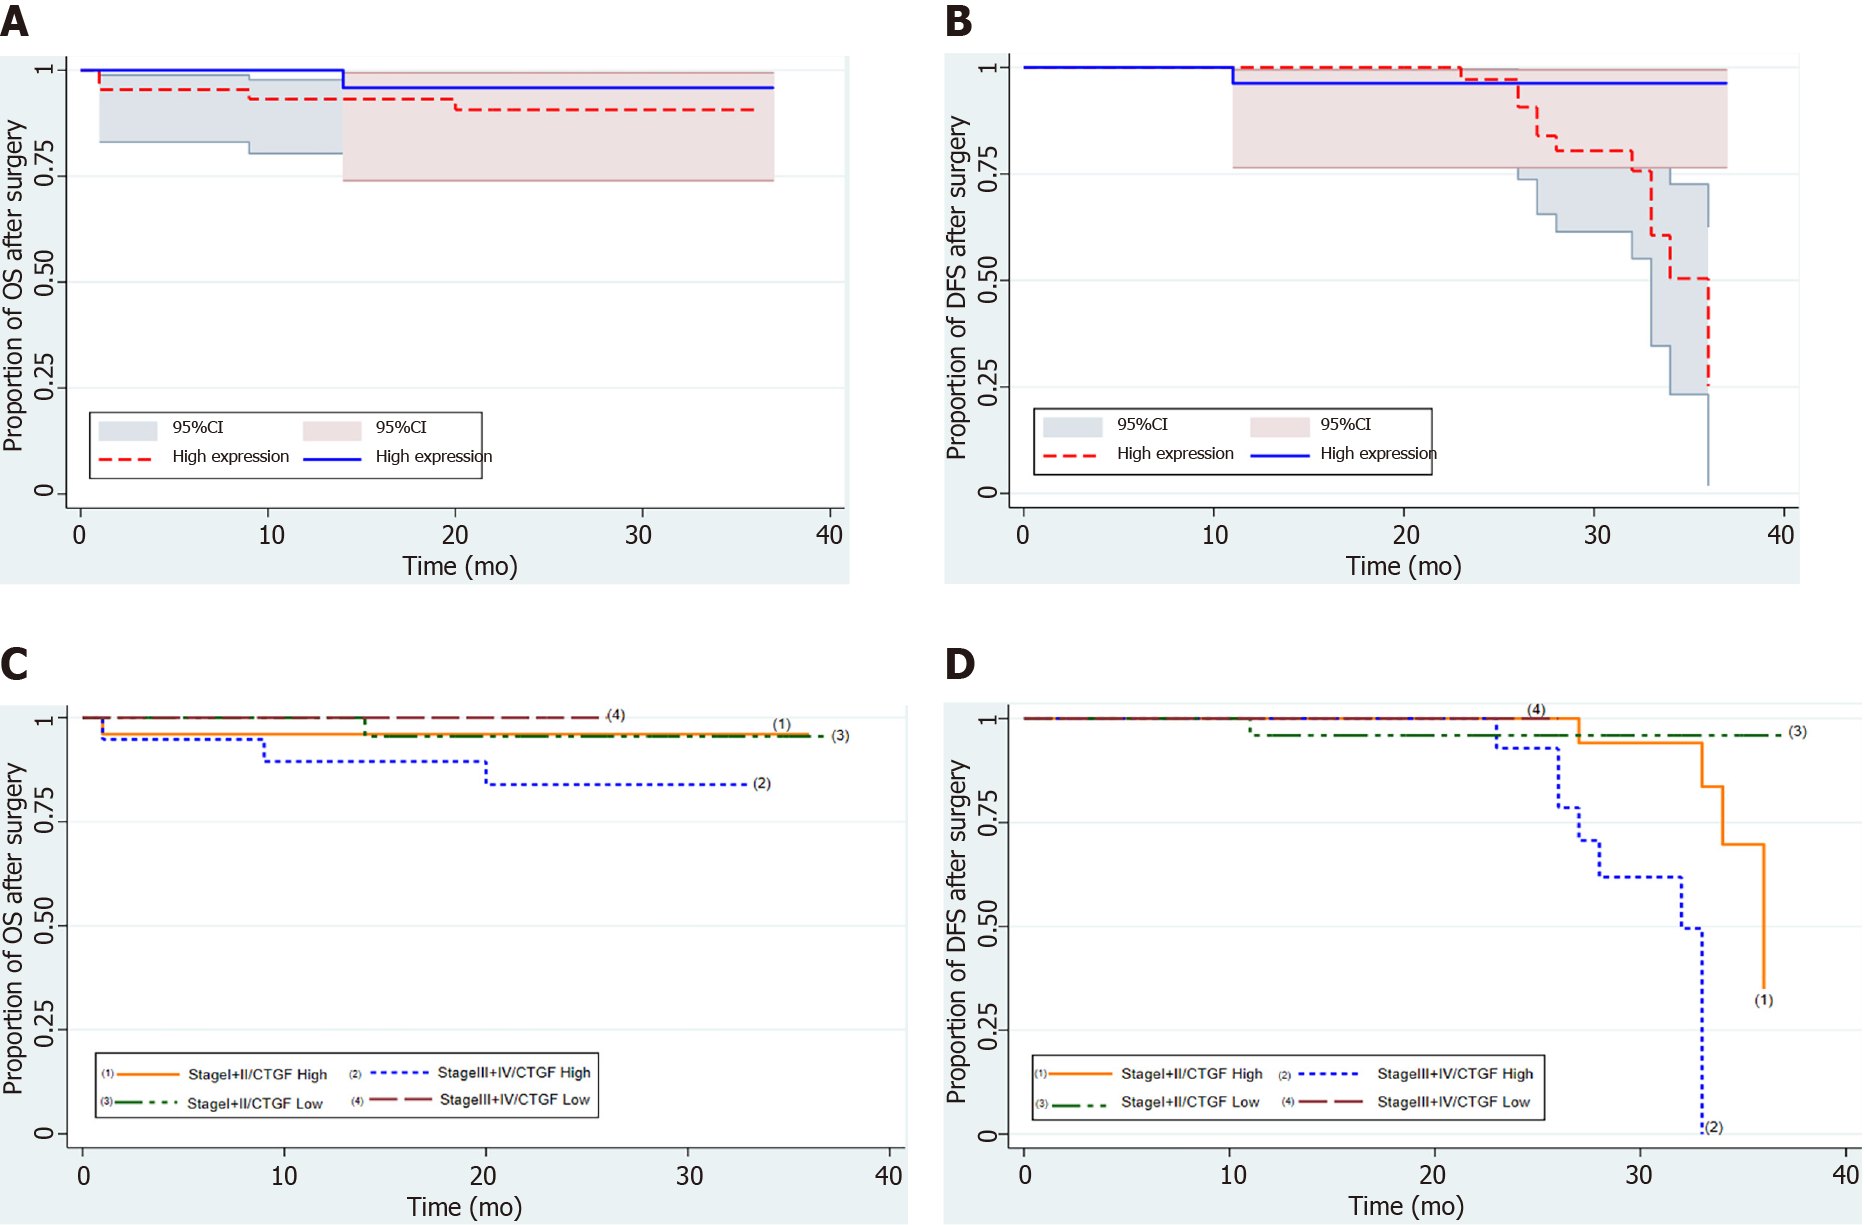
Figure 6 Kaplan-Meier survival analysis of 71 colorectal cancer patients after surgery with connective tissue growth factor protein expression.
A and B: Depicts the overall and disease-free survival with connective tissue growth factor High and Low expression respectively; C and D: Shows the overall and disease-free survival of colorectal cancer patients respectively, stratified as Stage I + II and III + IV. CTGF: Connective tissue growth factor; OS: Overall survival; DFS: Disease-free survival.
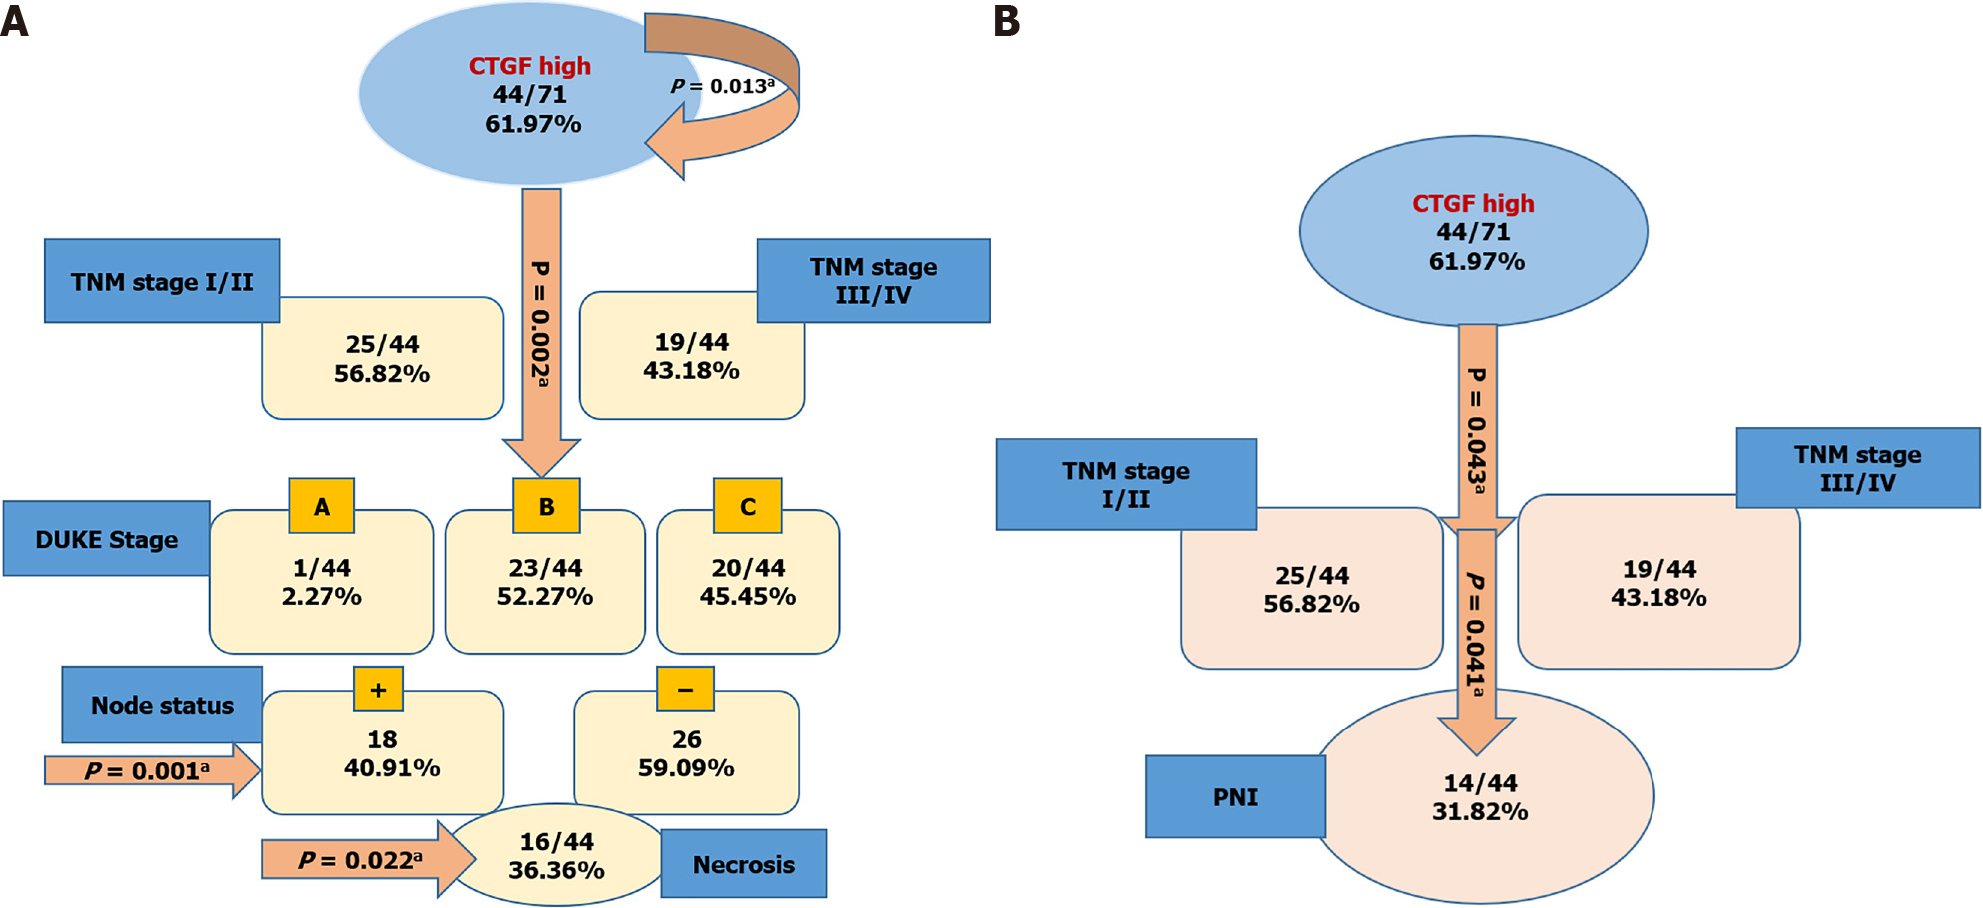
Figure 7 Connective tissue growth factor classification tree analysis for disease-free and overall survival of colorectal cancer patients; the numbers in the circles and boxes shows connective tissue growth factor high expression and percentage of the positive markers per total number of cases and arrows show the significant P values.
A: Tree model of connective tissue growth factor high expression showing that tumor-node-metastasis (TNM) stage, duke stage, lymph node status and Necrosis of tumor tissue were independent predictors for disease-free survival; B: Depicts that TNM Stage and perineural invasion status were independent predictors for overall survival of colorectal cancer patients. aP < 0.05. CRC: Colorectal cancer; CTGF: Connective tissue growth factor; PNI: Perineural invasion.
- Citation: Bhat IP, Rather TB, Maqbool I, Rashid G, Akhtar K, Bhat GA, Parray FQ, Syed B, Khan IY, Kazi M, Hussain MD, Syed M. Connective tissue growth factor expression hints at aggressive nature of colorectal cancer. World J Gastroenterol 2022; 28(5): 547-569
- URL: https://www.wjgnet.com/1007-9327/full/v28/i5/547.htm
- DOI: https://dx.doi.org/10.3748/wjg.v28.i5.547


