©The Author(s) 2022.
World J Gastroenterol. Aug 7, 2022; 28(29): 3917-3933
Published online Aug 7, 2022. doi: 10.3748/wjg.v28.i29.3917
Published online Aug 7, 2022. doi: 10.3748/wjg.v28.i29.3917
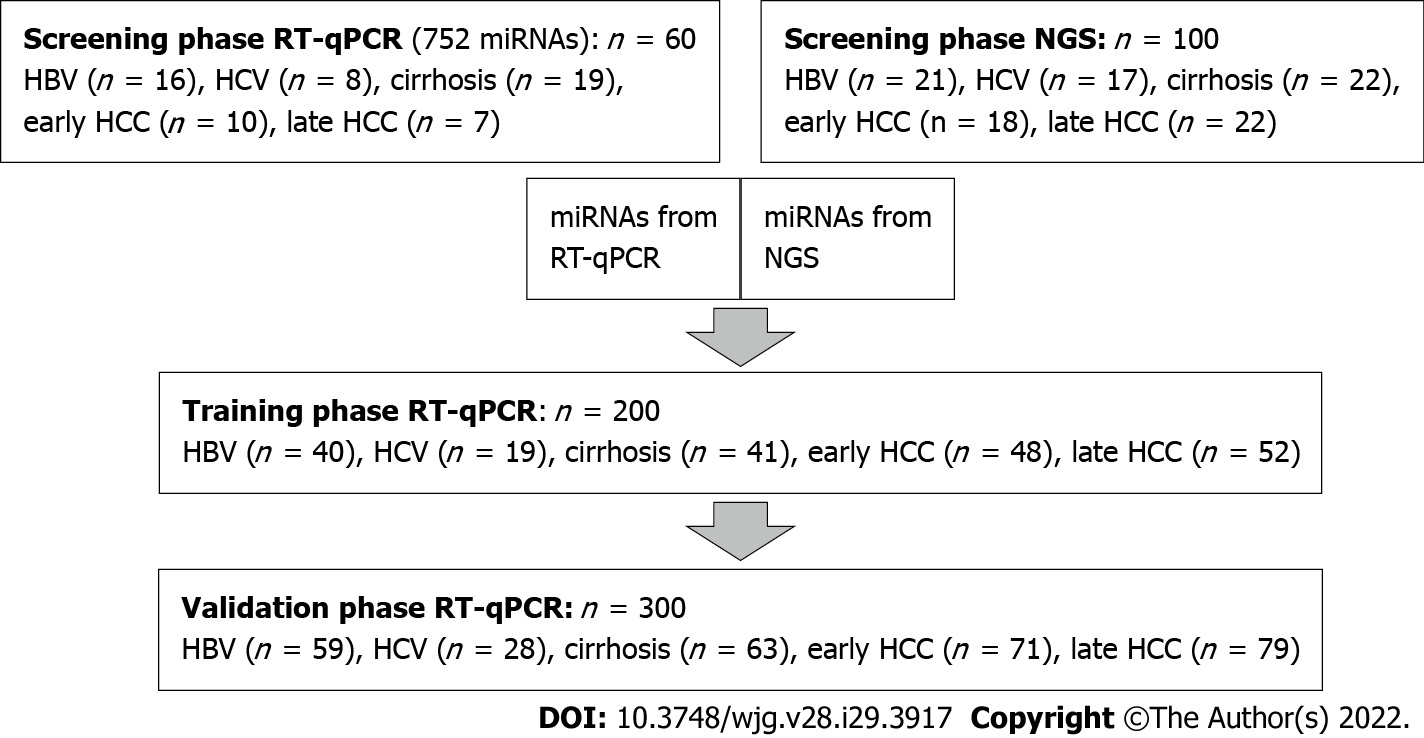
Figure 1 Overview of study design.
HBV: Hepatitis B virus; HCC: Hepatocellular carcinoma; HCV: Hepatitis C virus; miRNA: Micro ribonucleic acid; NGS: Next-generation sequencing; RT-qPCR: Real-time quantitative PCR.
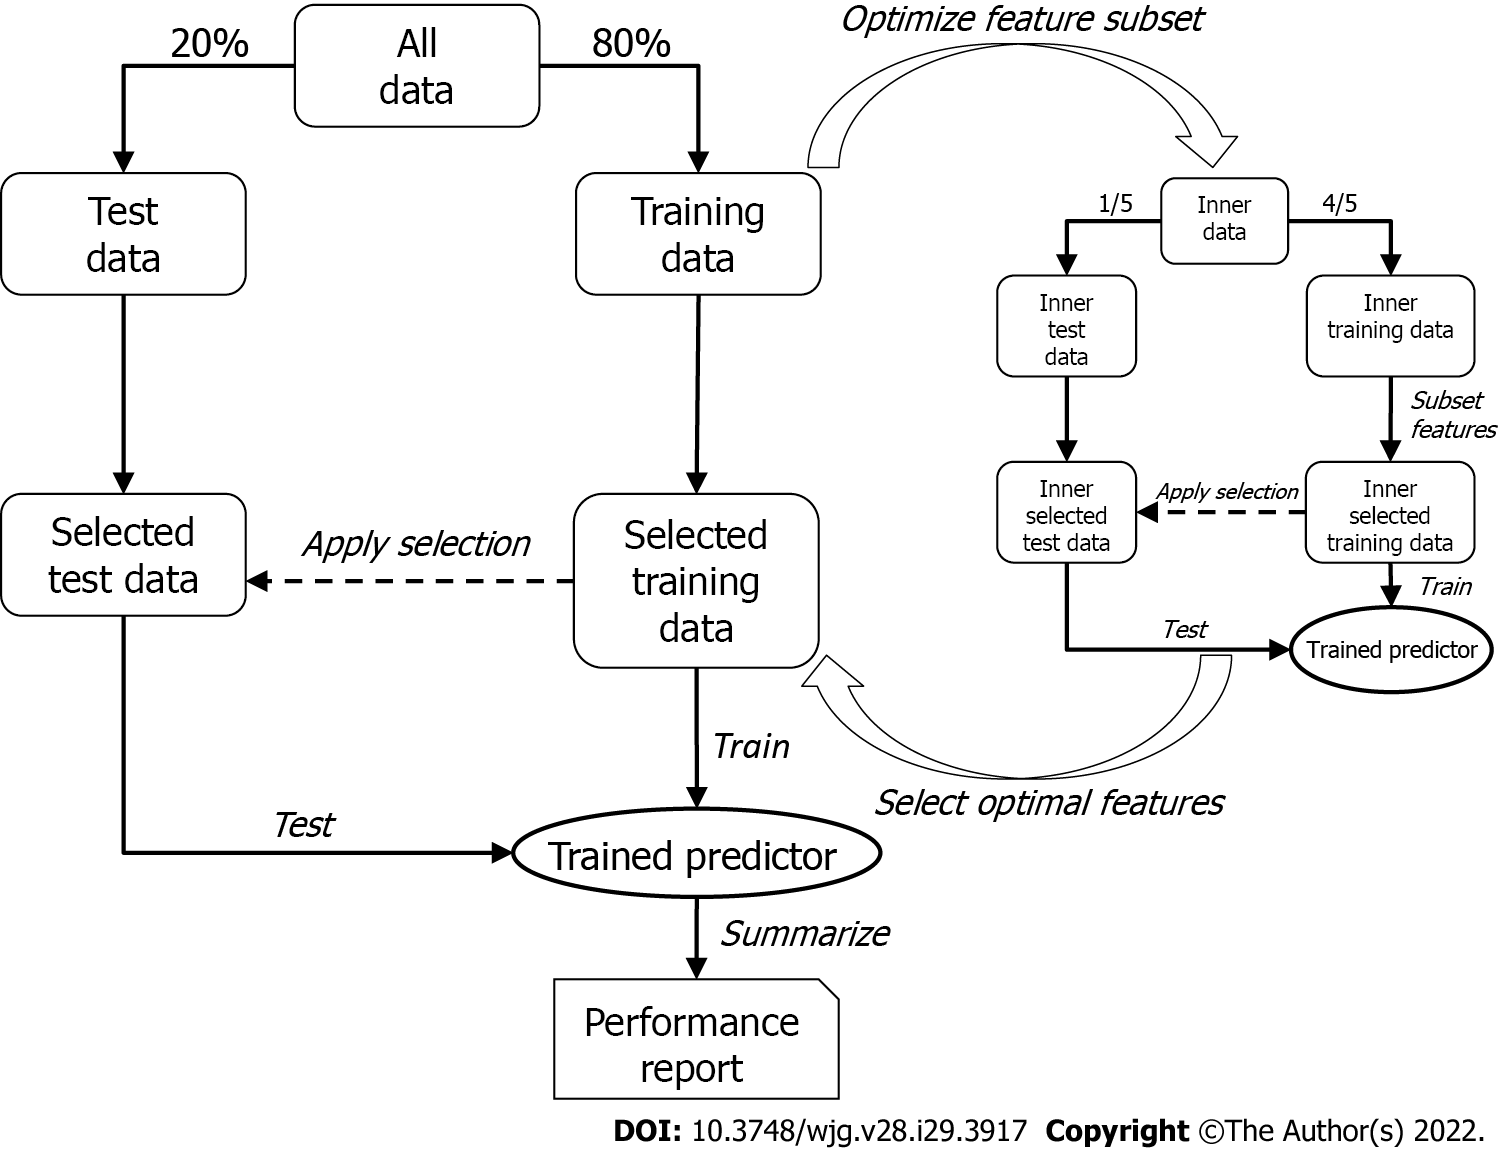
Figure 2 Overview of the two-tier cross-validation workflow employing logistic regression.
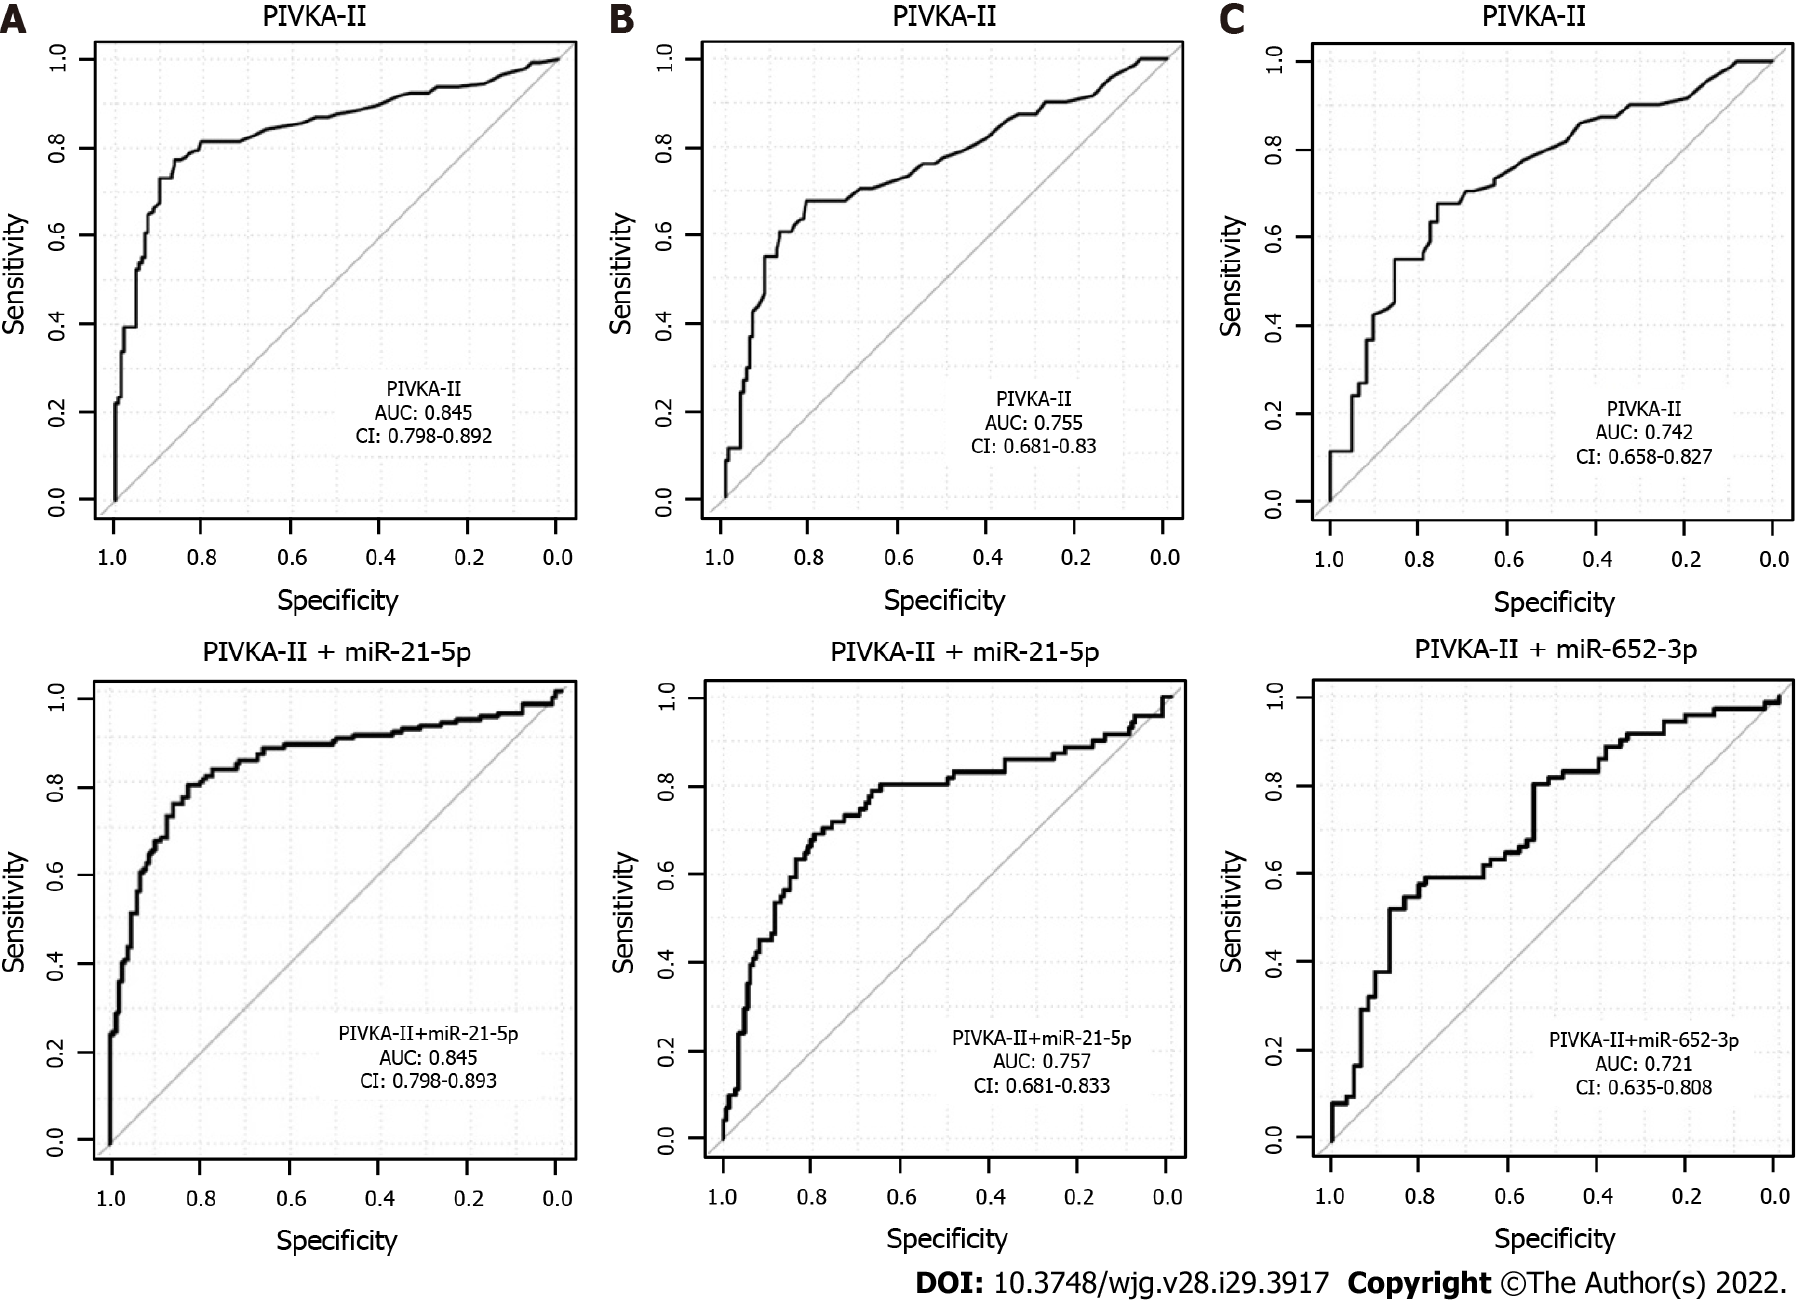
Figure 3 Receiver operating characteristics curves and area under the curve for multivariate analysis of real-time quantitative PCR results.
A: Comparison of all hepatocellular carcinoma vs chronic liver disease; B: Early hepatocellular carcinoma vs chronic liver disease; C: Early hepatocellular carcinoma vs cirrhosis. Analyses were for the validation cohort. Upper panel: Protein induced by vitamin K absence/antagonist-II alone; Lower panel: Protein induced by vitamin K absence/antagonist-II in combination with the best miRNA (selected as final pair in the training analysis). AUC: Area under the curve; CI: Confidence interval; CLD: Chronic liver disease; HCC: Hepatocellular carcinoma; miR: MicroRNA; PIVKA-II: Protein induced by vitamin K absence/antagonist-II.
- Citation: Malik J, Klammer M, Rolny V, Chan HLY, Piratvisuth T, Tanwandee T, Thongsawat S, Sukeepaisarnjaroen W, Esteban JI, Bes M, Köhler B, Swiatek-de Lange M. Comprehensive evaluation of microRNA as a biomarker for the diagnosis of hepatocellular carcinoma. World J Gastroenterol 2022; 28(29): 3917-3933
- URL: https://www.wjgnet.com/1007-9327/full/v28/i29/3917.htm
- DOI: https://dx.doi.org/10.3748/wjg.v28.i29.3917


