Copyright
©The Author(s) 2022.
World J Gastroenterol. Jul 14, 2022; 28(26): 3116-3131
Published online Jul 14, 2022. doi: 10.3748/wjg.v28.i26.3116
Published online Jul 14, 2022. doi: 10.3748/wjg.v28.i26.3116
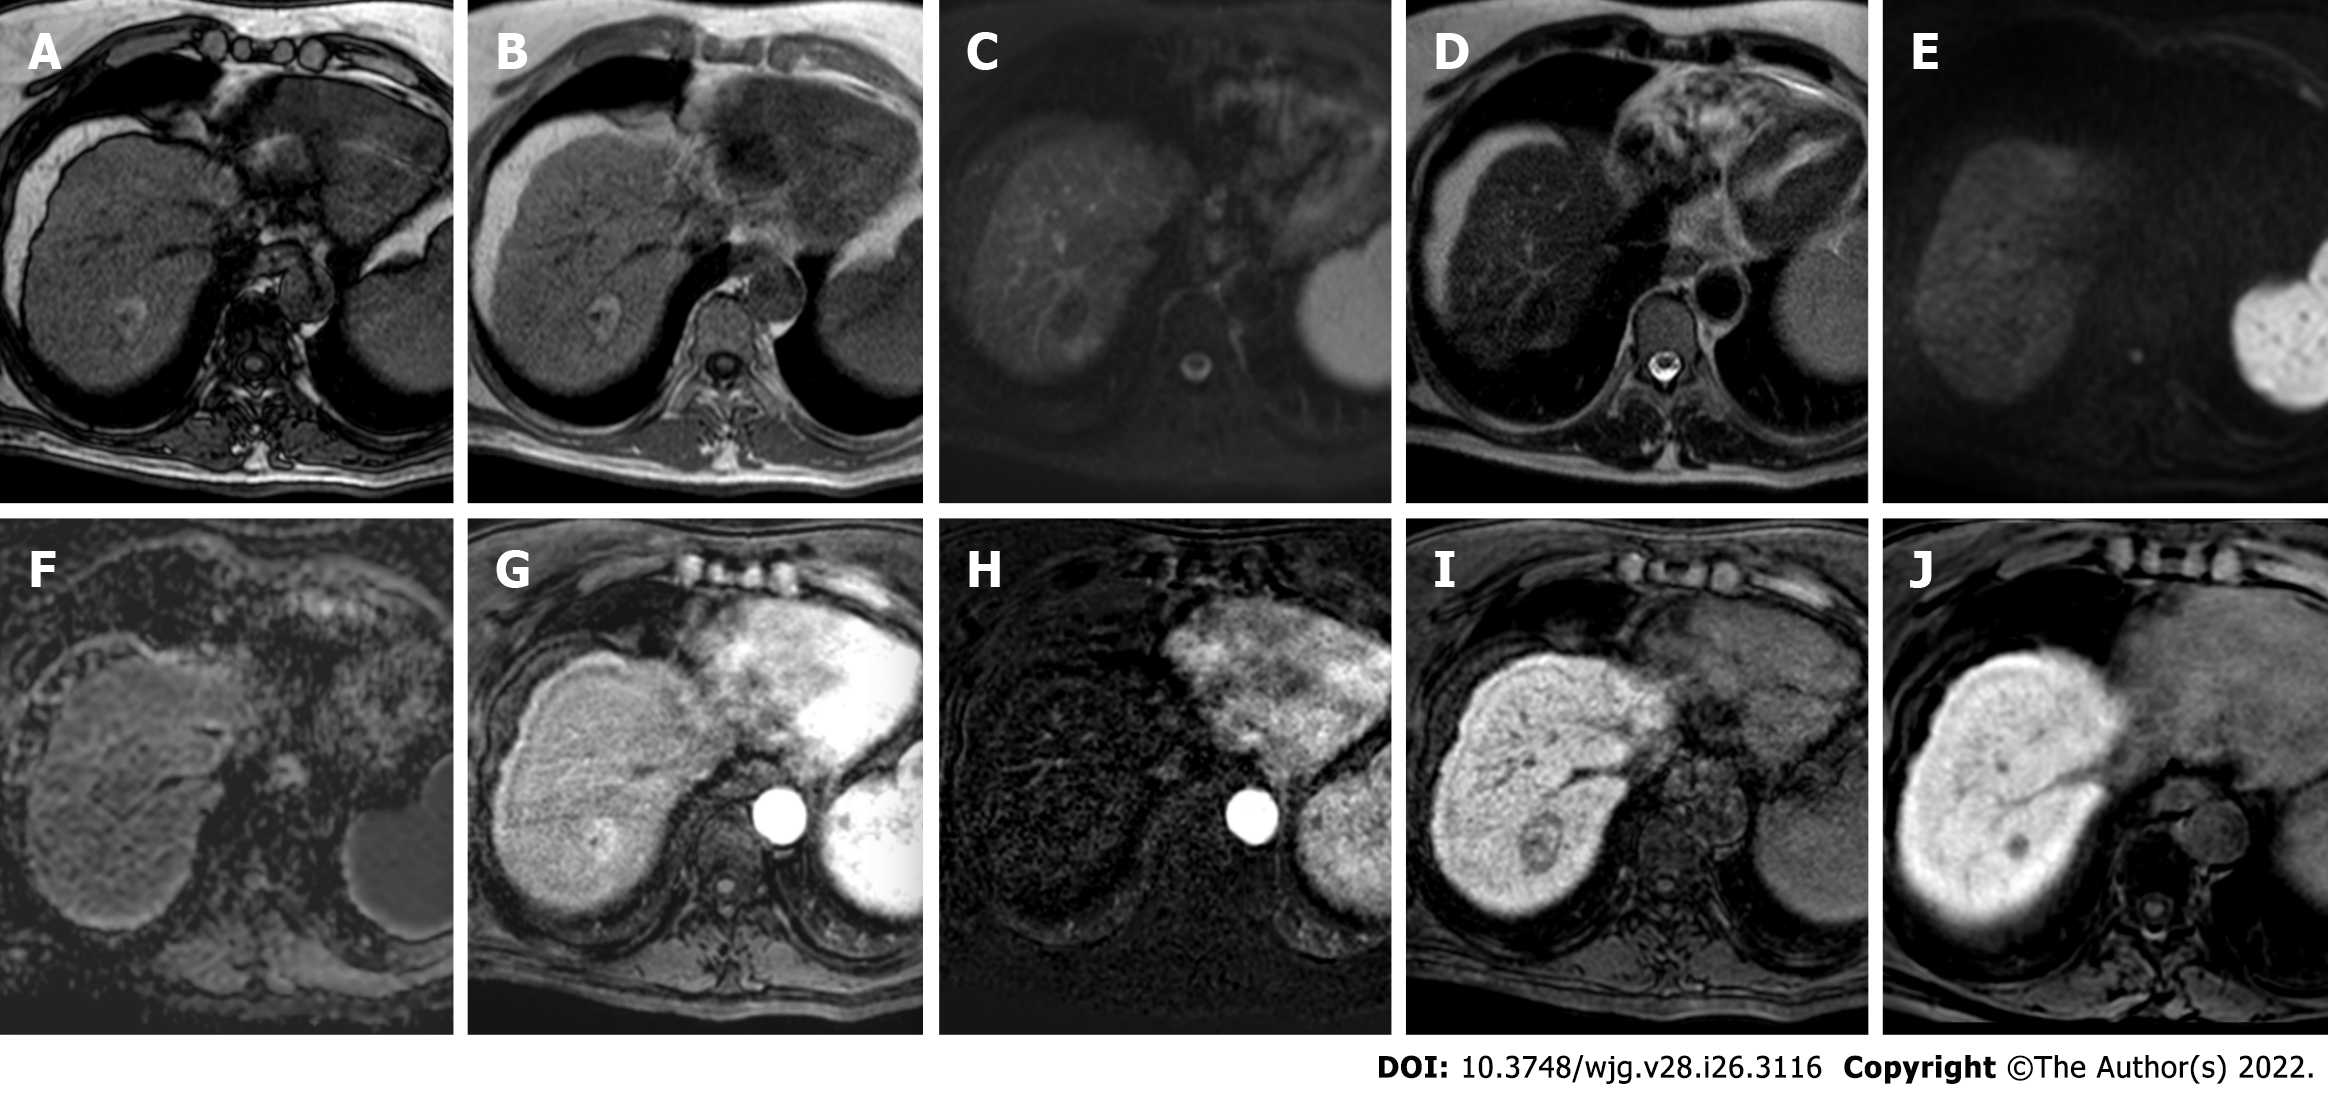
Figure 1 hree-month follow-up liver magnetic resonance imaging of a 69-yr-old male post radiofrequency ablation of right hepatic lobe hepatocellular carcinoma (segment VII).
A: Out-phase T1-weighted image; B: In-phase T1-weighted image; C: T2-spectral attenuated inversion recovery; D: T2-weighted image; E: High b-value diffusion weighted imaging; F: Apparent diffusion coefficient map; G: Arterial phase magnetic resonance imaging (MRI); H: Arterial phase MRI with image subtraction technique; I and J: Hepatobiliary phase MRI. Follow-up MRI (A-I) after 3 mo post treatment revealed a good outcome characterized by inhomogeneous high signal hyperintensity in T1 sequences due to the presence of coagulative necrosis with associated signal hypointensity in T2 weighted sequences and the absence signal hyperintensity in diffusion weighted imaging. Dynamic study showed no enhancement in arterial phase with inhomogeneous hypointensity during hepatobiliary excretion. Findings are suggestive of complete tumor ablation also when compared to the similar pre-treatment sequences (J).
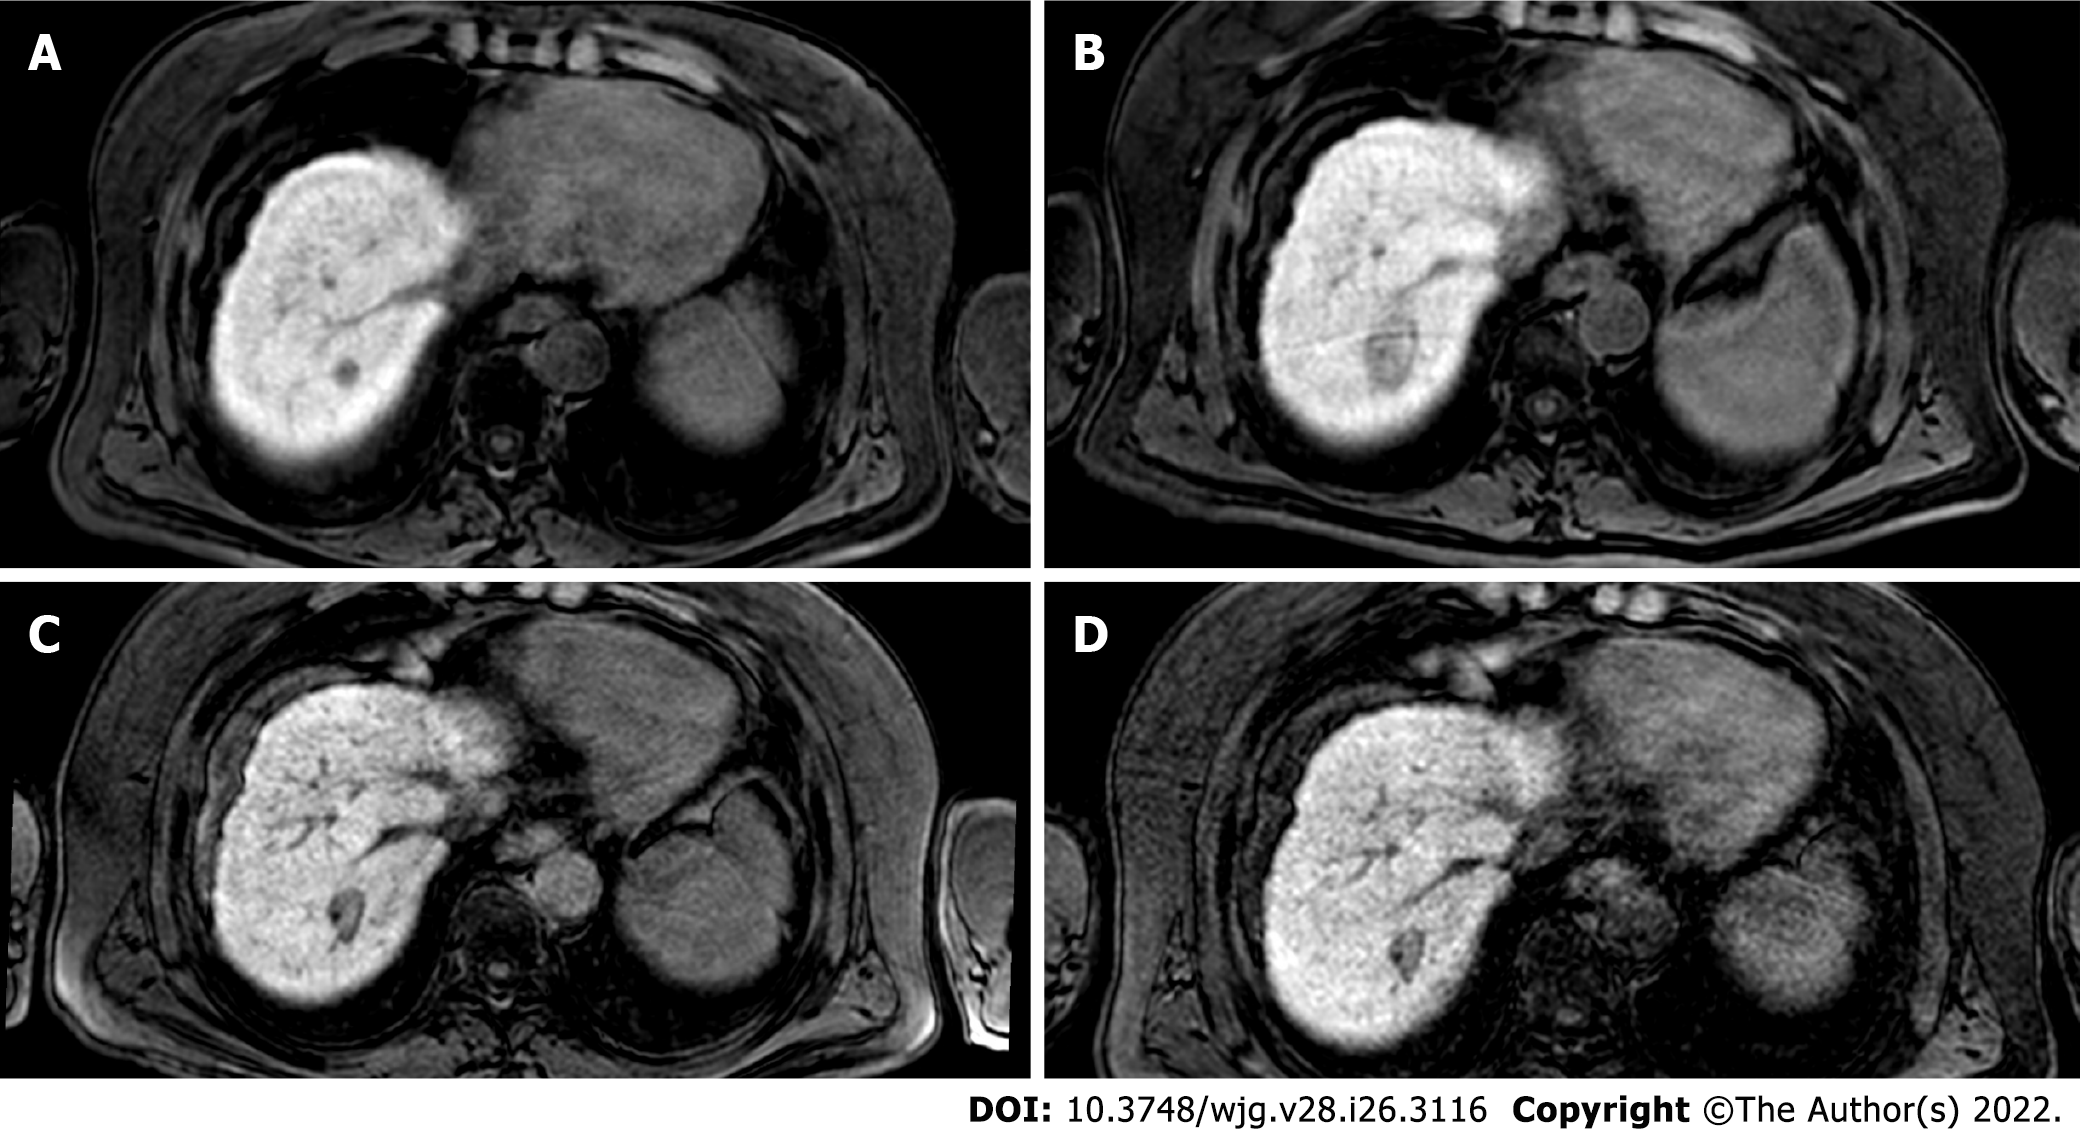
Figure 2 The evolution of the ablation zone shown in Figure 1.
A: Hepatobiliary phase (HBP) phase magnetic resonance imaging (MRI) prior to radiofrequency ablation (RFA); B: HBP MRI 3 mo after RFA; C: HBP MRI 9 mo after RFA; D: HBP MRI 19 mo after RFA. Liver MRIs demonstrate a progressive reduction of ablation zone together with fibrotic changes.
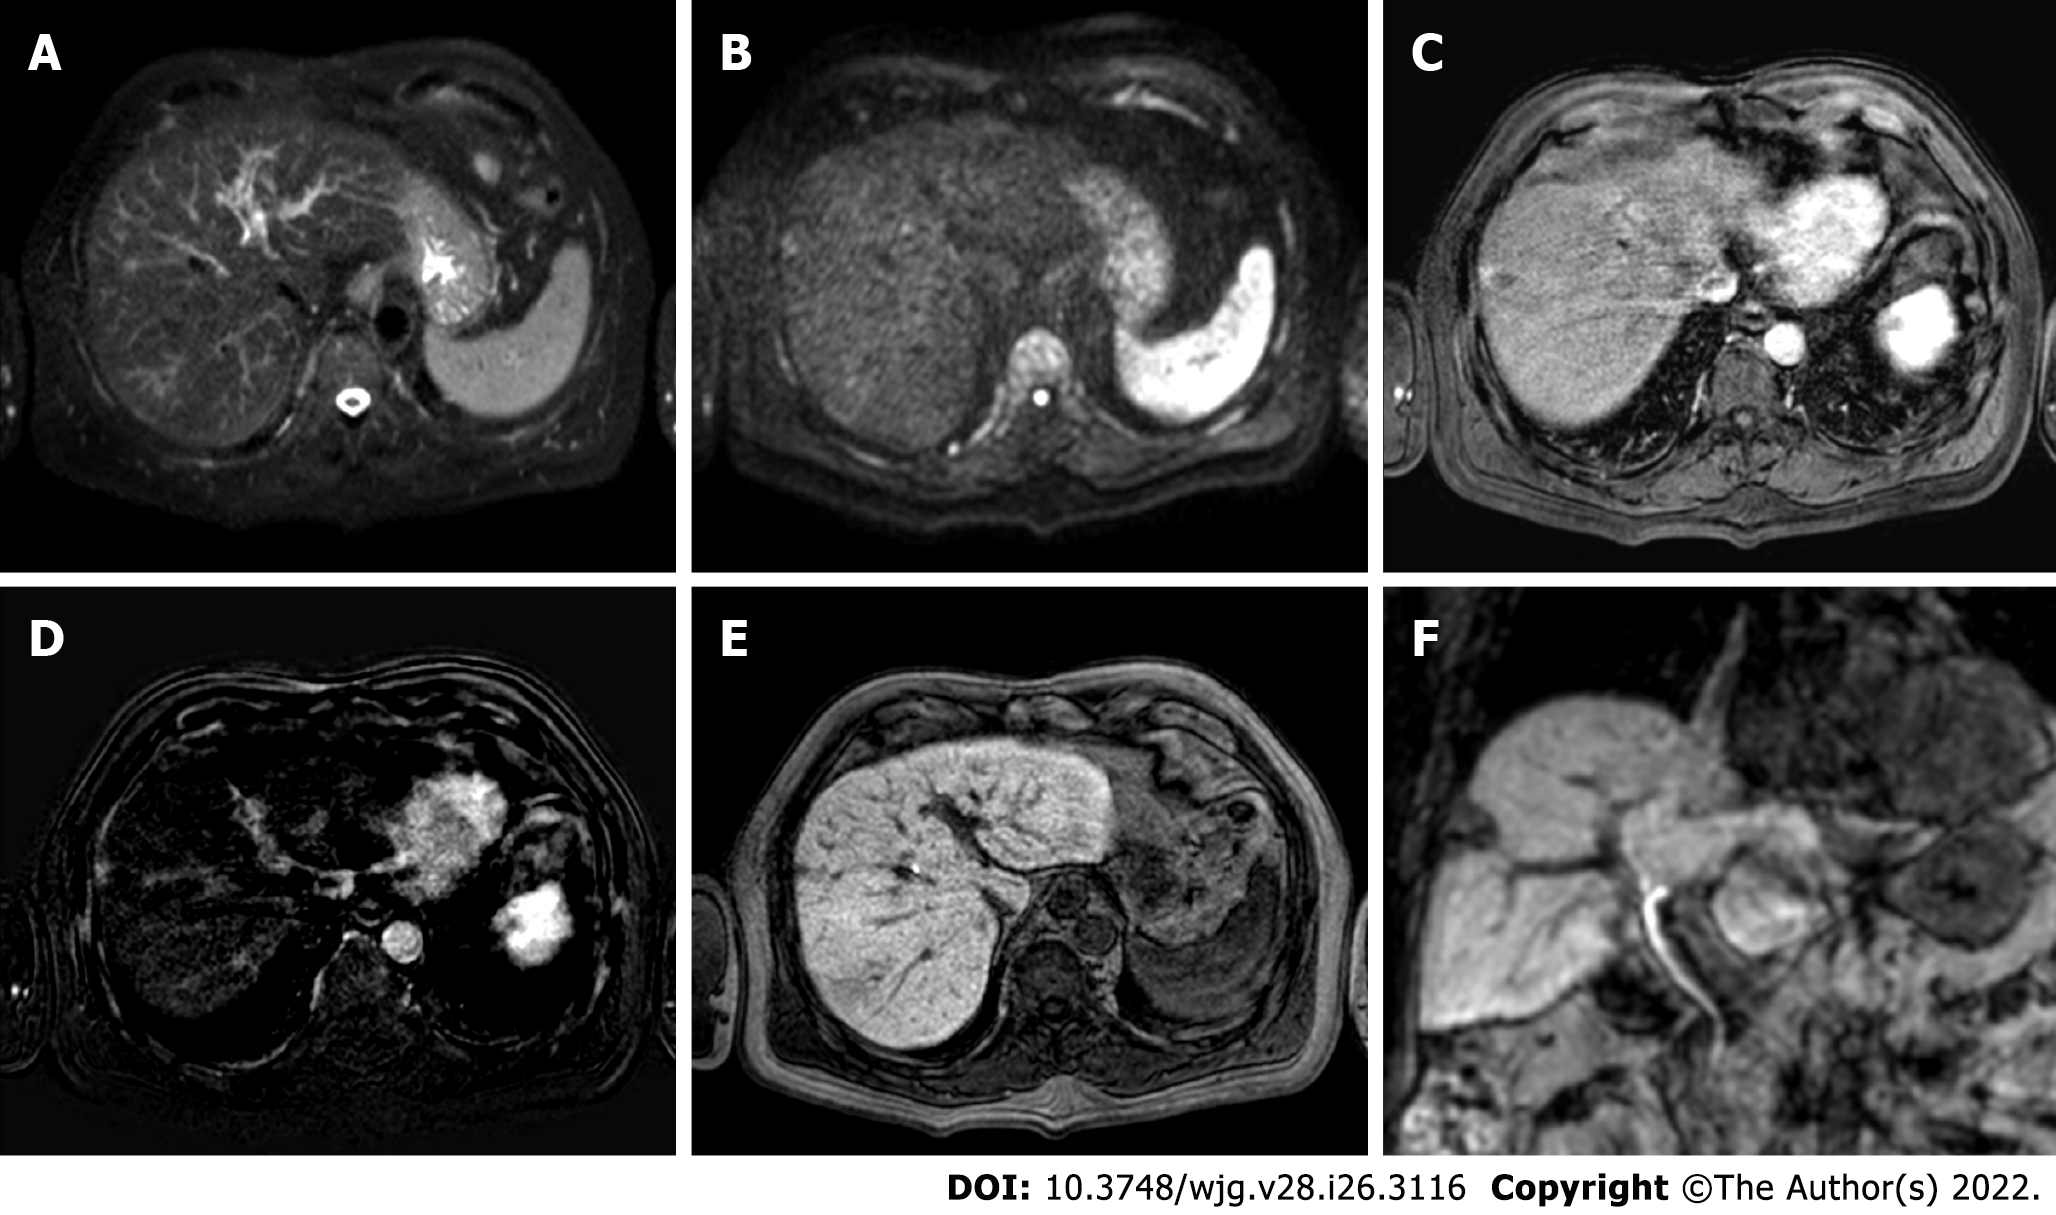
Figure 3 Two-years liver magnetic resonance imaging follow-up of a 71-yr-old male with liver cirrhosis and previous subcapsular hepatocellular carcinoma in segment VIII underwent radiofrequency ablation.
A: T2-spectral attenuated inversion recovery; B: High b-value diffusion weighted imaging; C: Arterial phase magnetic resonance imaging (MRI); D: Arterial phase MRI with image subtraction technique; E and F: Hepatobiliary phase MRI. Liver MRI showed recurrent hepatocellular carcinoma (8 mm) located infero-lateral to the radiofrequency scar, characterized by moderate to high signal hyperintensity in T2, hyperintensity in high b-value diffusion sequences, with arterial “wash in” and hypointensity in hepatobiliary excretion phase.
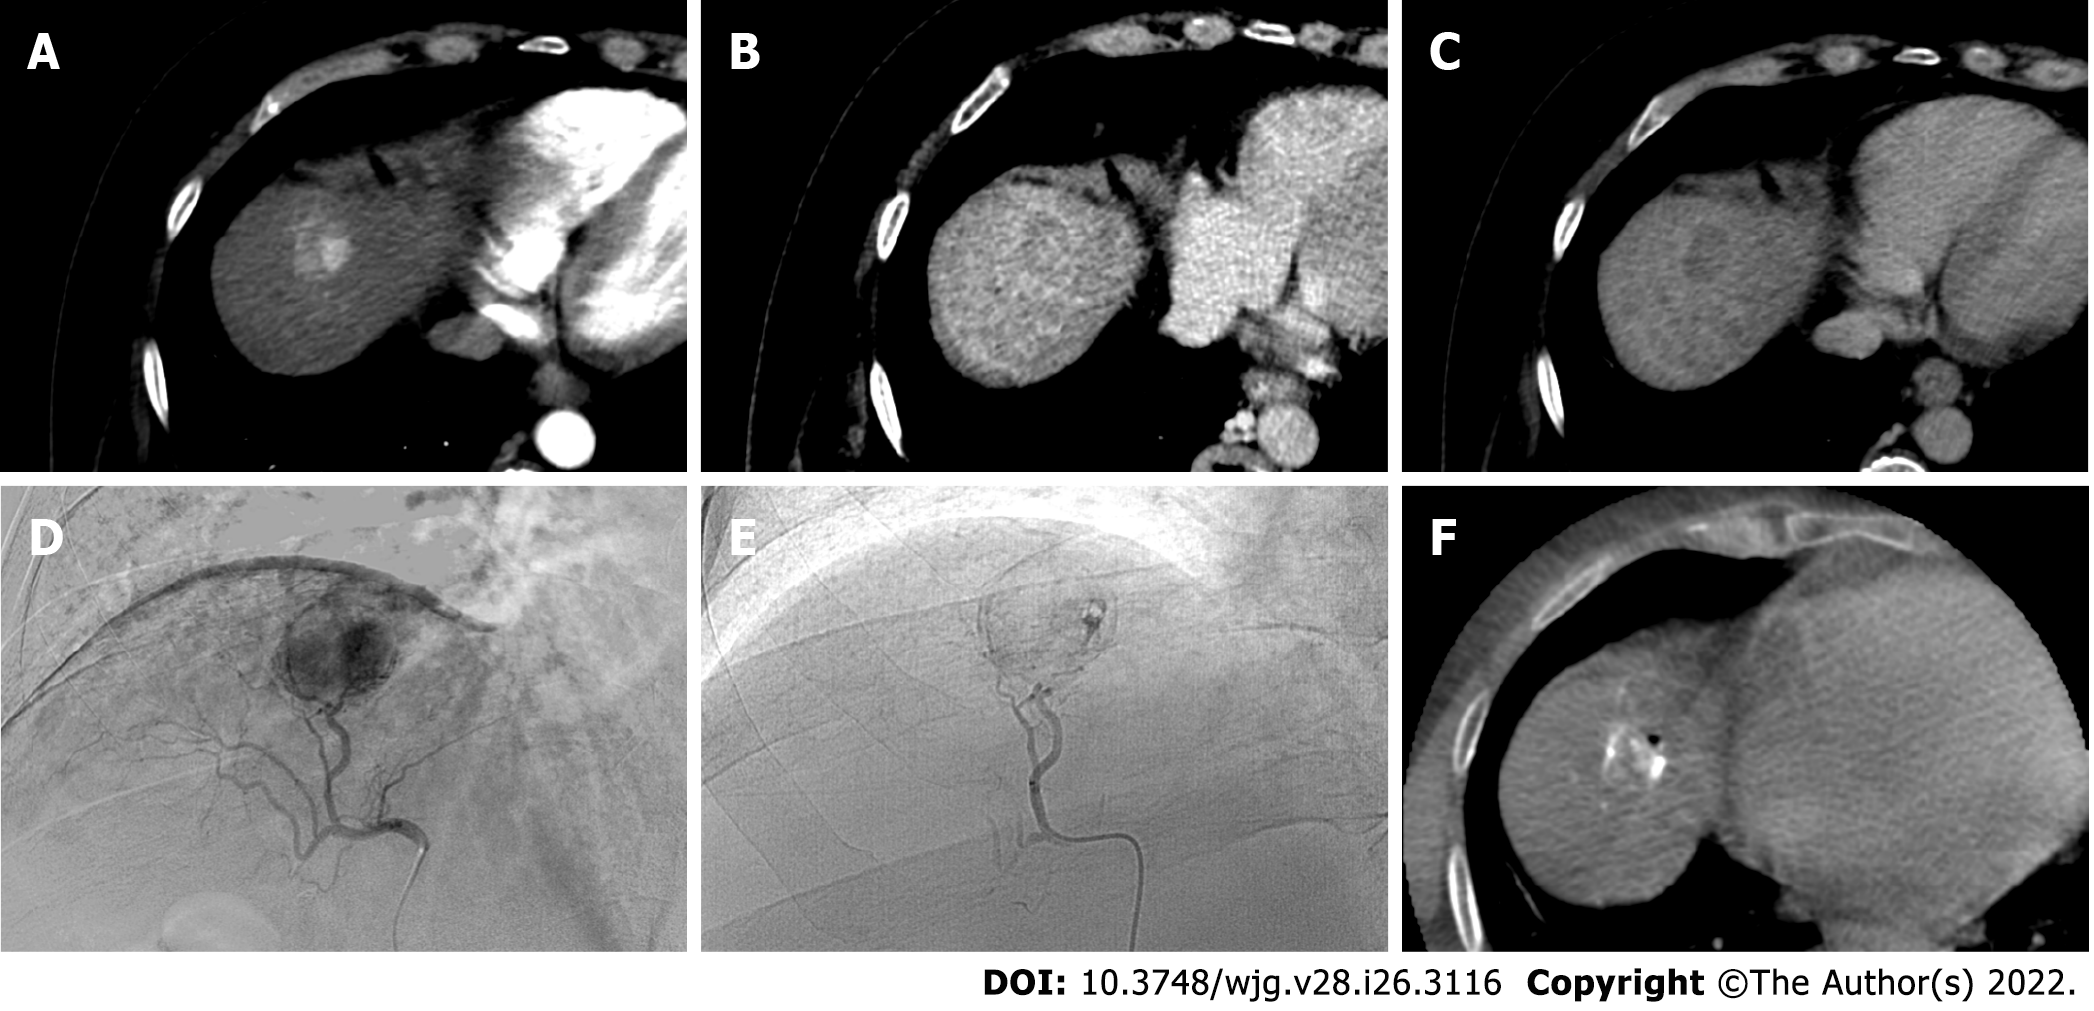
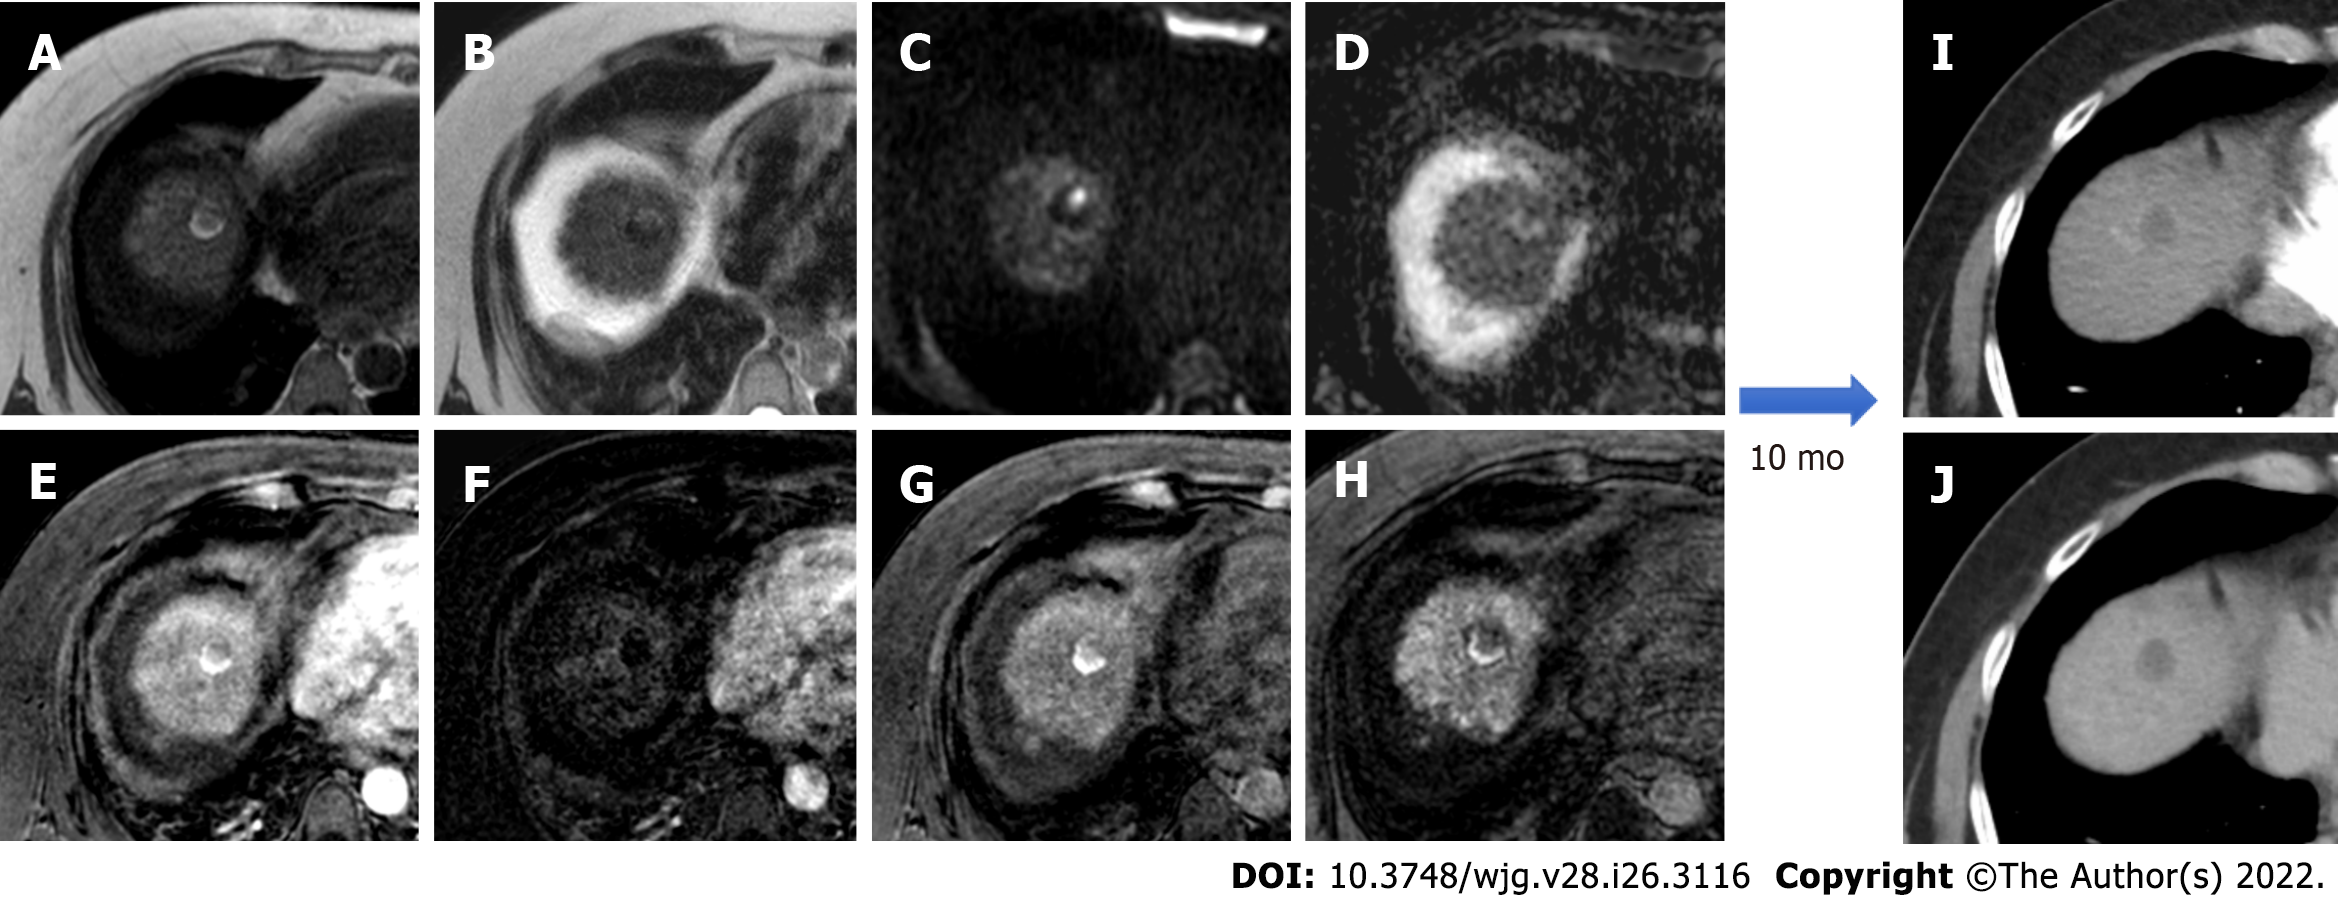
Figure 4 A 62-yr-old male with typical hepatocellular carcinoma in segment IVa who underwent trans-arterial chemoembolization with microparticles (Lifepearl 100 +/- 25 microns) preloaded with 50 mg of Farmorubicin and later with non-loadable Hydropearl 400 +/- 75 microns microparticles.
A: Pre-treatment computed tomography (CT) images: arterial phase; B: Pre-treatment CT images: portal phase; C: Pre-treatment CT images: delayed phase; D: Pre-trans-arterial chemoembolization (TACE) angiographic image; E: Post-TACE angiographic image; F: Post-TACE cone beam CT.
Figure 5 Post-trans-arterial chemoembolization follow-up magnetic resonance imaging with hepatospecific contrast agent in the same patient described in Figure 4.
A: In-phase T1-weighted image; B: T2-weighted image C: High b-value diffusion weighted imaging (DWI); D: Apparent diffusion coefficient map; E: Arterial phase magnetic resonance imaging (MRI); F: Arterial phase MRI with image subtraction technique; G: Portal venous phase MRI; H: Hepatobiliary phase MRI; I: Ten-month computed tomography (CT) follow-up: arterial phase; J: Ten-month CT follow-up: delayed phase. Liver MRI shows an inhomogeneously hyperintense nodule in T1WI in its right posterior portion, coexisting with a more hyperintense area in T2WI with high signal intensity in high b-value DWI in the left anterior portion. Dynamic study showed no arterial enhancement confirmed with the subtraction technique image, absence of vascularization in the portal phase and inhomogeneous hypointensity in the hepatobiliary phase. The findings are suggestive of good treatment outcome with presence of both coagulative and colliquative necrosis and no residual disease and CT scans control after 10 mo confirmed the outcome.
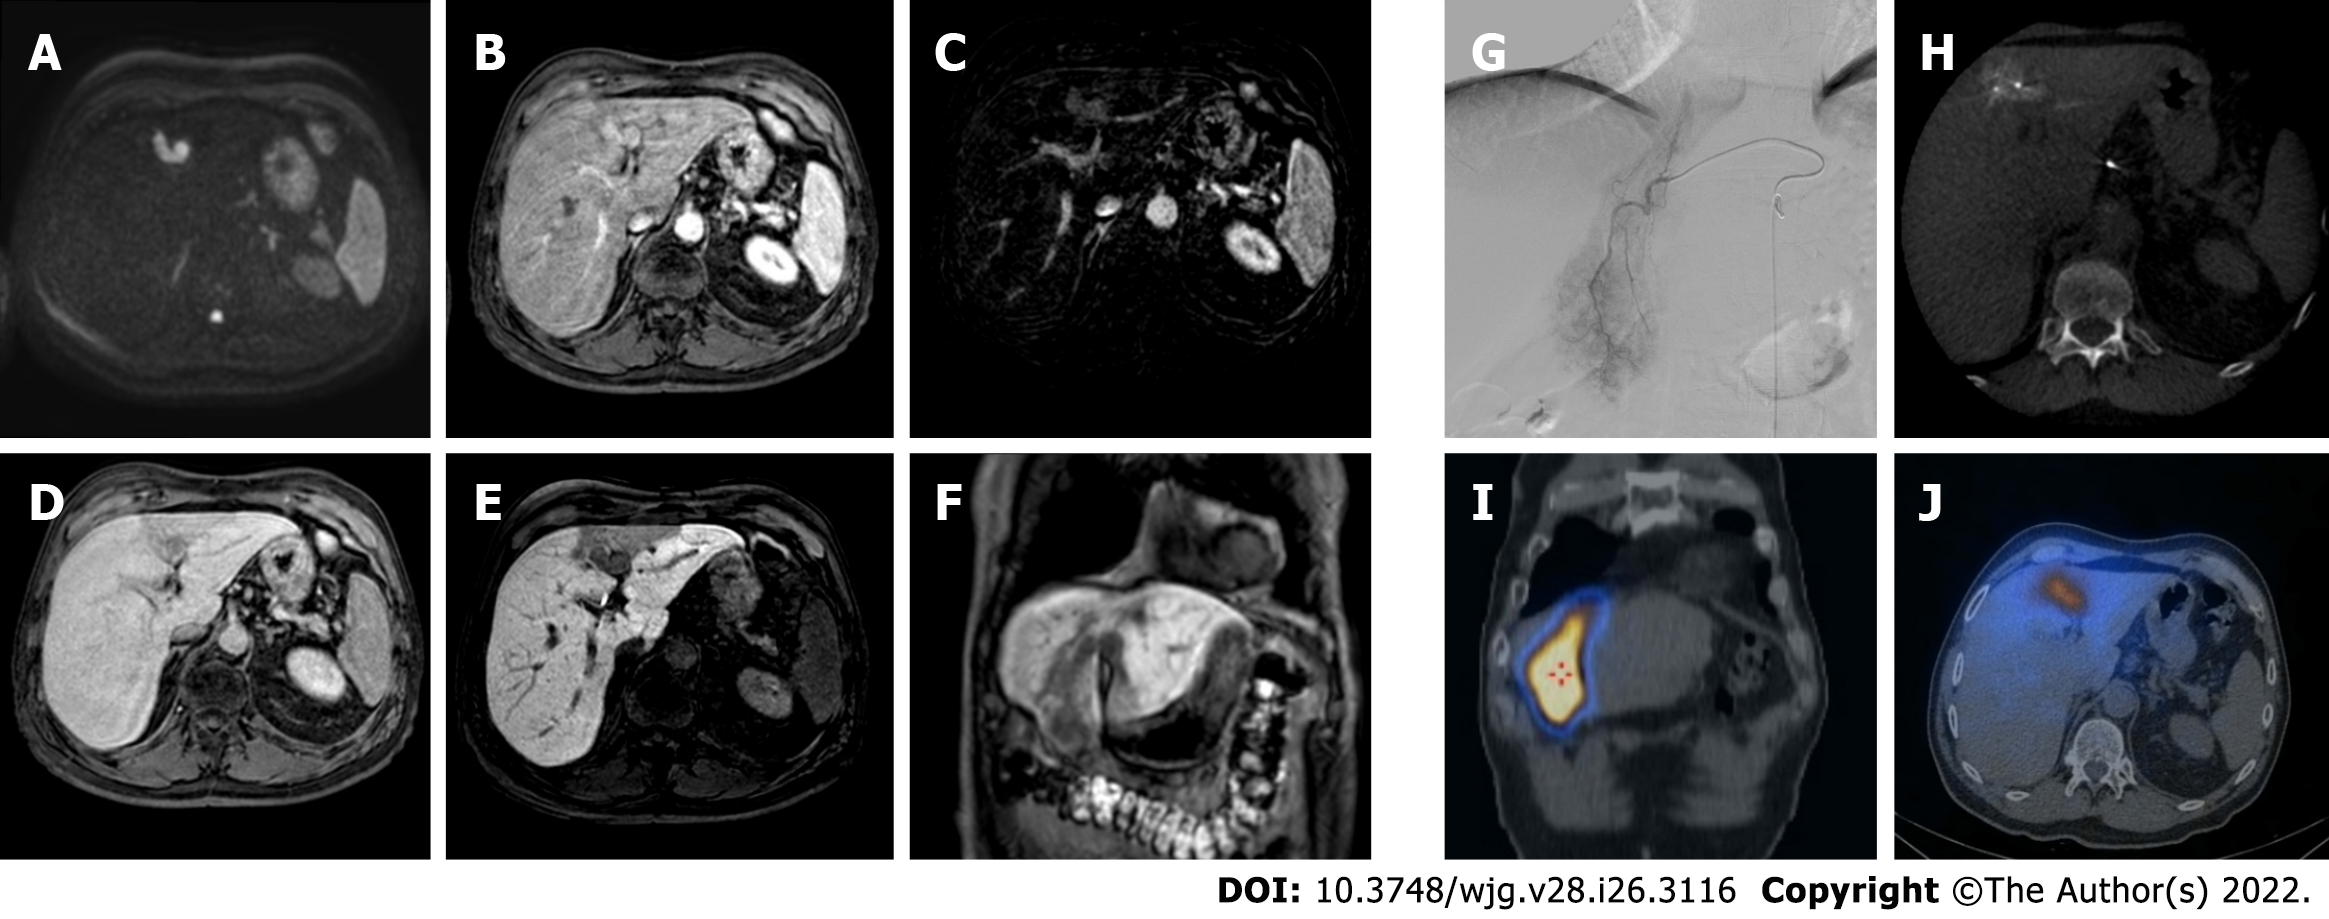
Figure 6 A 62-yr-old patient with infiltrative hepatocellular carcinoma with associated neoplastic portal vein thrombosis.
A: High-b-value diffusion-weighted image; B: Arterial phase magnetic resonance imaging (MRI); C: Arterial phase MRI with image subtraction technique; D: Portal venous phase MRI; E and F: Hepatobiliary phase MRI; G: Pre-treatment arteriography; H: Pre-treatment cone beam computed tomography (CT); I and J: Post trans-arterial radio-embolization single photon emission computed tomography (SPECT) images. Left panel shows pre-treatment liver MRI, illustrating the cranial portion of the lesion with portal branch infiltration; whereas the right panel shows pre-treatment arteriography, the cone beam CT of the cranial portion of the lesion with the portal vein infiltration, and preoperative planning with SPECT images post administration of Tc-99m-labeled albumin macroaggregates with hyperfixation at both lesion site and portal thrombosis.
Figure 7 Post-trans-arterial radio-embolization images in the patient mentioned in Figure 6.
A: T2-spectral attenuated inversion recovery; B: High b-value diffusion weighted imaging; C: Apparent diffusion coefficient (ADC) map; D: Arterial phase magnetic resonance imaging (MRI); E: Arterial phase MRI with image subtraction technique; F: Hepatobiliary phase (HBP) MRI; G: T2-spectral attenuated inversion recovery; H: High b-value diffusion weighted imaging; I: ADC map; J: Arterial phase MRI; K: Arterial phase MRI with image subtraction technique; L: HBP MRI. The liver MRIs reveal almost no signal restriction in DWI and no enhancement in dynamic study in the caudal portion of the lesion (left panel) which are suggestive of a good outcome. Whereas in the cranial infiltrating part of the lesion (right panel) at portal branch level, the high signal in DWI with arterial enhancement is suspected for residual disease.
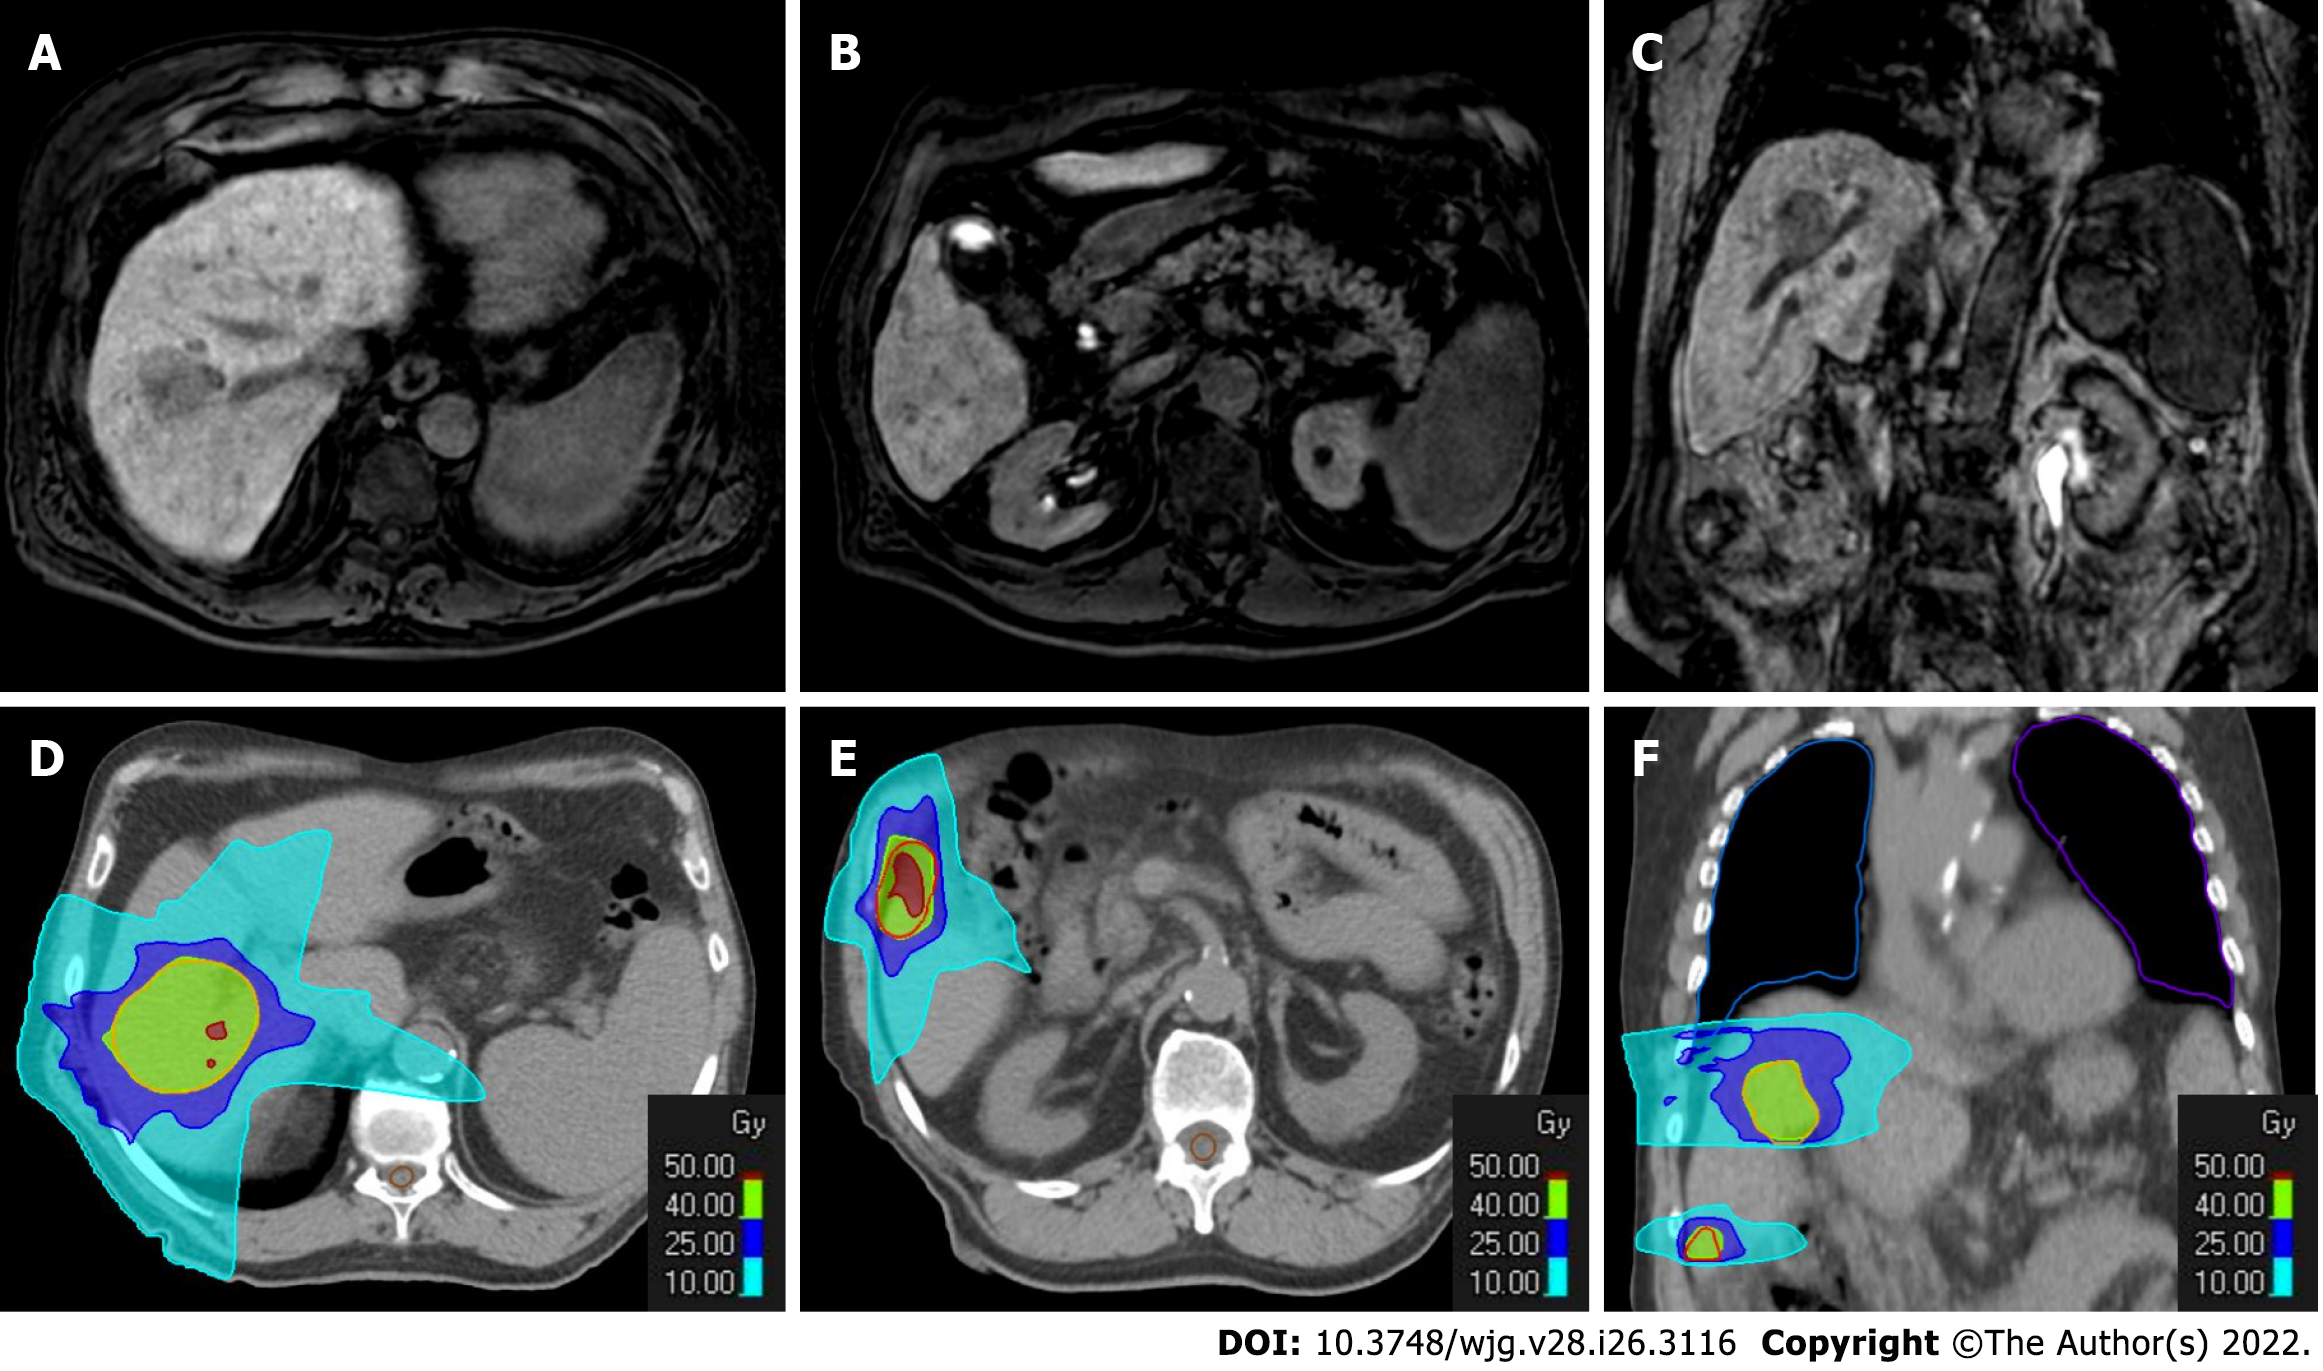
Figure 8 Radiotherapy treatment planning of a 70-yr-old male patient with two hypovascular hepatocellular carcinomas in segment VIII (4.
3 cm) and segment VI (1.3 cm). A-C: Hepatobiliary phase magnetic resonance imaging (MRI); D-F: Computed tomography (CT) simulation for radiation therapy planning. In the upper panel from A to C are reported hepatobiliary phase MRI images prior to stereotactic ablative radiotherapy treatment. In the bottom panel from D to F are reported CT images from radiotherapy treatment plan with isodose curve distributions.
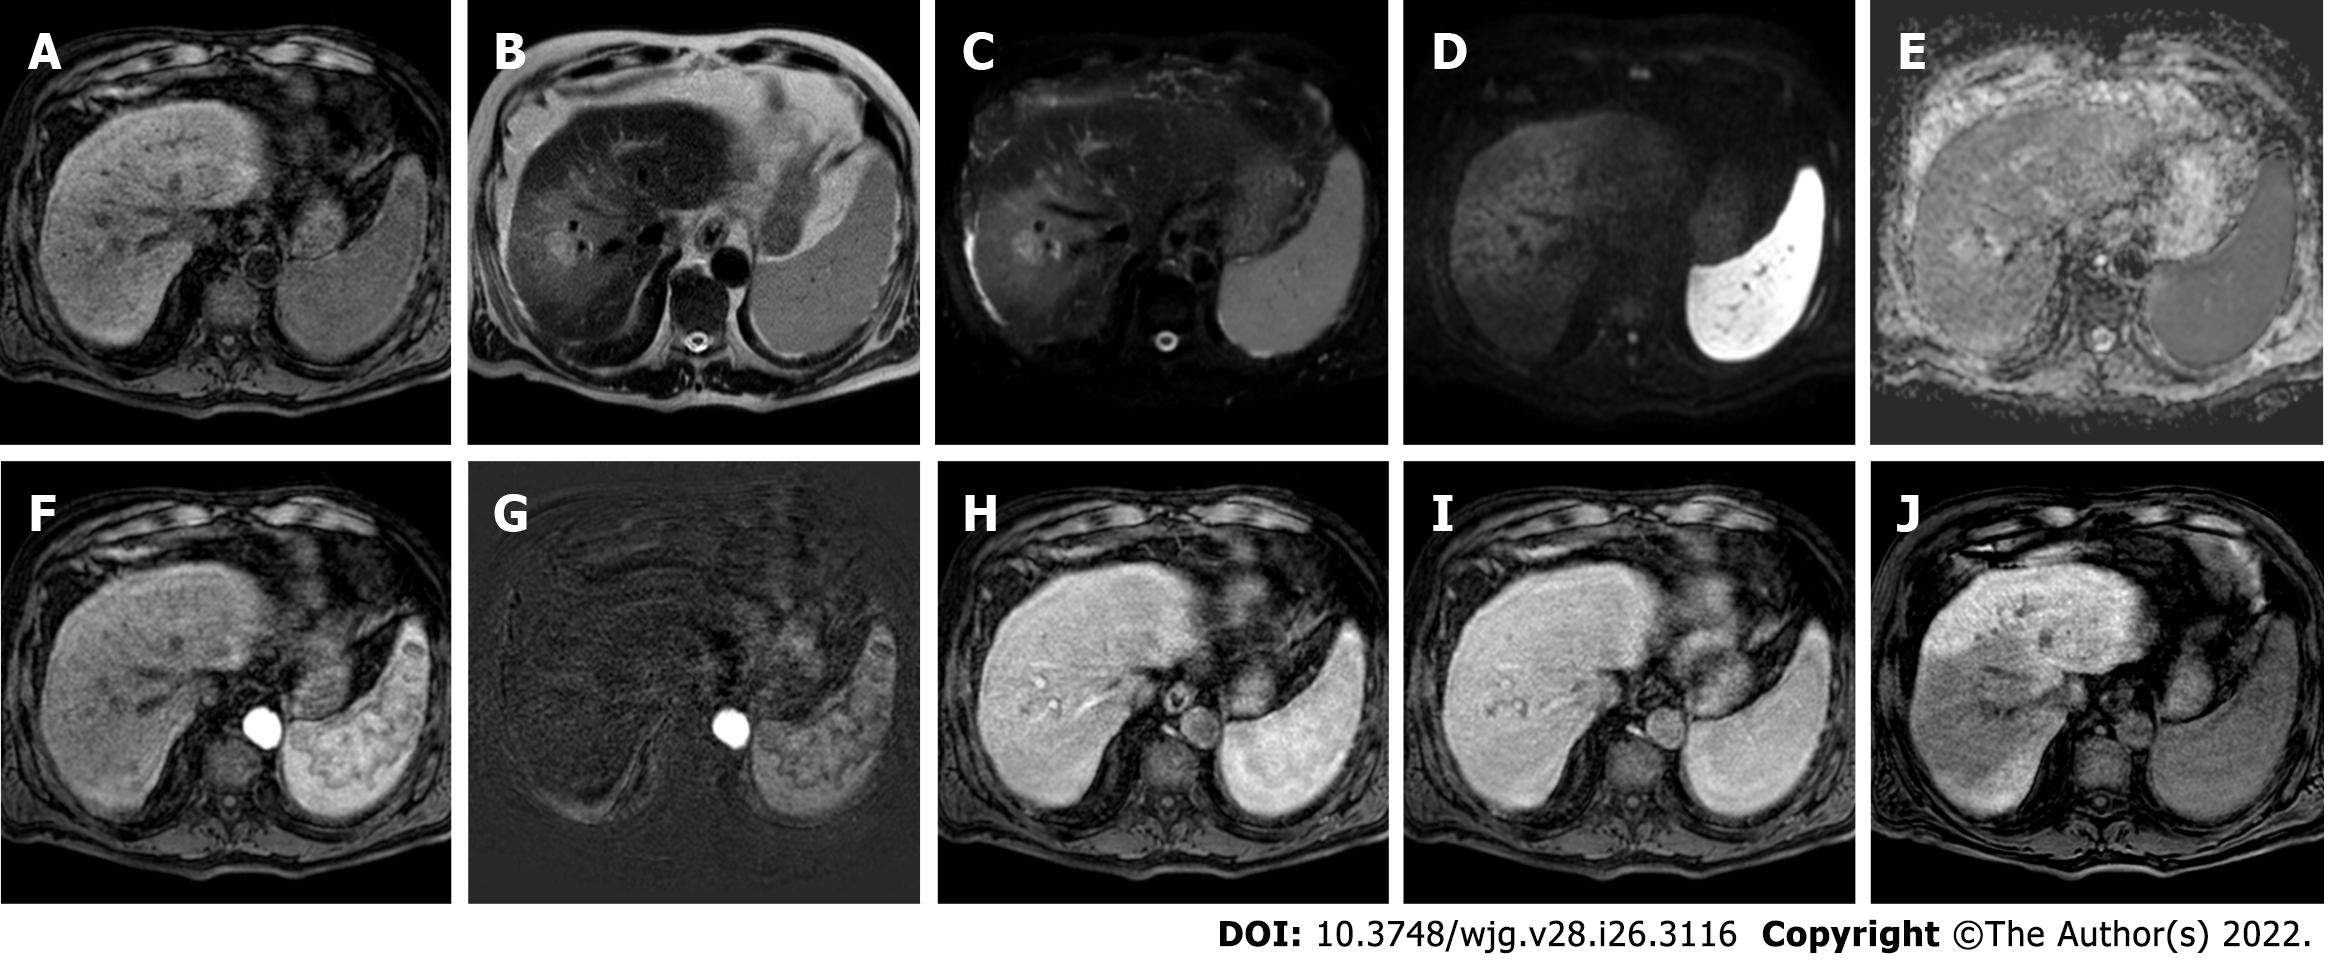
Figure 9 Four-months follow-up post stereotactic body radiation therapy liver magnetic resonance imaging of the hepatocellular carcinoma in segment VIII shown in the Figure 8.
A: Non contrast T1-weighted high resolution isotropic volume examination; B: T2-weighted image; C: T2-spectral attenuated inversion recovery; D: High b-value diffusion weighted imaging (DWI); E: Apparent diffusion coefficient (ADC) map; F: Arterial phase magnetic resonance imaging (MRI); G: Arterial phase MRI with image subtraction technique; H: Portal venous phase MRI; I: Delayed phase MRI; J: Hepatobiliary phase MRI. The liver MRI shows an ill-defined area of signal hypointensity in T1 in the treatment zone with a blurred and inhomogeneous signal hyperintensity with evidence of increased signal hyperintensity in the residual nodule. A shaded signal hyperintensity on DWI without signal hyperintensity of the previous lesion, with higher ADC values relative to the surrounding liver parenchyma. No areas of enhancement are shown, and a coarse hypointense signal in the hepatobiliary phase due to the initial fibrotic evolution of the treated zone is evident.
Figure 10 The evolution of the hepatocellular carcinoma stereotactic body radiation therapy treatment zone in patient shown in Figures 8 and 9.
A: Hepatobiliary phase (HBP) magnetic resonance imaging (MRI) prior to stereotactic body radiation therapy (SBRT); B: SBRT plan with isodose curve distributions; C: HBP MRI 4 mo after treatment; D: HBP MRI 8 mo after treatment; E: HBP MRI 20 mo after treatment. The MRIs demonstrated the progressive fibrotic evolution of the treatment area.
Figure 11 Follow-up liver magnetic resonance imaging of abovementioned patient (Figures 8-10), 20 mo after stereotactic body radiation therapy.
A: Out-phase T1-weighted image; B: Non contrast T1-weighted high resolution isotropic volume examination; C: T2-spectral attenuated inversion recovery; D: High b-value diffusion weighted imaging; E: Apparent diffusion coefficient map; F: T2-weighted image; G: Arterial phase magnetic resonance imaging (MRI); H: Arterial phase MRI with image subtraction technique; I: Portal venous phase MRI; J: Portal venous phase MRI with image subtraction technique; K and L: Hepatobiliary phase MRI. MRI revealed parenchymal retraction with signal hypointensity on T1-weighted images corresponding to inhomogeneous hyperintensity in axial and coronal T2 sequences, with no significant increase in diffusion signal. Dynamic perfusion study after contrast medium administration: no enhancement in arterial phase and a progressive enhancement in delayed phase with corresponding hypointense signal in the hepatobiliary excretion phase testifying the fibrotic evolution of the treated liver and the absence of locoregional recurrence.
- Citation: Gatti M, Maino C, Darvizeh F, Serafini A, Tricarico E, Guarneri A, Inchingolo R, Ippolito D, Ricardi U, Fonio P, Faletti R. Role of gadoxetic acid-enhanced liver magnetic resonance imaging in the evaluation of hepatocellular carcinoma after locoregional treatment. World J Gastroenterol 2022; 28(26): 3116-3131
- URL: https://www.wjgnet.com/1007-9327/full/v28/i26/3116.htm
- DOI: https://dx.doi.org/10.3748/wjg.v28.i26.3116


