Copyright
©The Author(s) 2022.
World J Gastroenterol. Jun 14, 2022; 28(22): 2509-2522
Published online Jun 14, 2022. doi: 10.3748/wjg.v28.i22.2509
Published online Jun 14, 2022. doi: 10.3748/wjg.v28.i22.2509
Figure 1 Study design.
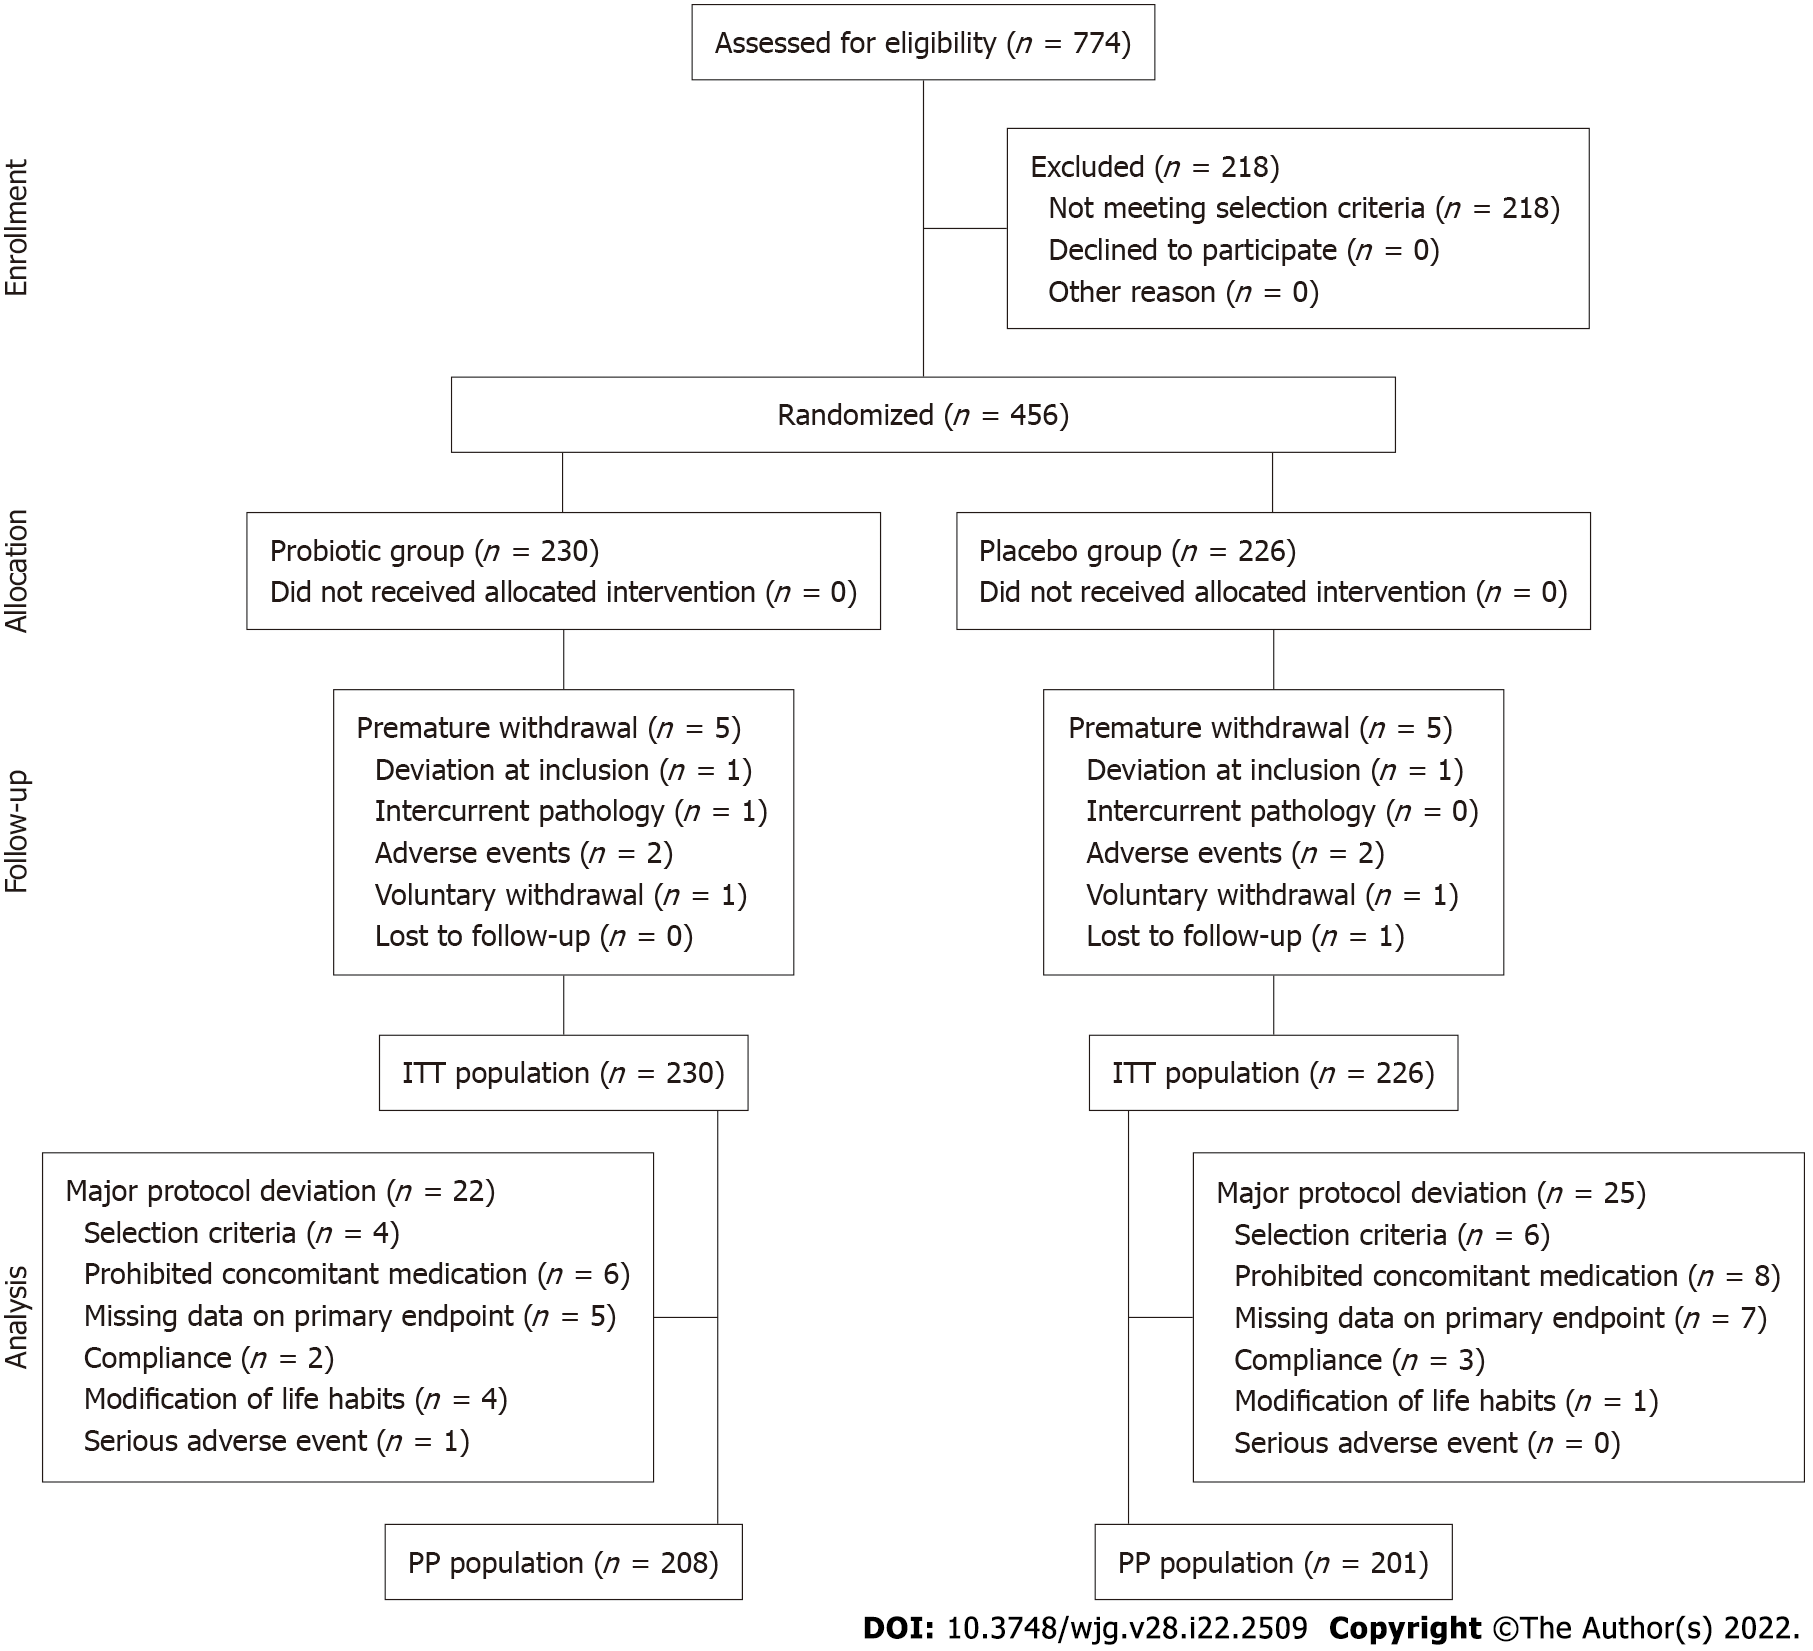
Figure 2 CONSORT flow diagram.
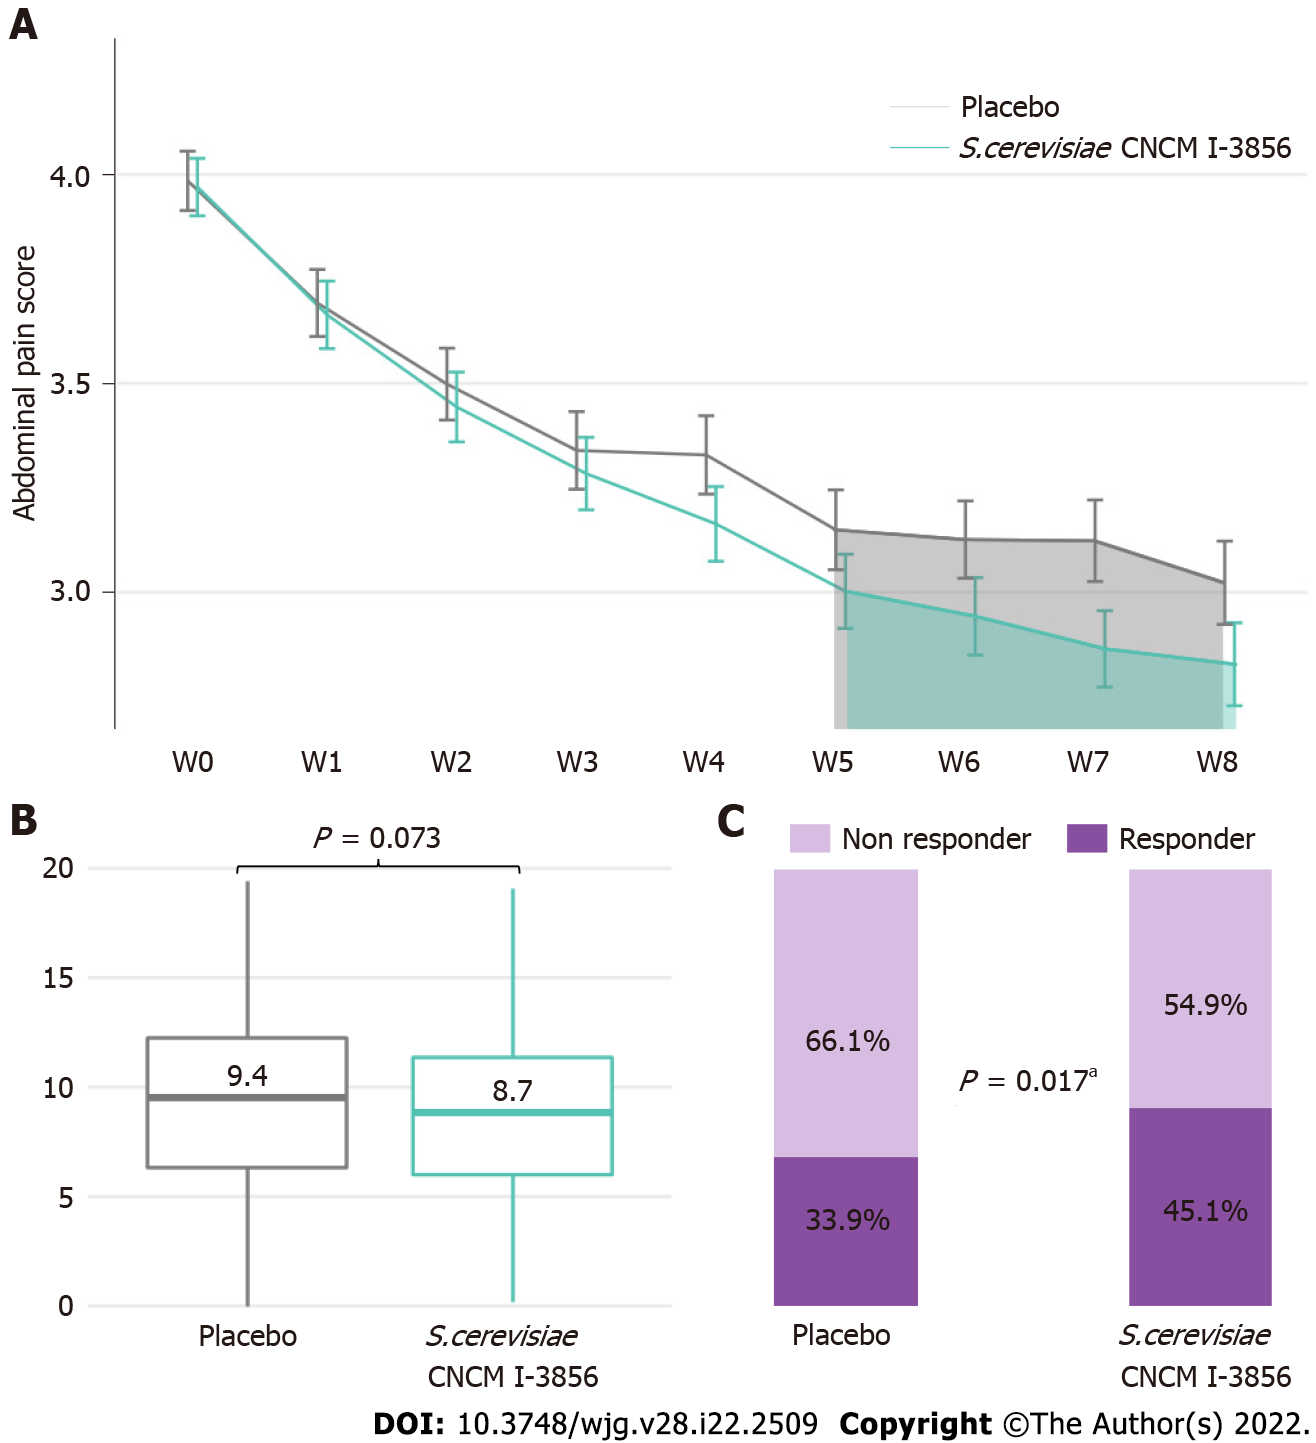
Figure 3 Abdominal pain.
A: Abdominal pain score evolution; B: Area under the curve (W5-W8) of abdominal pain; C: Percentage of abdominal pain responders in the ITT population. Significant result (aP < 0.05, Chi2 test). Similar profiles were obtained for the PP population (Supplementary Figure 1).
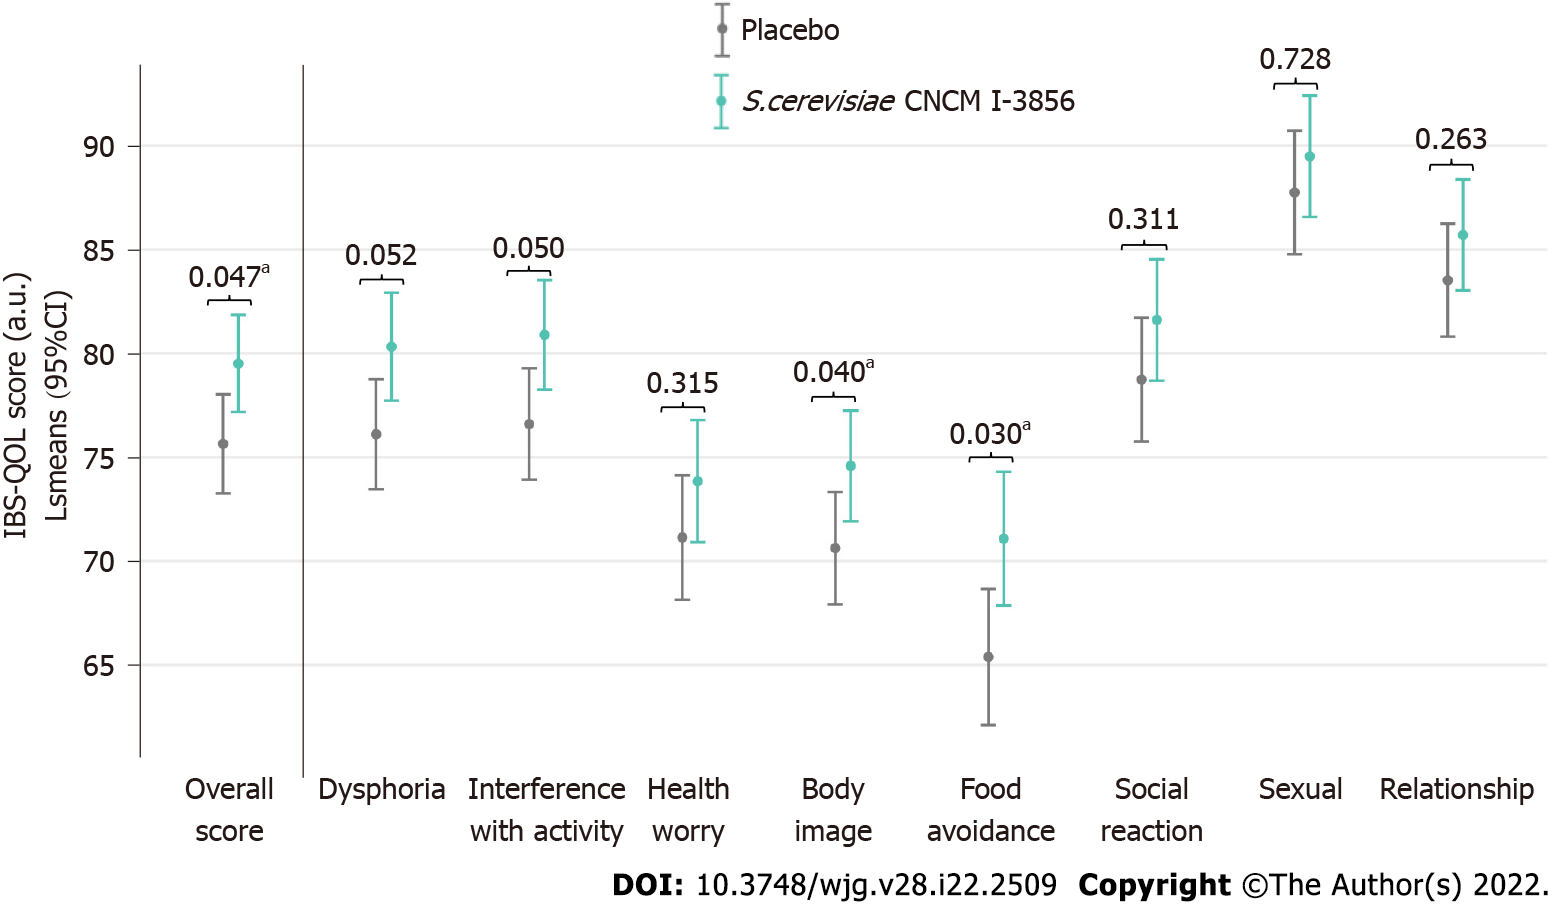
Figure 4 Irritable bowel syndrome-specific quality of life questionnaire scores at the end of the intervention (V3) in the PP population.
Significant result (aP < 0.05, ANOVA model).
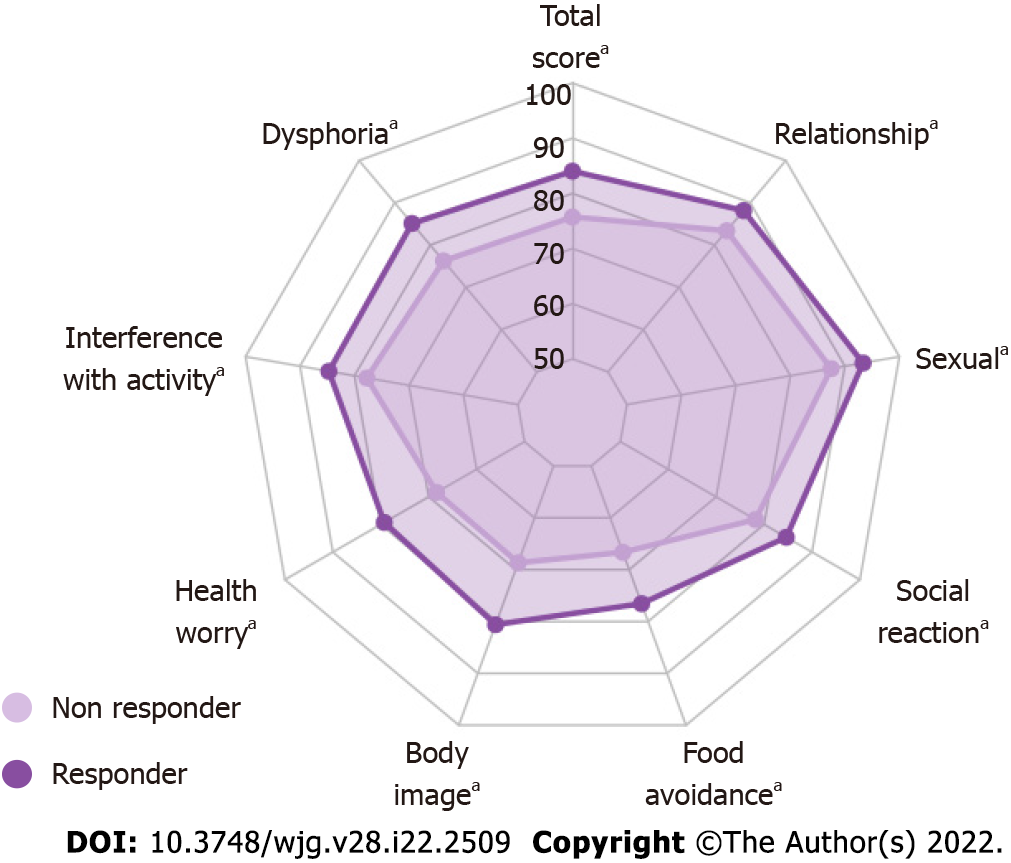
Figure 5 Irritable bowel syndrome-specific quality of life questionnaire scores at the end of the intervention (V3) adjusted to baseline (V1) in ITT abdominal pain responders supplemented with Saccharomycescerevisiae CNCM I-3856.
PP population radar plot: Supplementary Figure 3. Significant result (aP < 0.05, ANCOVA for repeated measures). Between-group differences are shown in Supplementary Table 2.
- Citation: Mourey F, Decherf A, Jeanne JF, Clément-Ziza M, Grisoni ML, Machuron F, Legrain-Raspaud S, Bourreille A, Desreumaux P. Saccharomyces cerevisiae I-3856 in irritable bowel syndrome with predominant constipation. World J Gastroenterol 2022; 28(22): 2509-2522
- URL: https://www.wjgnet.com/1007-9327/full/v28/i22/2509.htm
- DOI: https://dx.doi.org/10.3748/wjg.v28.i22.2509


