Copyright
©The Author(s) 2022.
World J Gastroenterol. Jun 7, 2022; 28(21): 2320-2333
Published online Jun 7, 2022. doi: 10.3748/wjg.v28.i21.2320
Published online Jun 7, 2022. doi: 10.3748/wjg.v28.i21.2320
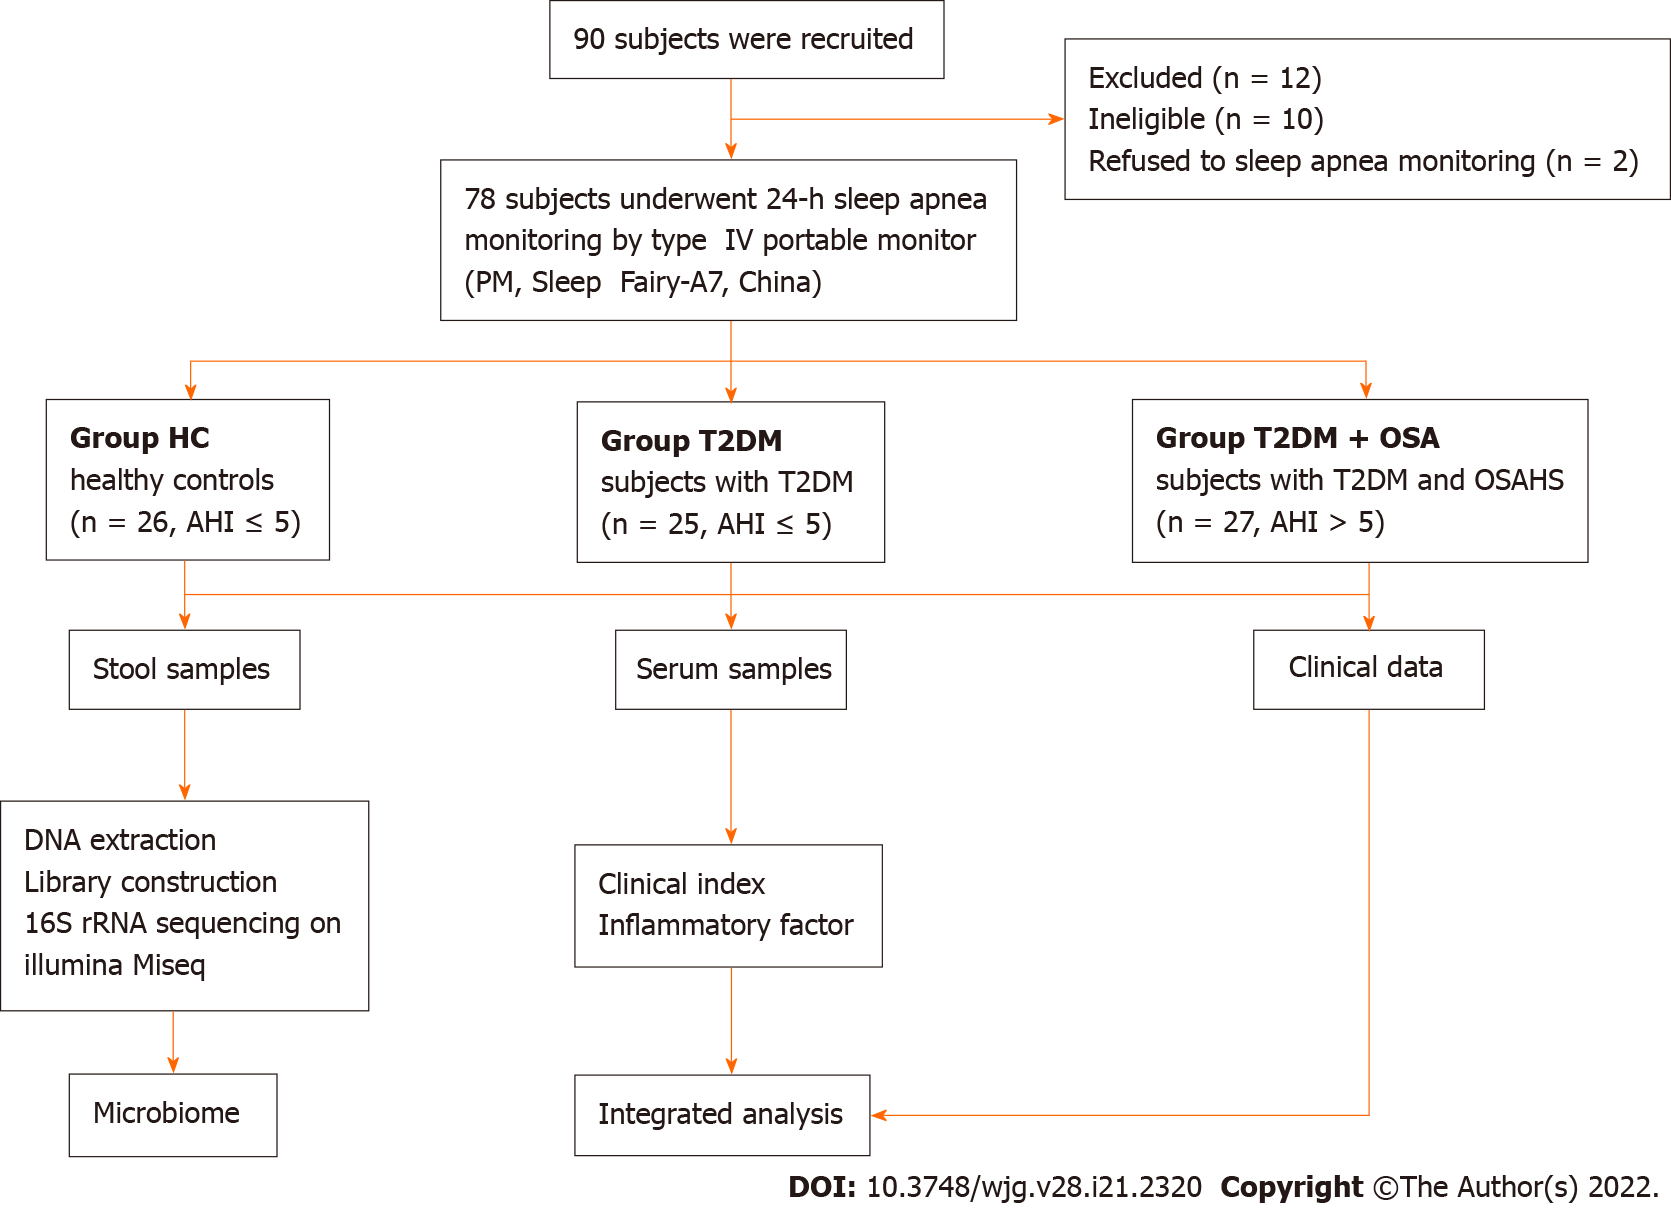
Figure 1 Flowchart of the study.
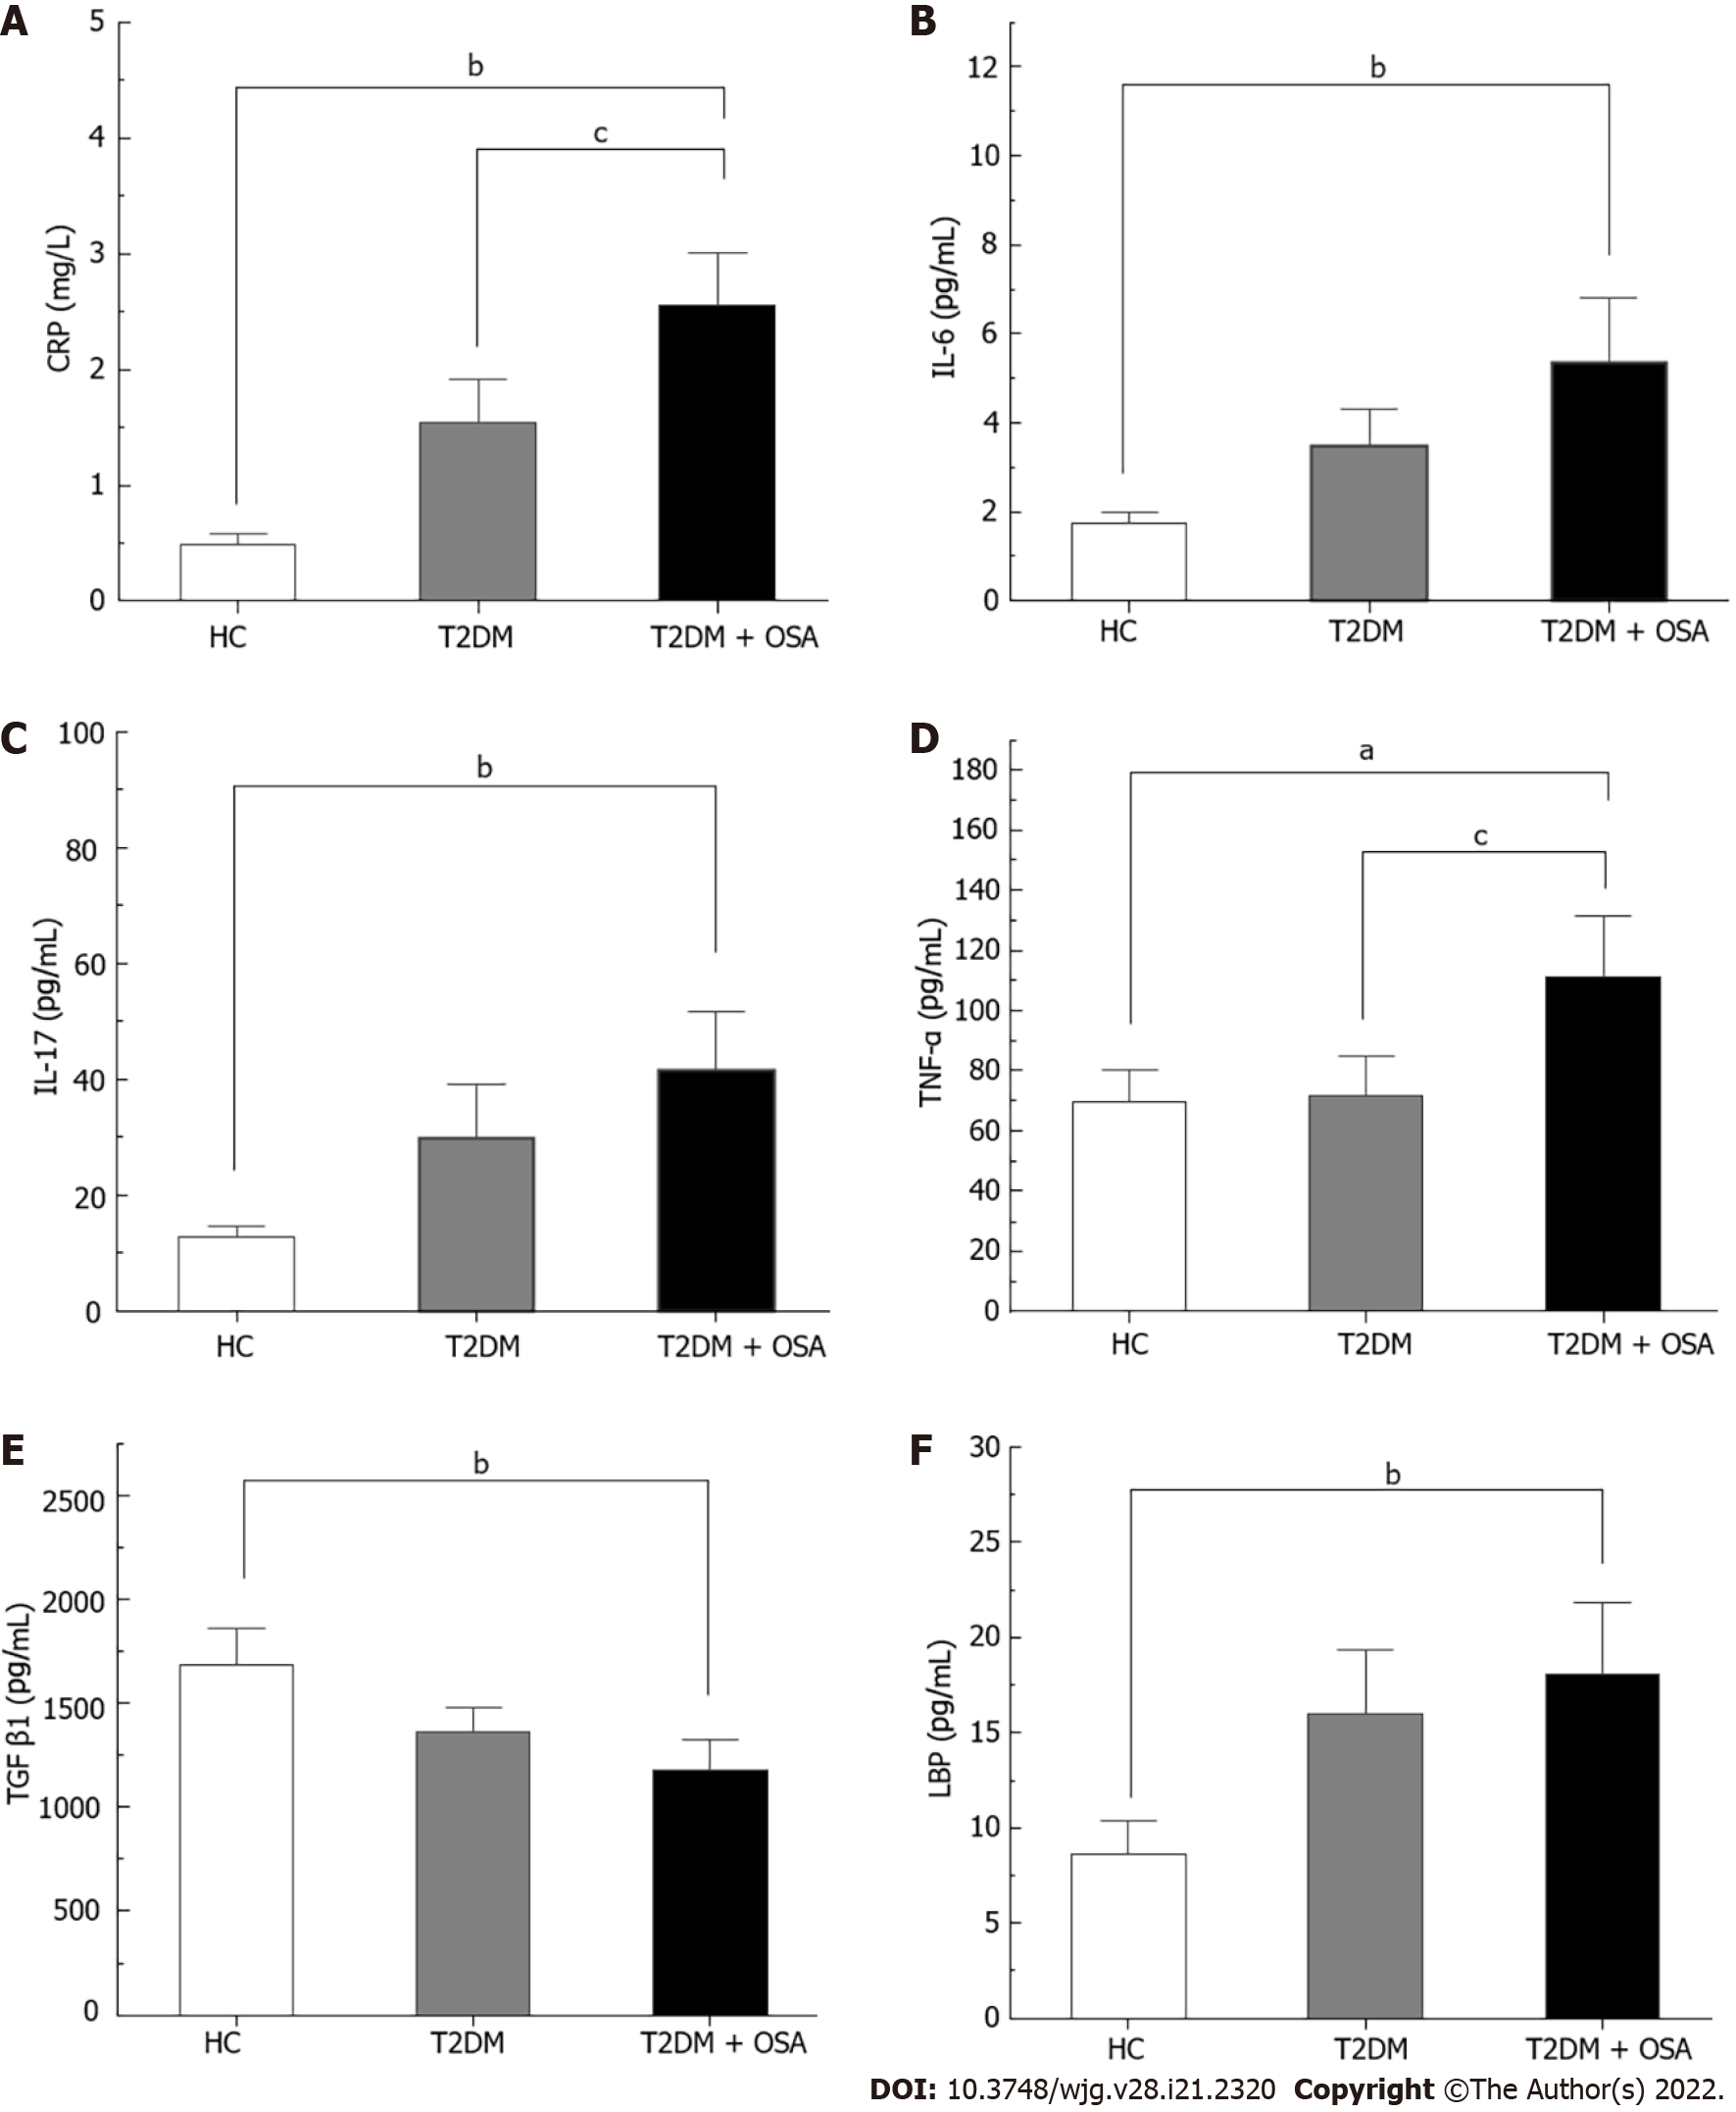
Figure 2 The concentrations of inflammatory factors in groups healthy control, type 2 diabetes mellitus, and type 2 diabetes mellitus plus obstructive sleep apnea.
A: CRP; B: IL-6; C: IL-17; D: TNF-α; E: TGF-β1; F: LBP. Bar charts show the means ± SE of the mean. aP < 0.05 vs healthy control (HC); bP < 0.01 vs HC; cP < 0.05 vs type 2 diabetes mellitus. The P value was based on Kruskal–Wallis test or one-way ANOVA. A significant difference was shown by the least significant difference t-test or Mann–Whitney U test. Significant differences were adjusted by Bonferroni correction. CRP: C-reaction protein; IL-6: Interleukin-6; IL-17: Interleukin-17; TNF-α: Tumor necrosis factor-α; TGF-β1: Transforming growth factor beta 1; LBP: Lipopolysaccharide-binding protein; HC: Healthy control; T2DM: Type 2 diabetes mellitus; OSA: Obstructive sleep apnea.
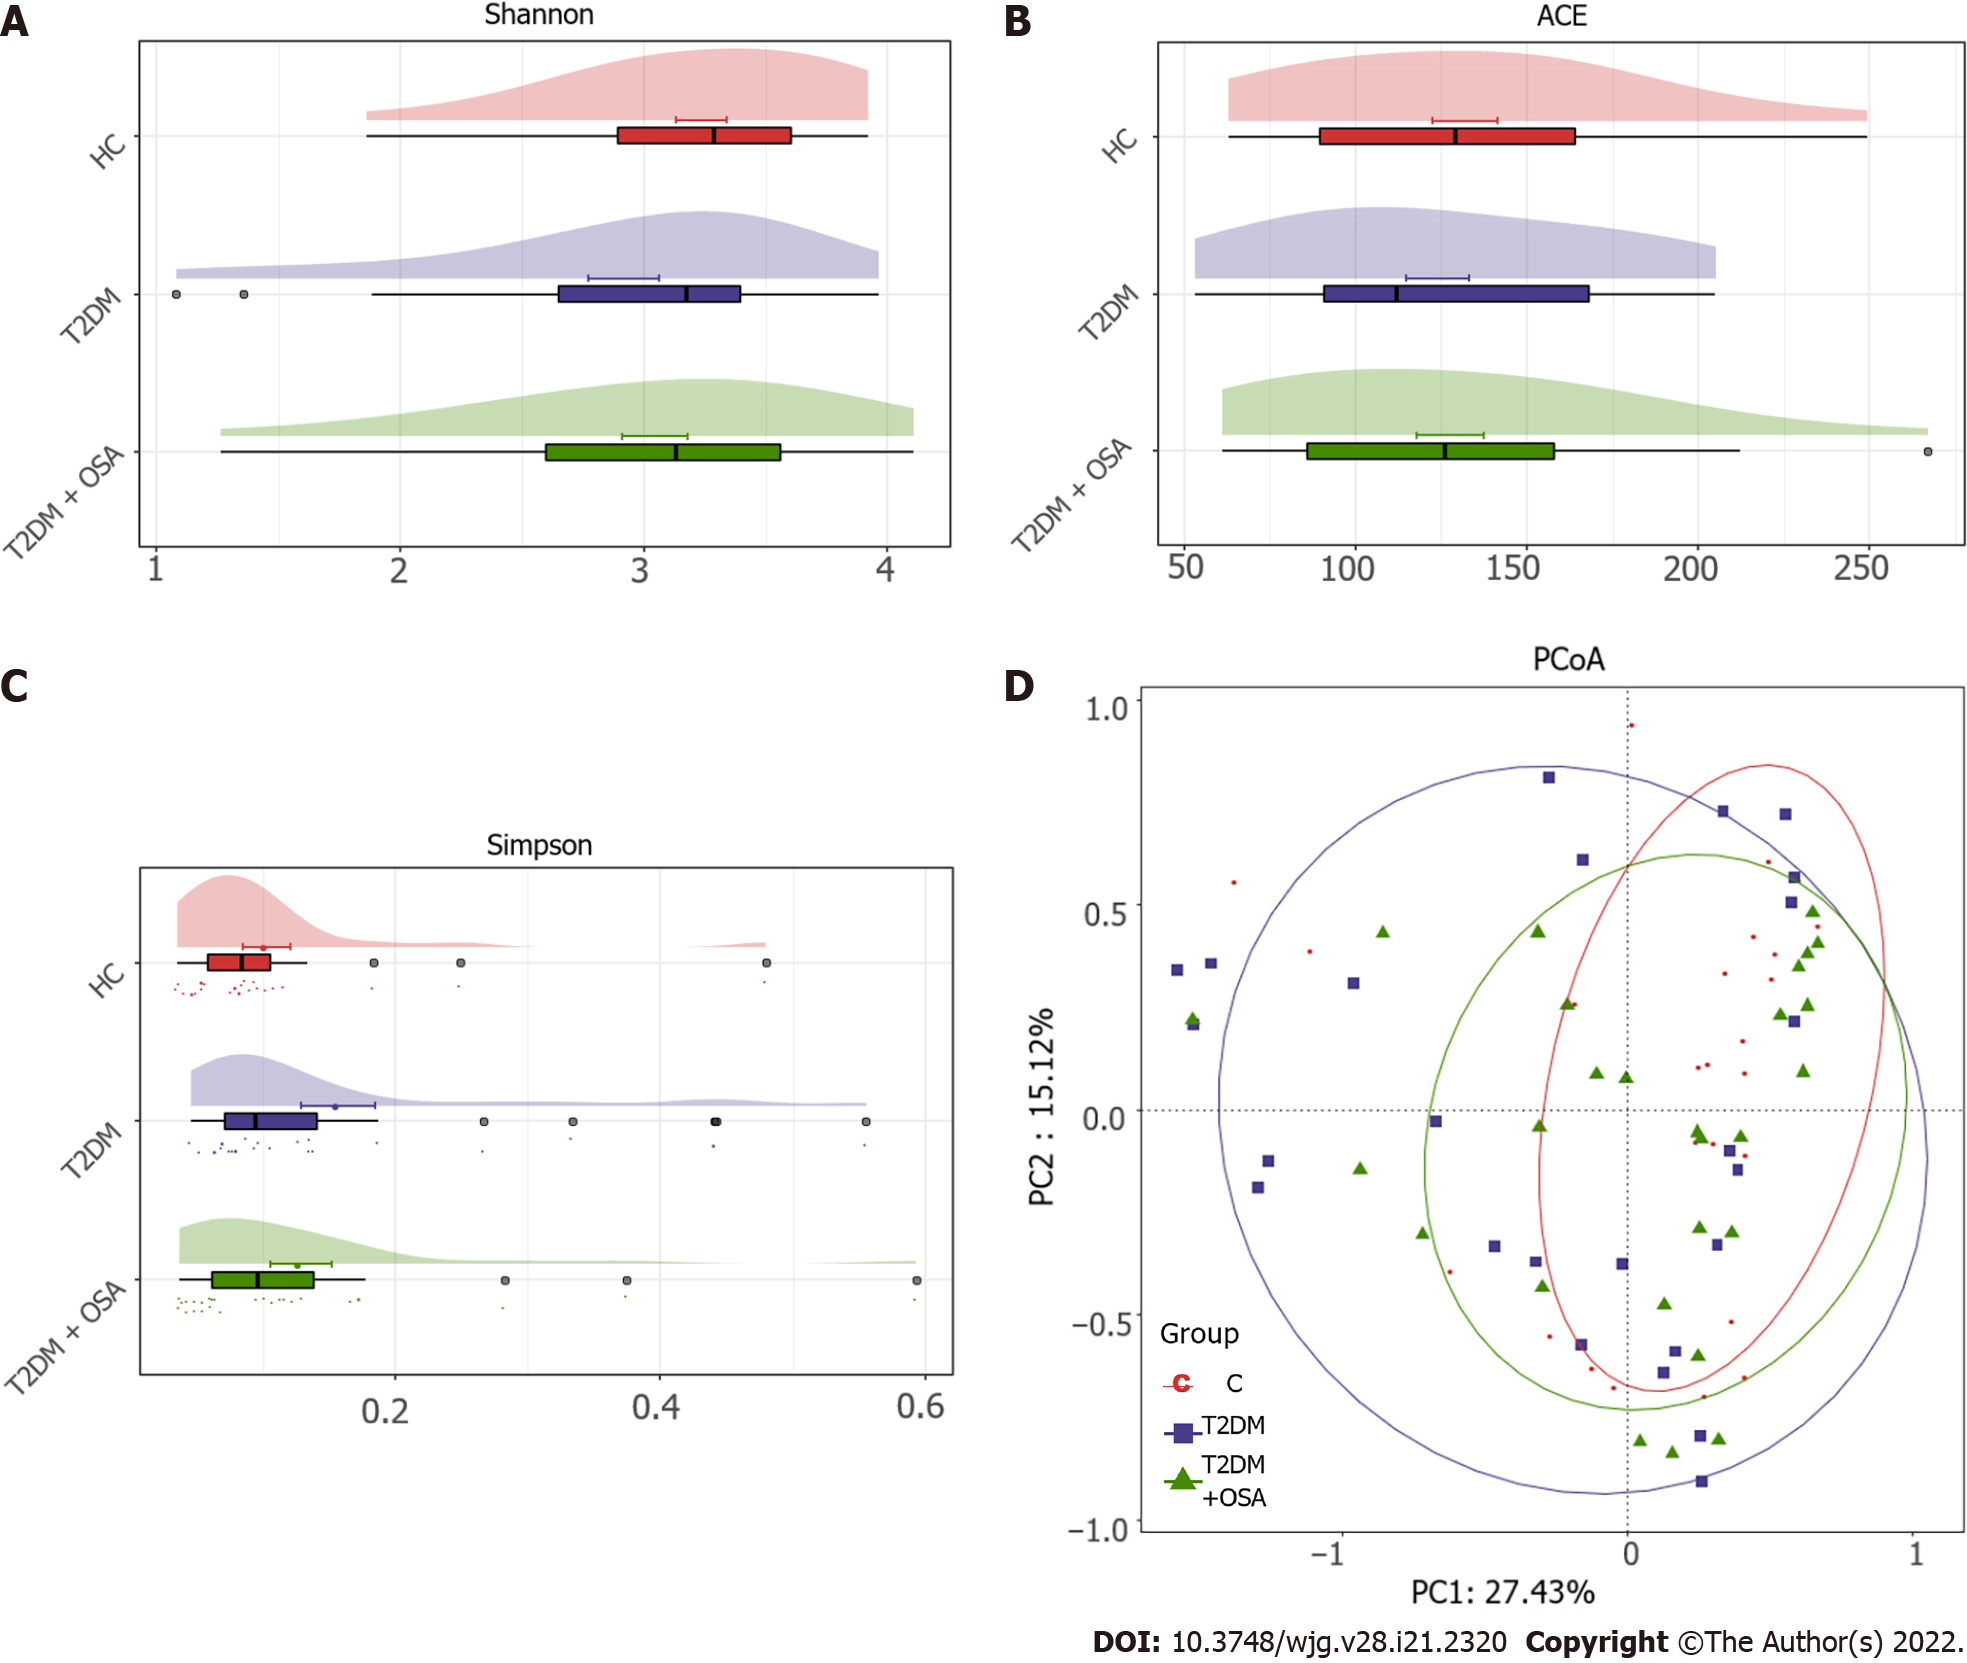
Figure 3 The gut microbial diversity and structures of the gut microbiota in groups healthy control, type 2 diabetes mellitus, and type 2 diabetes mellitus plus obstructive sleep apnea.
A: Shannon index; B: ACE estimator; C: Simpson index; D: Principal coordinates analysis plot of the gut microbiota among groups healthy control, type 2 diabetes mellitus, and type 2 diabetes mellitus plus obstructive sleep apnea. HC: Healthy control; T2DM: Type 2 diabetes mellitus; OSA: Obstructive sleep apnea.
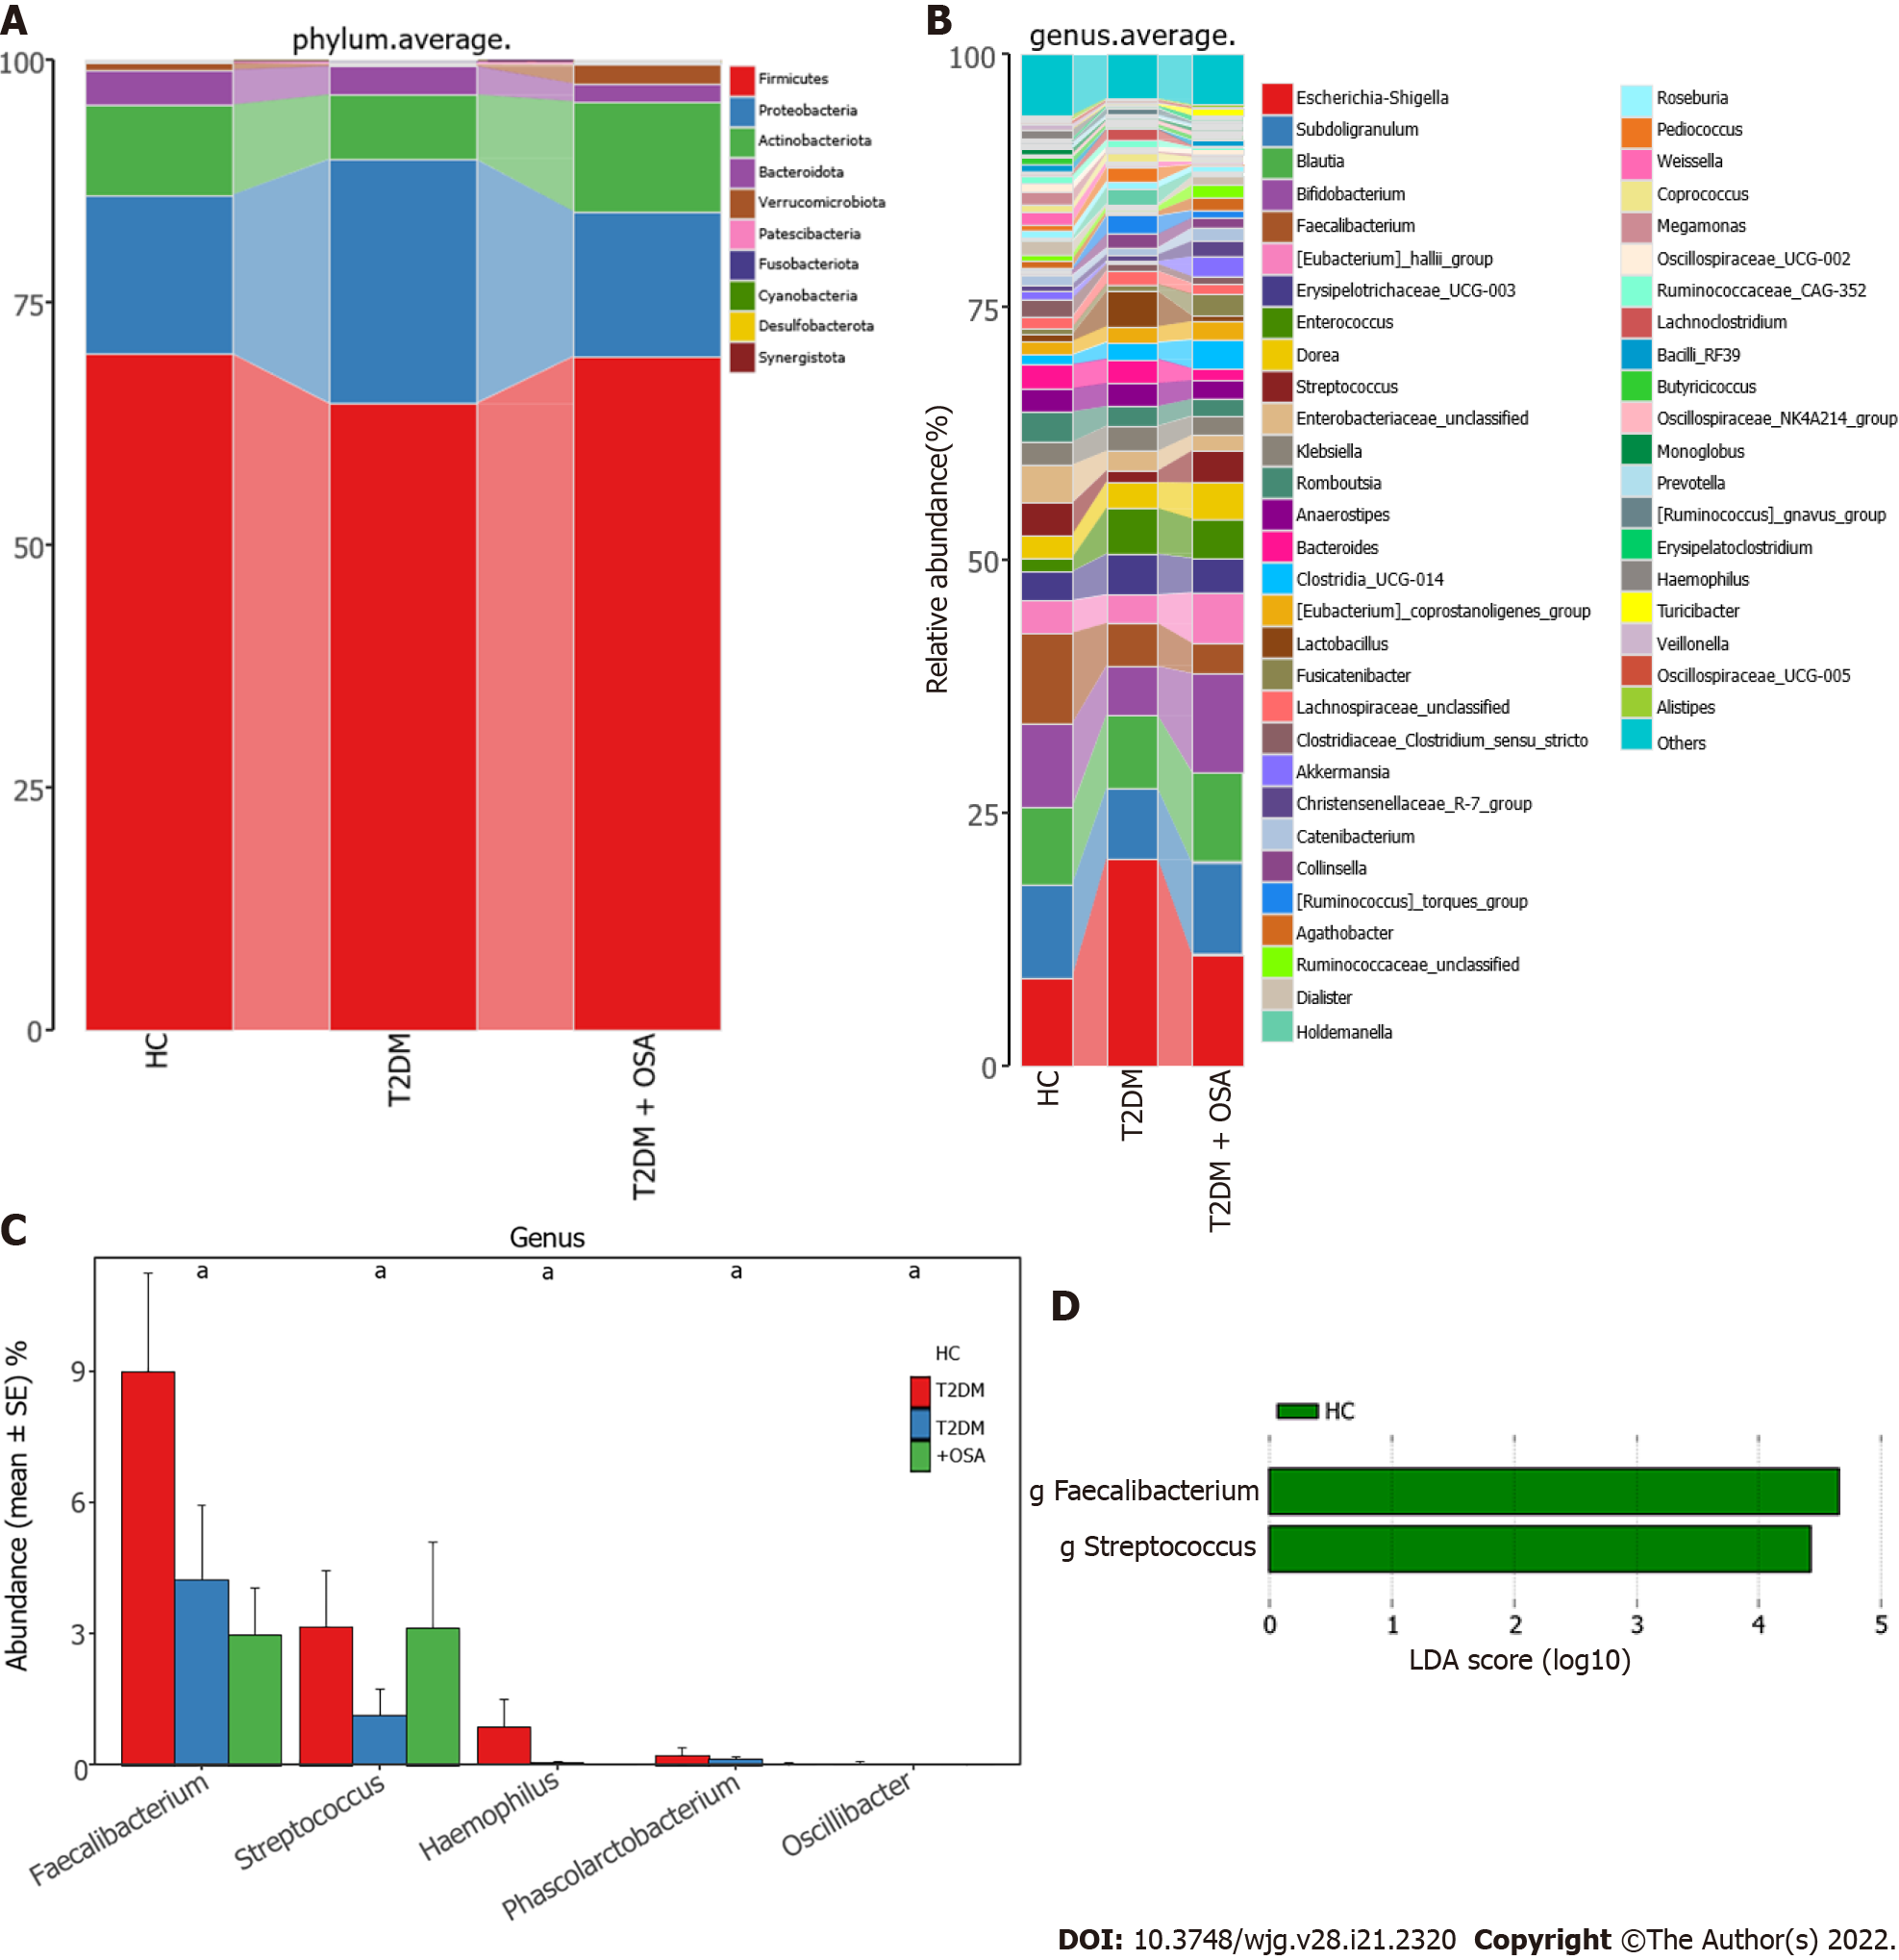
Figure 4 Average compositions and relative abundance of the bacterial community among three groups at different levels.
A: Average relative abundance histogram of dominant species composition stratified by group at the phylum levels; B: Average relative abundance histogram of dominant species composition stratified by group at the genus levels; C: Histograms for genera with significant differences. Bar chart showing the mean ± SE of each group; D: Linear discriminant analysis analysis column diagram. LDA: Linear discriminant analysis. aP < 0.05. Significant difference shown by the Kruskal–Wallis rank-sum test.
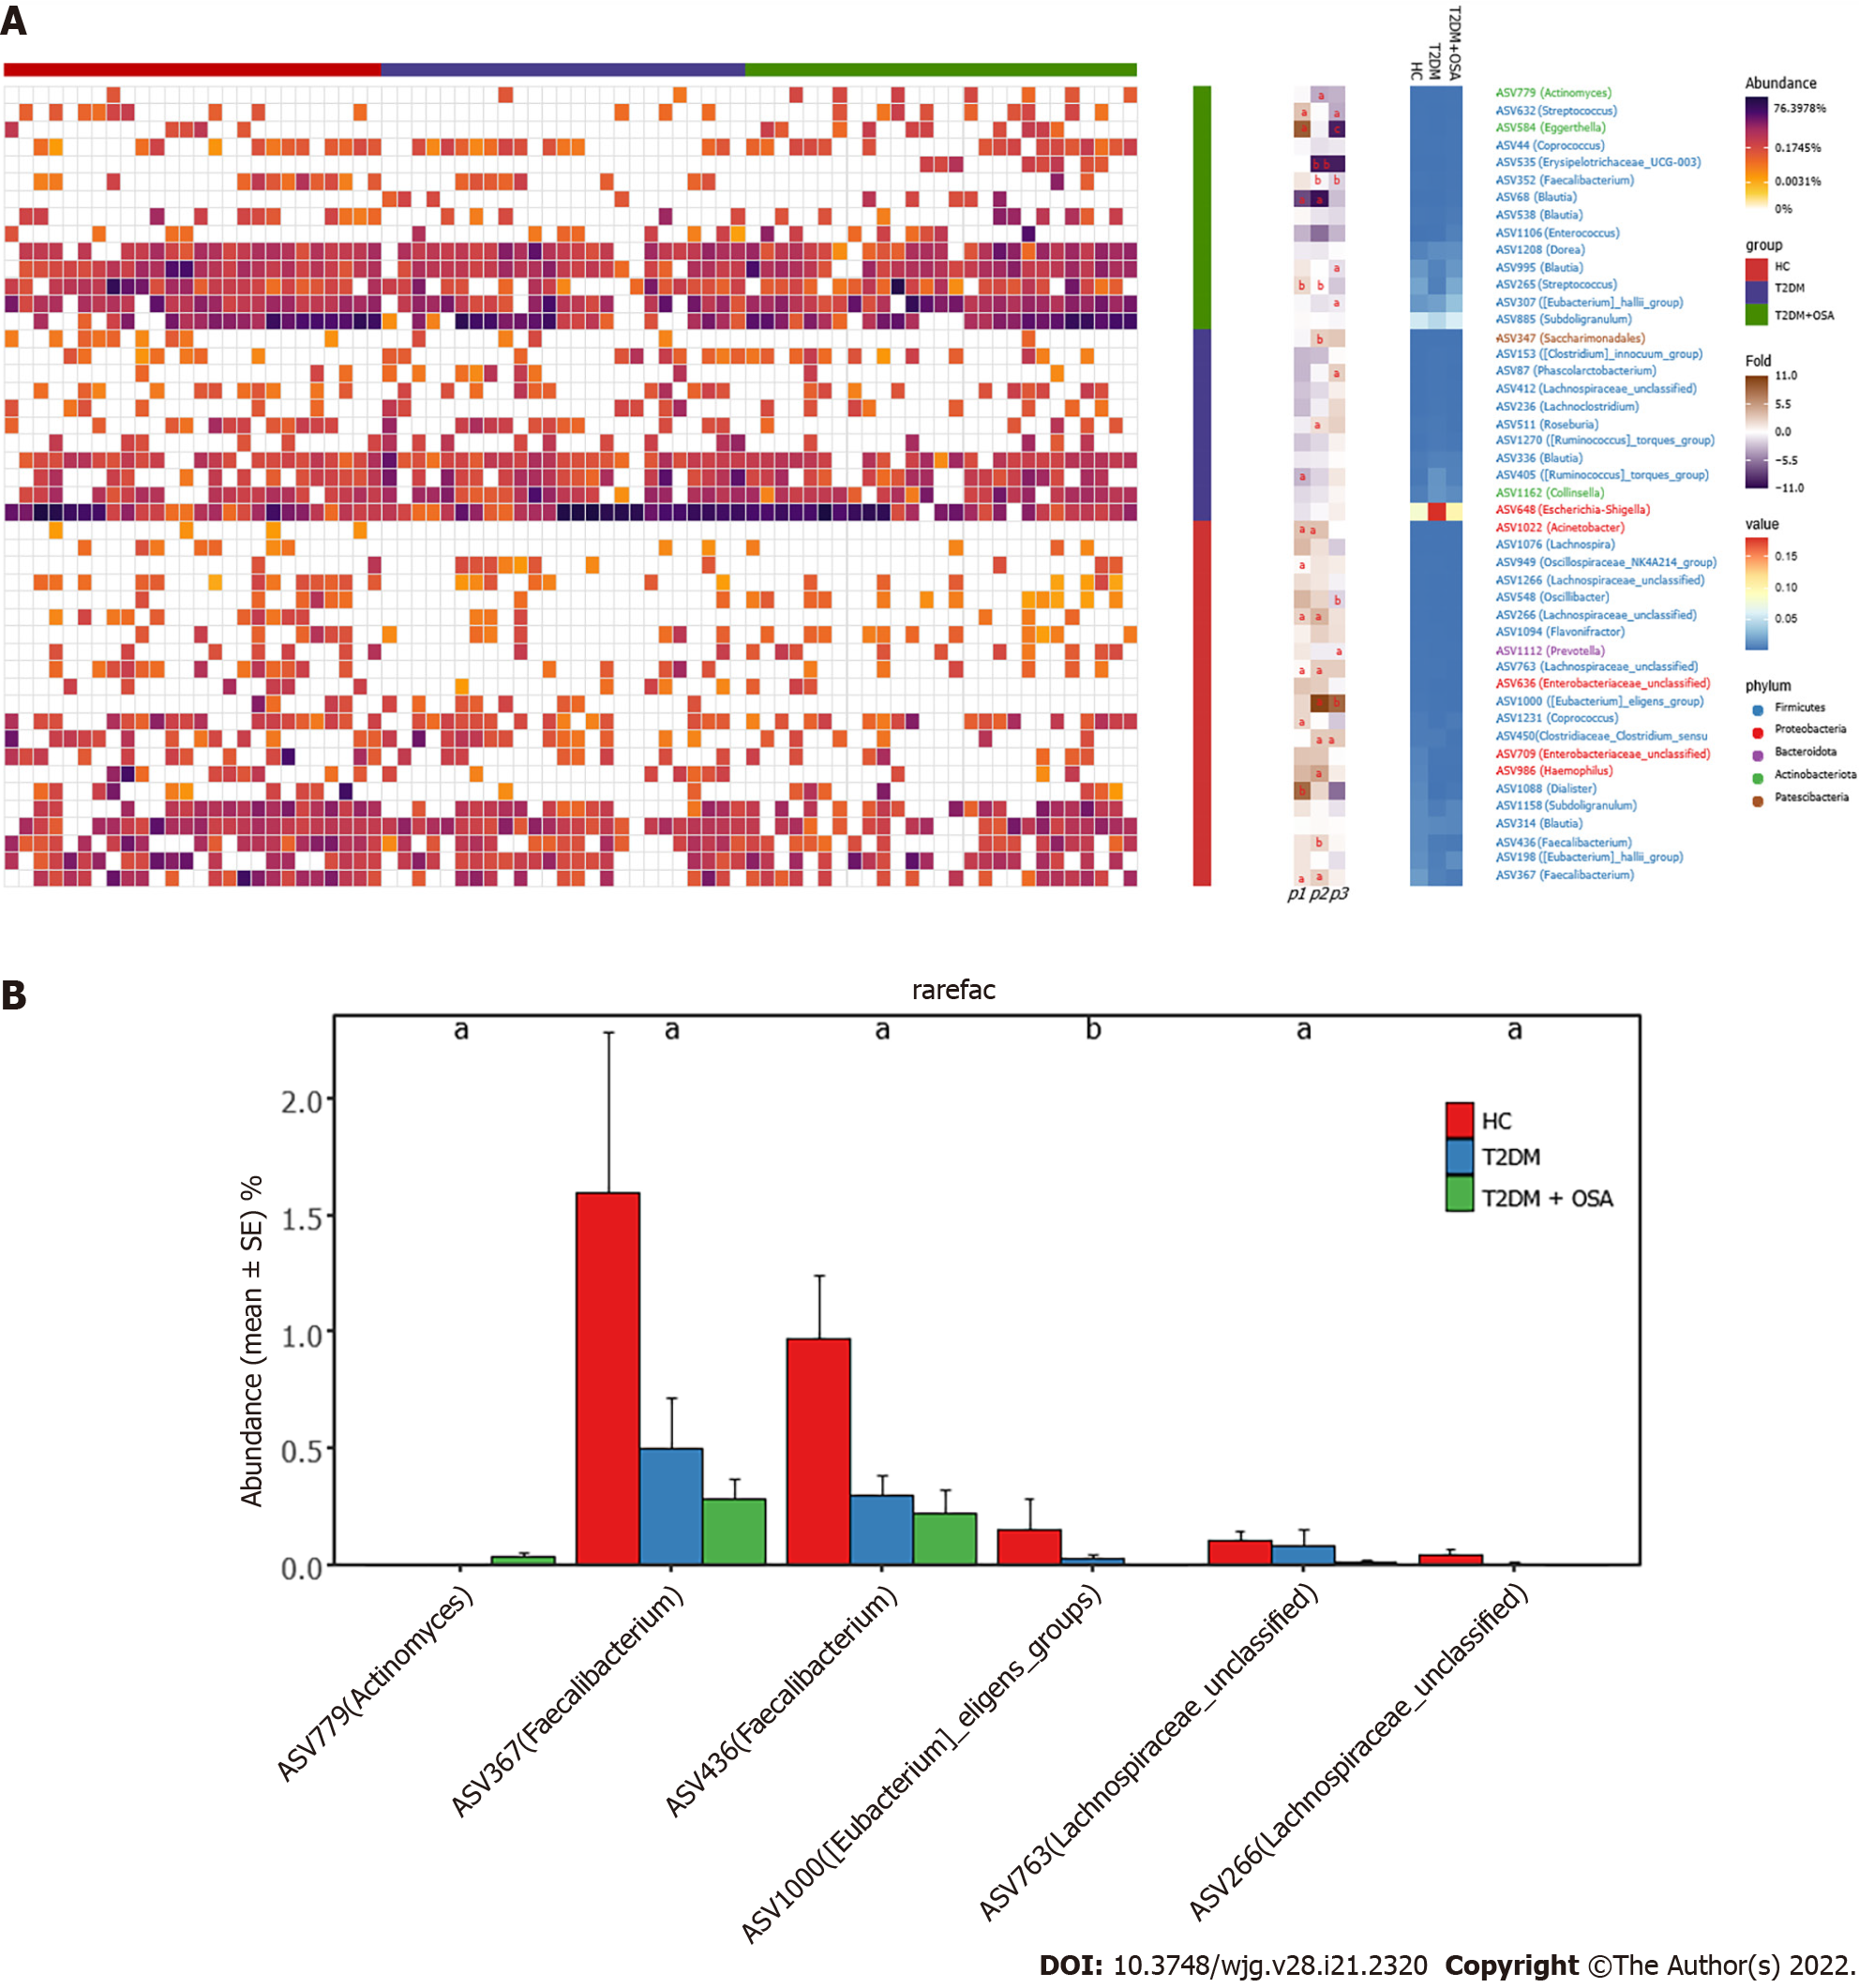
Figure 5 Amplicon sequence variants contributing to the changes in the gut microbiota in groups healthy control, type 2 diabetes mellitus, and type 2 diabetes mellitus plus obstructive sleep apnea.
A: The heatmap shows the relative abundance of the 46 amplicon sequence variants (ASVs) significantly different in the three groups. The fold ratio (log2-transformed) indicated the relative abundance of the 46 ASVs between the two different groups [P1: Type 2 diabetes mellitus (T2DM) + obstructive sleep apnea (OSA) vs T2DM; P2: T2DM + OSA vs healthy control (HC); P3: HC vs T2DM]. aP < 0.05, bP < 0.01, cP < 0.001. Significant difference shown by the Mann–Whitney U test; B: With the increase in disease components, six key ASVs showed increasing or decreasing trends. aP < 0.05, bP < 0.01.
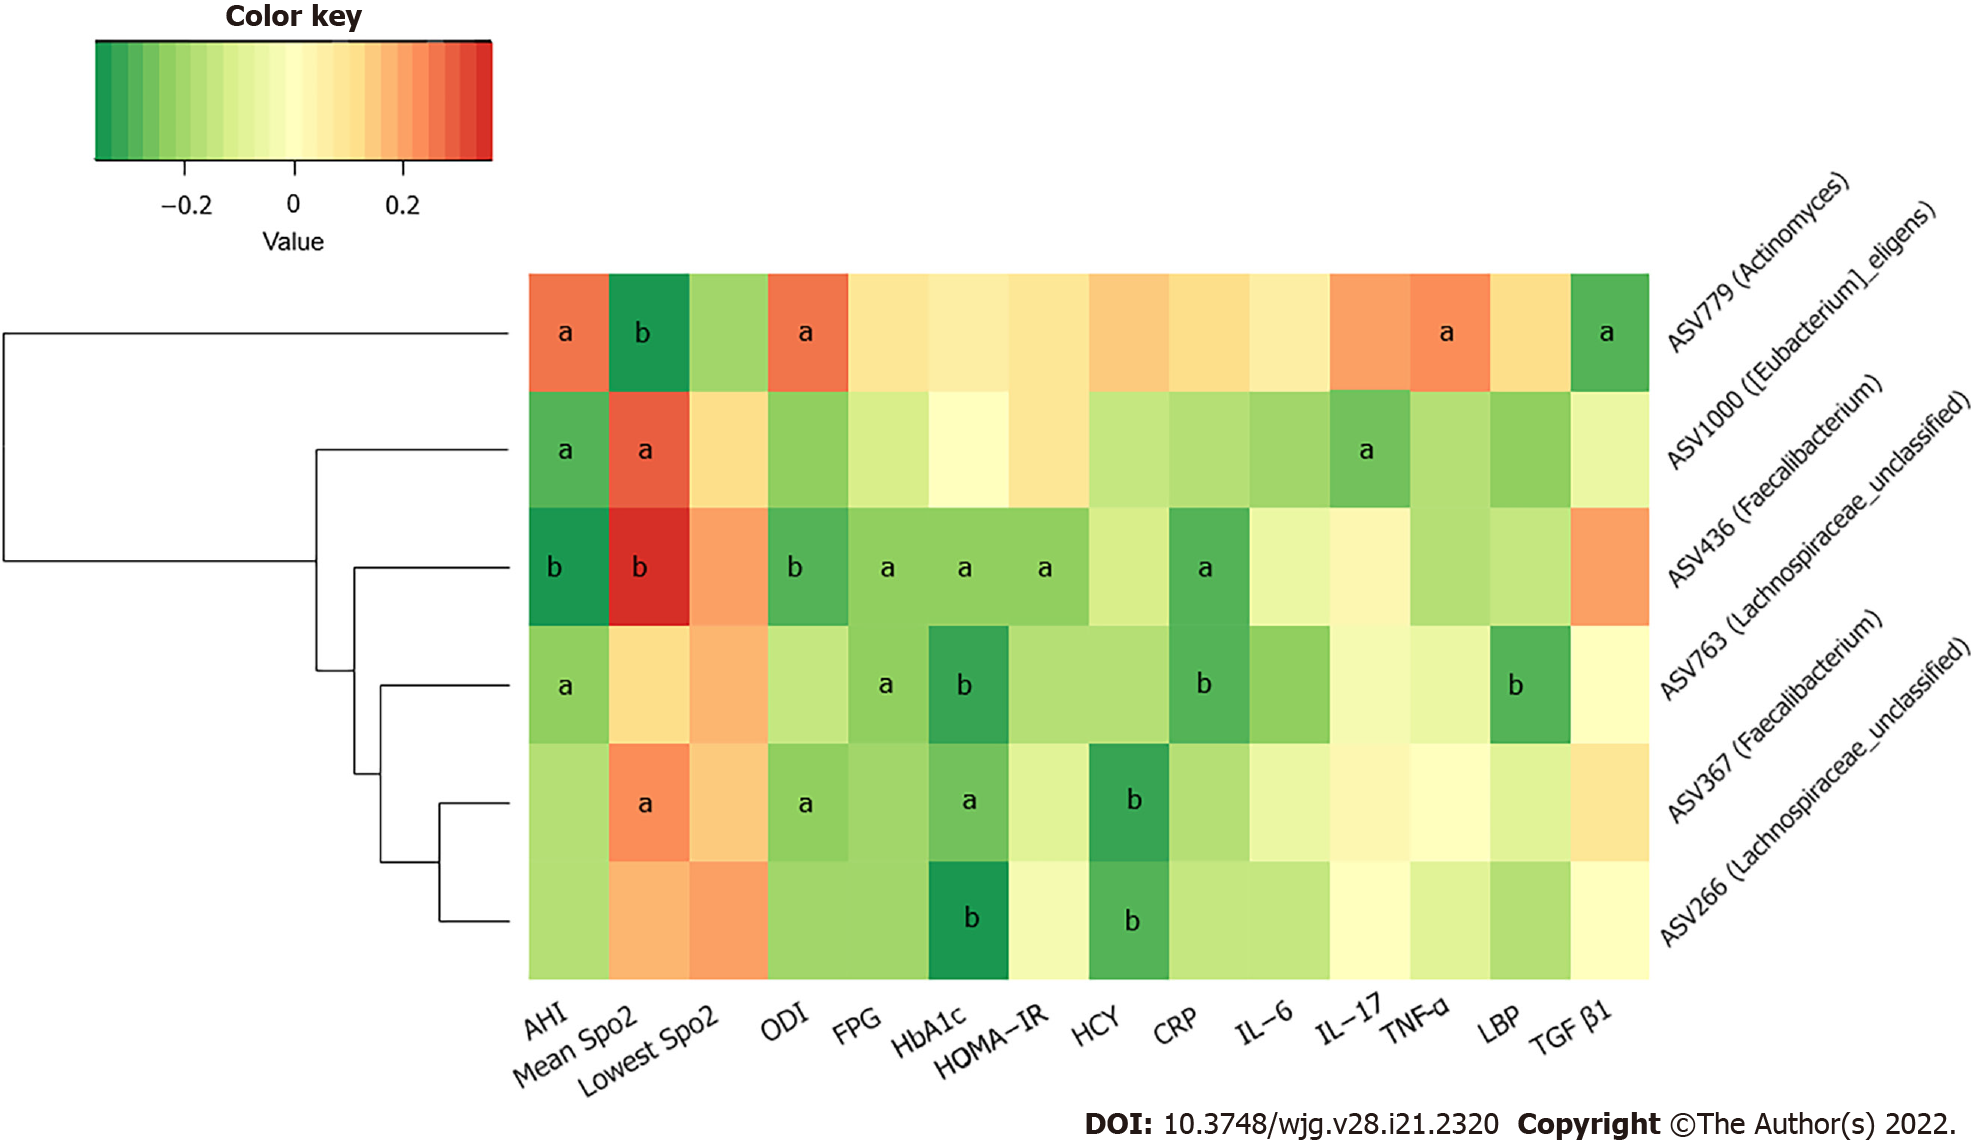
Figure 6 Heatmap of correlation among key amplicon sequence variants of gut microbiota and metabolic and inflammatory indicators.
The color of the cells represents the Spearman’s correlation coefficient between each amplicon sequence variant and clinical parameter. aP < 0.05; bP < 0.01.
- Citation: Tang SS, Liang CH, Liu YL, Wei W, Deng XR, Shi XY, Wang LM, Zhang LJ, Yuan HJ. Intermittent hypoxia is involved in gut microbial dysbiosis in type 2 diabetes mellitus and obstructive sleep apnea-hypopnea syndrome. World J Gastroenterol 2022; 28(21): 2320-2333
- URL: https://www.wjgnet.com/1007-9327/full/v28/i21/2320.htm
- DOI: https://dx.doi.org/10.3748/wjg.v28.i21.2320


