Copyright
©The Author(s) 2022.
World J Gastroenterol. May 7, 2022; 28(17): 1814-1829
Published online May 7, 2022. doi: 10.3748/wjg.v28.i17.1814
Published online May 7, 2022. doi: 10.3748/wjg.v28.i17.1814
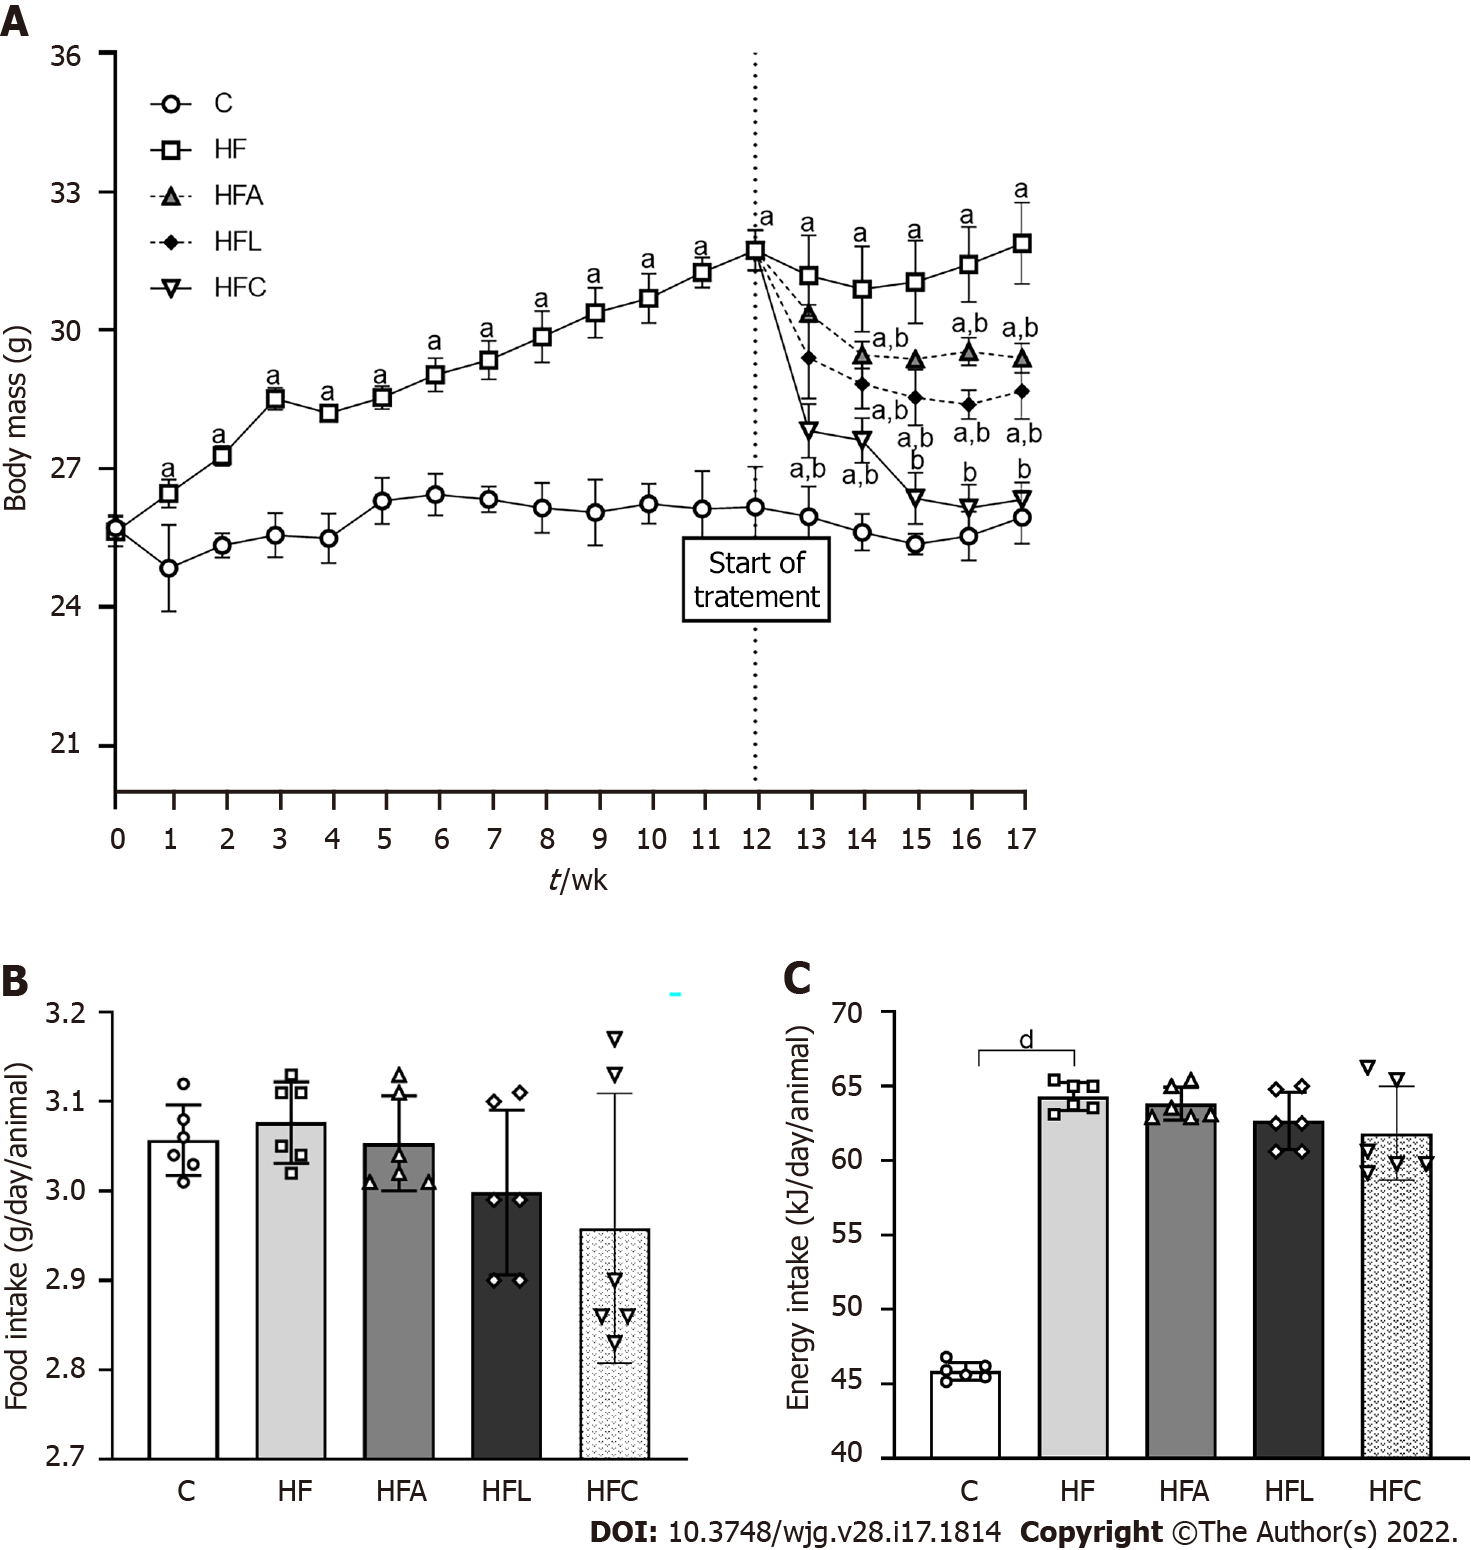
Figure 1 Body mass and food behavior.
A: Body mass evolution; B: Food intake; C: Energy intake. Brown-Forsythe and Welch one-way ANOVA and Dunnett T3 post hoc test (mean ± SD, n = 6). Significant differences are indicated as follows: aP < 0.05; bP < 0.01; dP < 0.0001. C: Control diet; HF: High-fat diet; HFA: High-fat diet plus PPAR-alpha agonist (WY14643); HFL: High-fat diet plus DPP-4 inhibitor (linagliptin); HFC: High-fat diet plus the combination of WY14643 with linagliptin.
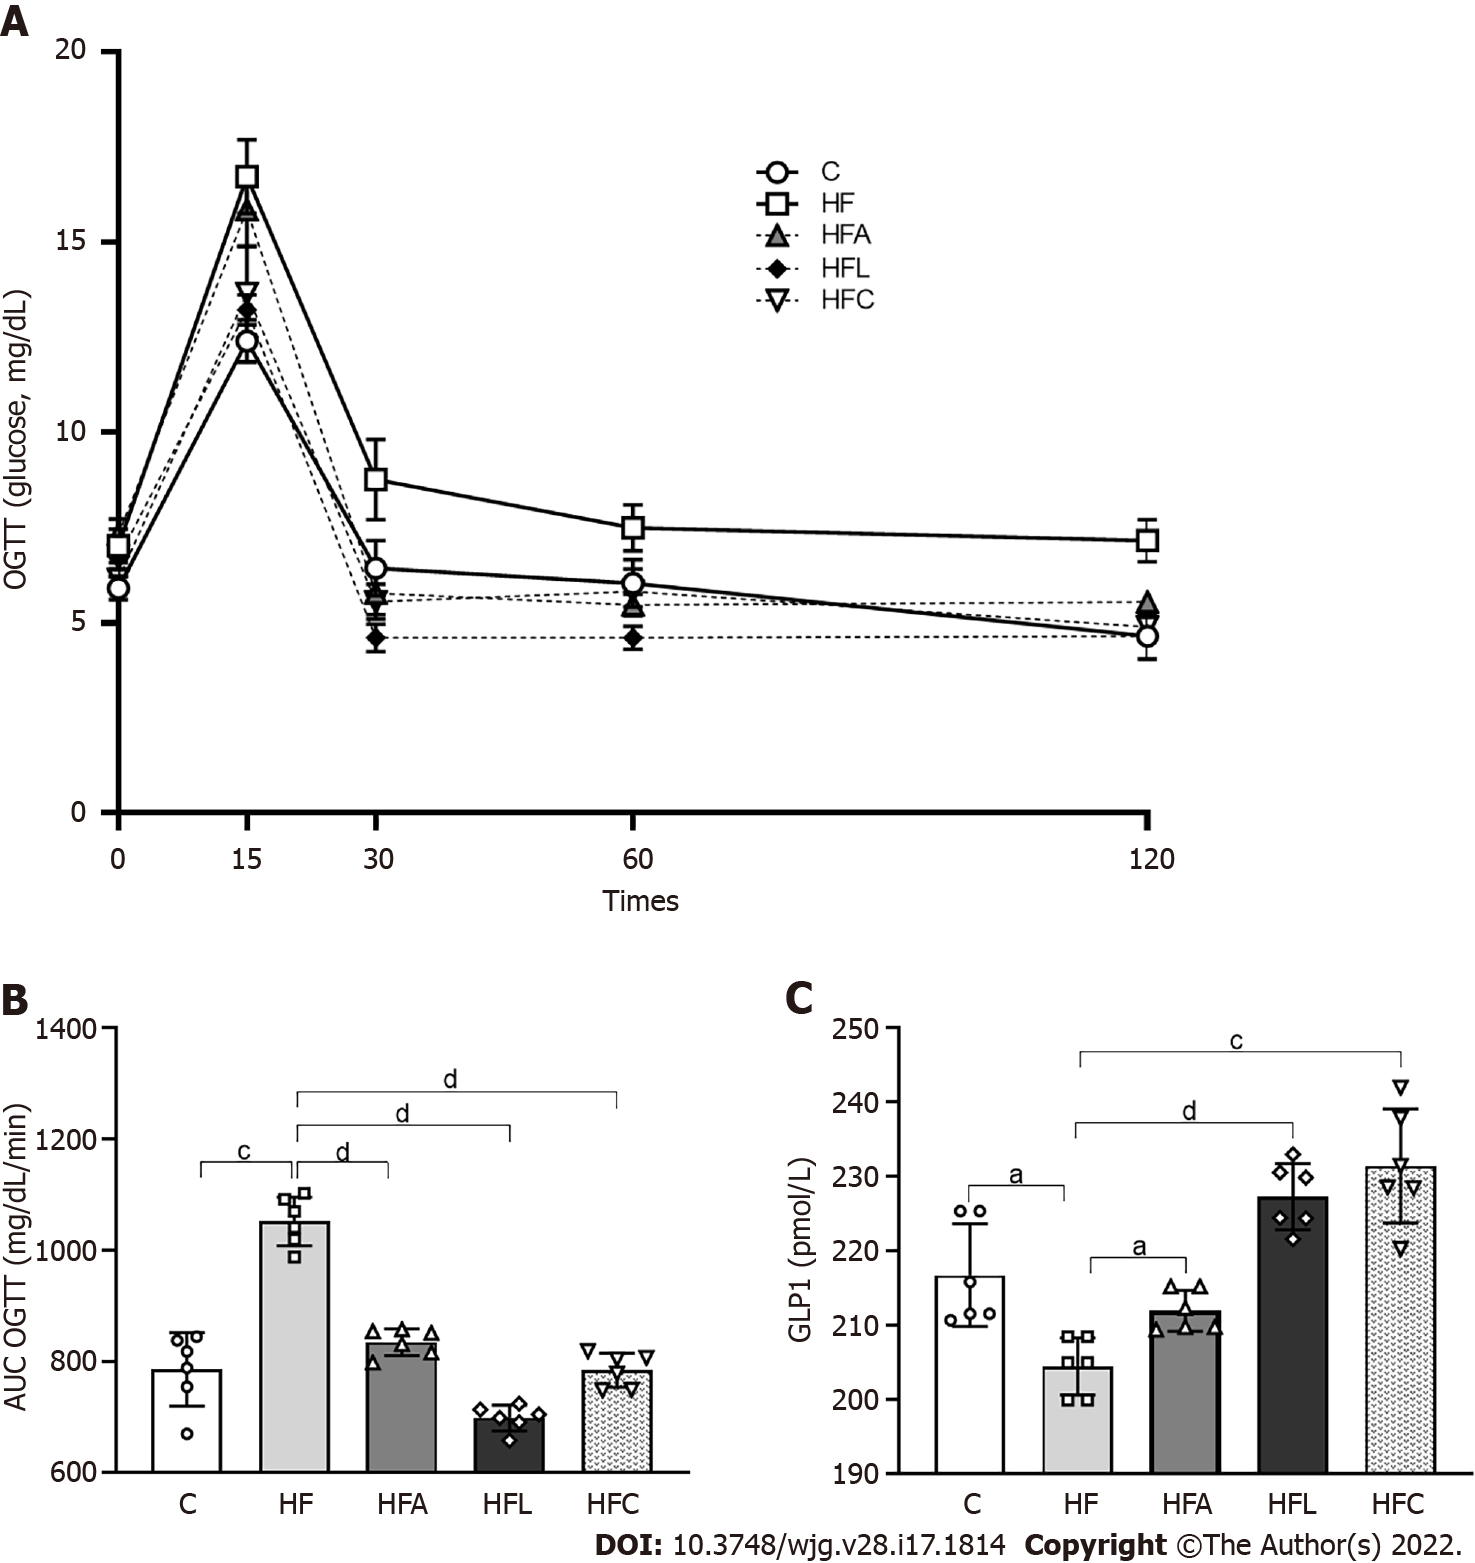
Figure 2 Carbohydrate metabolism.
A: Oral glucose tolerance test; B: Area under the curve for oral glucose tolerance test; C: Plasma glucagon-like peptide 1 concentrations. Brown-Forsythe and Welch one-way ANOVA and Dunnett T3 post hoc test (mean ± SD, n = 6). Significant differences are indicated as follows: aP < 0.05; cP < 0.001; dP < 0.0001. C: Control diet; HF: High-fat diet; HFA: High-fat diet plus PPAR-alpha agonist (WY14643); HFL: High-fat diet plus DPP-4 inhibitor (linagliptin); HFC: High-fat diet plus the combination of WY14643 with linagliptin; AUC: Area under the curve; OGTT: Oral glucose tolerance test; GLP1: Glucagon-like peptide 1.
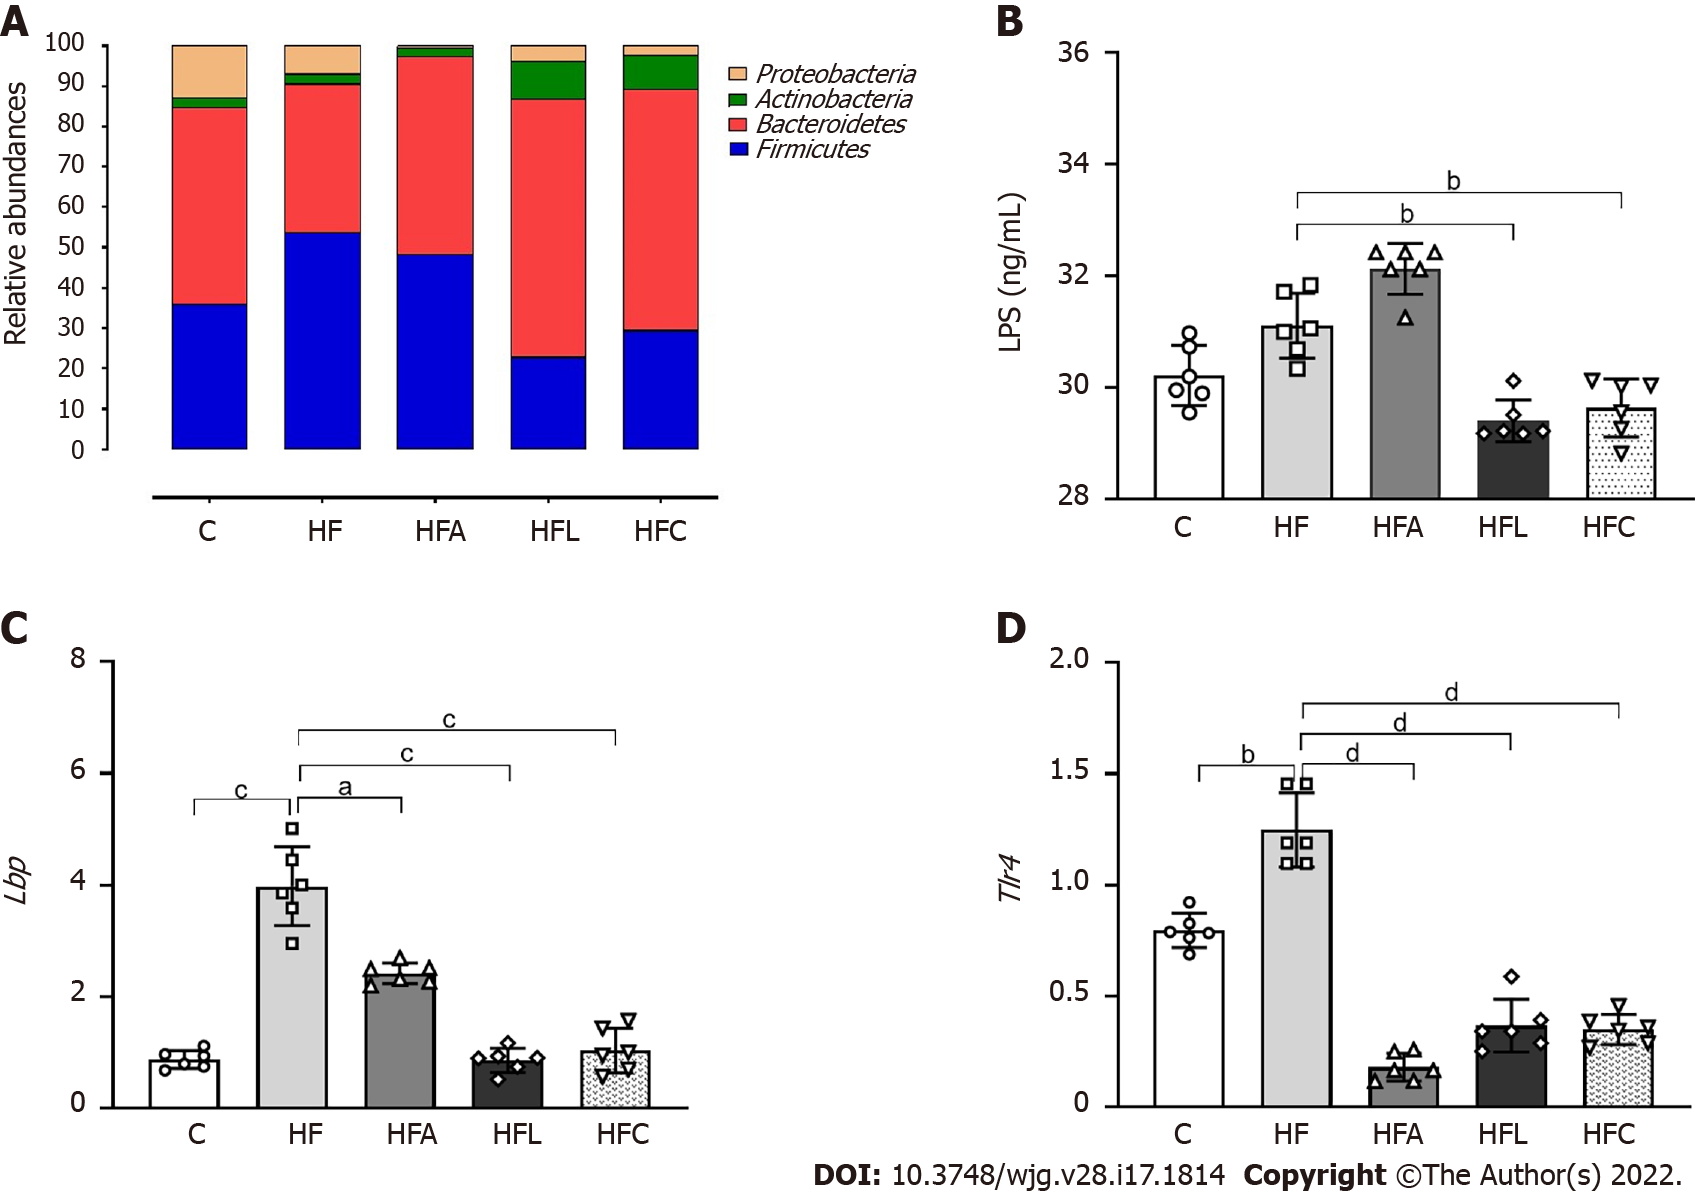
Figure 3 Gut-liver axis.
A: Phylogenetic microbiota composition; B: Plasma lipopolysaccharide concentrations; C: Hepatic Lbp gene expression; D: Hepatic Tlr4 gene expression. Brown-Forsythe and Welch one-way ANOVA and Dunnett T3 post hoc test (mean ± SD, n = 6). Significant differences are indicated as follows: aP < 0.05; bP < 0.01; cP < 0.001; dP < 0.0001. C: Control diet; HF: High-fat diet; HFA: High-fat diet plus PPAR-alpha agonist (WY14643); HFL: High-fat diet plus DPP-4 inhibitor (linagliptin); HFC: High-fat diet plus the combination of WY14643 with linagliptin; LPS: Lipopolysaccharide.
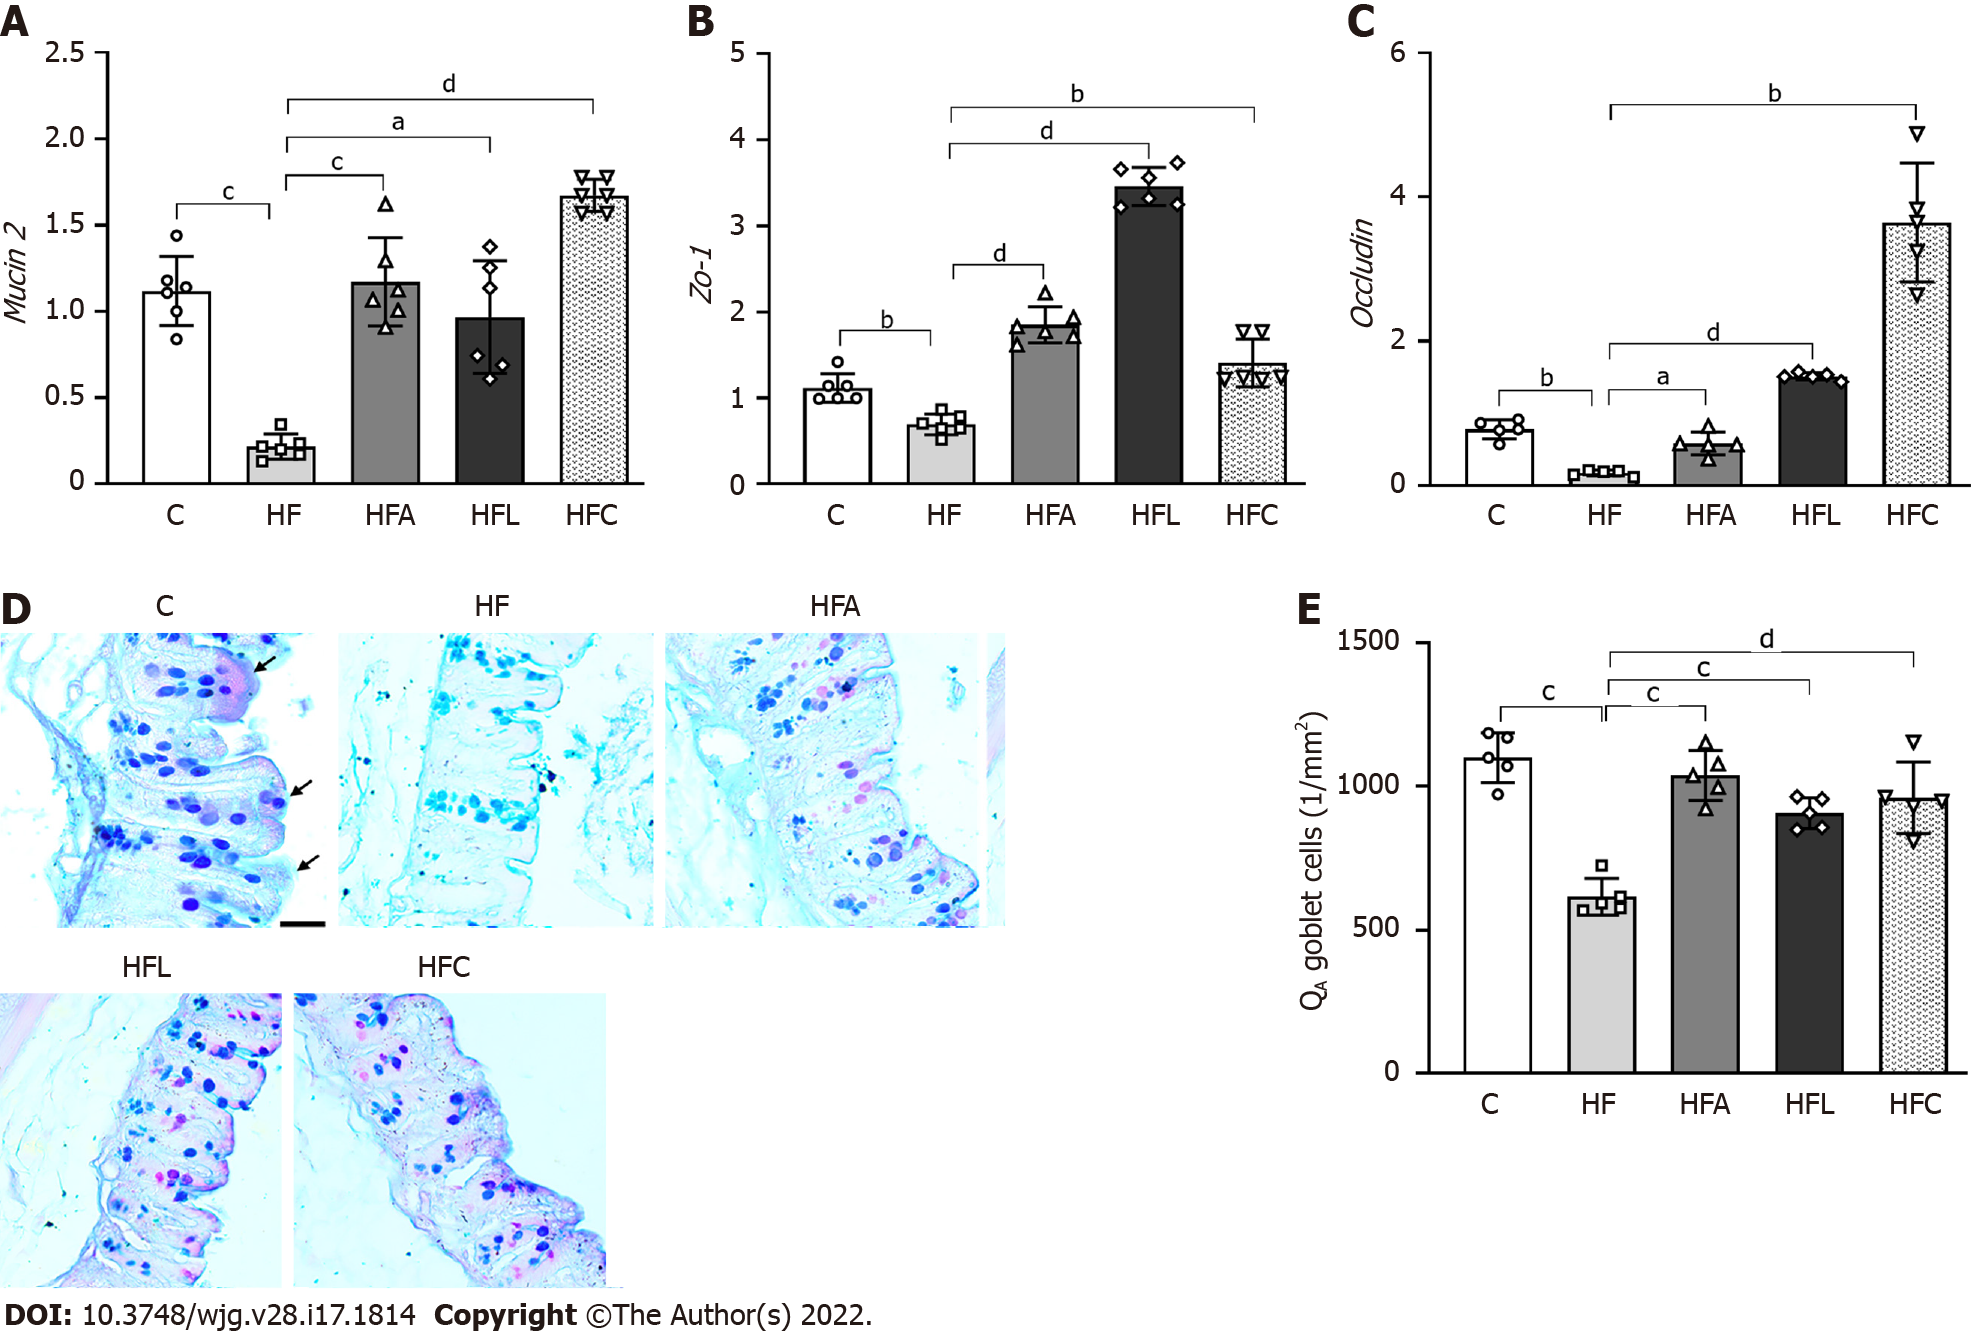
Figure 4 Gut gene expression, histology, and stereology.
A: Gut Mucin2; B: Zo-1; C: Occludin gene expression; D: Large intestine stained with Alcian Blue and Periodic Acid-Schiff (PAS); E: Numerical density of goblet cells per area. Alcian blue and PAS stain glycoproteins produced by goblet cells (scale bar = 40 μm), which were markedly reduced by the high-fat diet and rescued by the treatments according to stereology (QA goblet). Brown-Forsythe and Welch one-way ANOVA and Dunnett T3 post hoc test (mean ± SD, n = 6 for real-time reverse transcriptase–polymerase chain reaction and n = 5 for stereology). Significant differences are indicated as follows: aP < 0.05; bP < 0.01; cP < 0.001; dP < 0.0001. C: Control diet; HF: High-fat diet; HFA: High-fat diet plus PPAR-alpha agonist (WY14643); HFL: High-fat diet plus DPP-4 inhibitor (linagliptin); HFC: High-fat diet plus the combination of WY14643 with linagliptin; PAS: Periodic Acid-Schiff; QA: Numerical density per area.
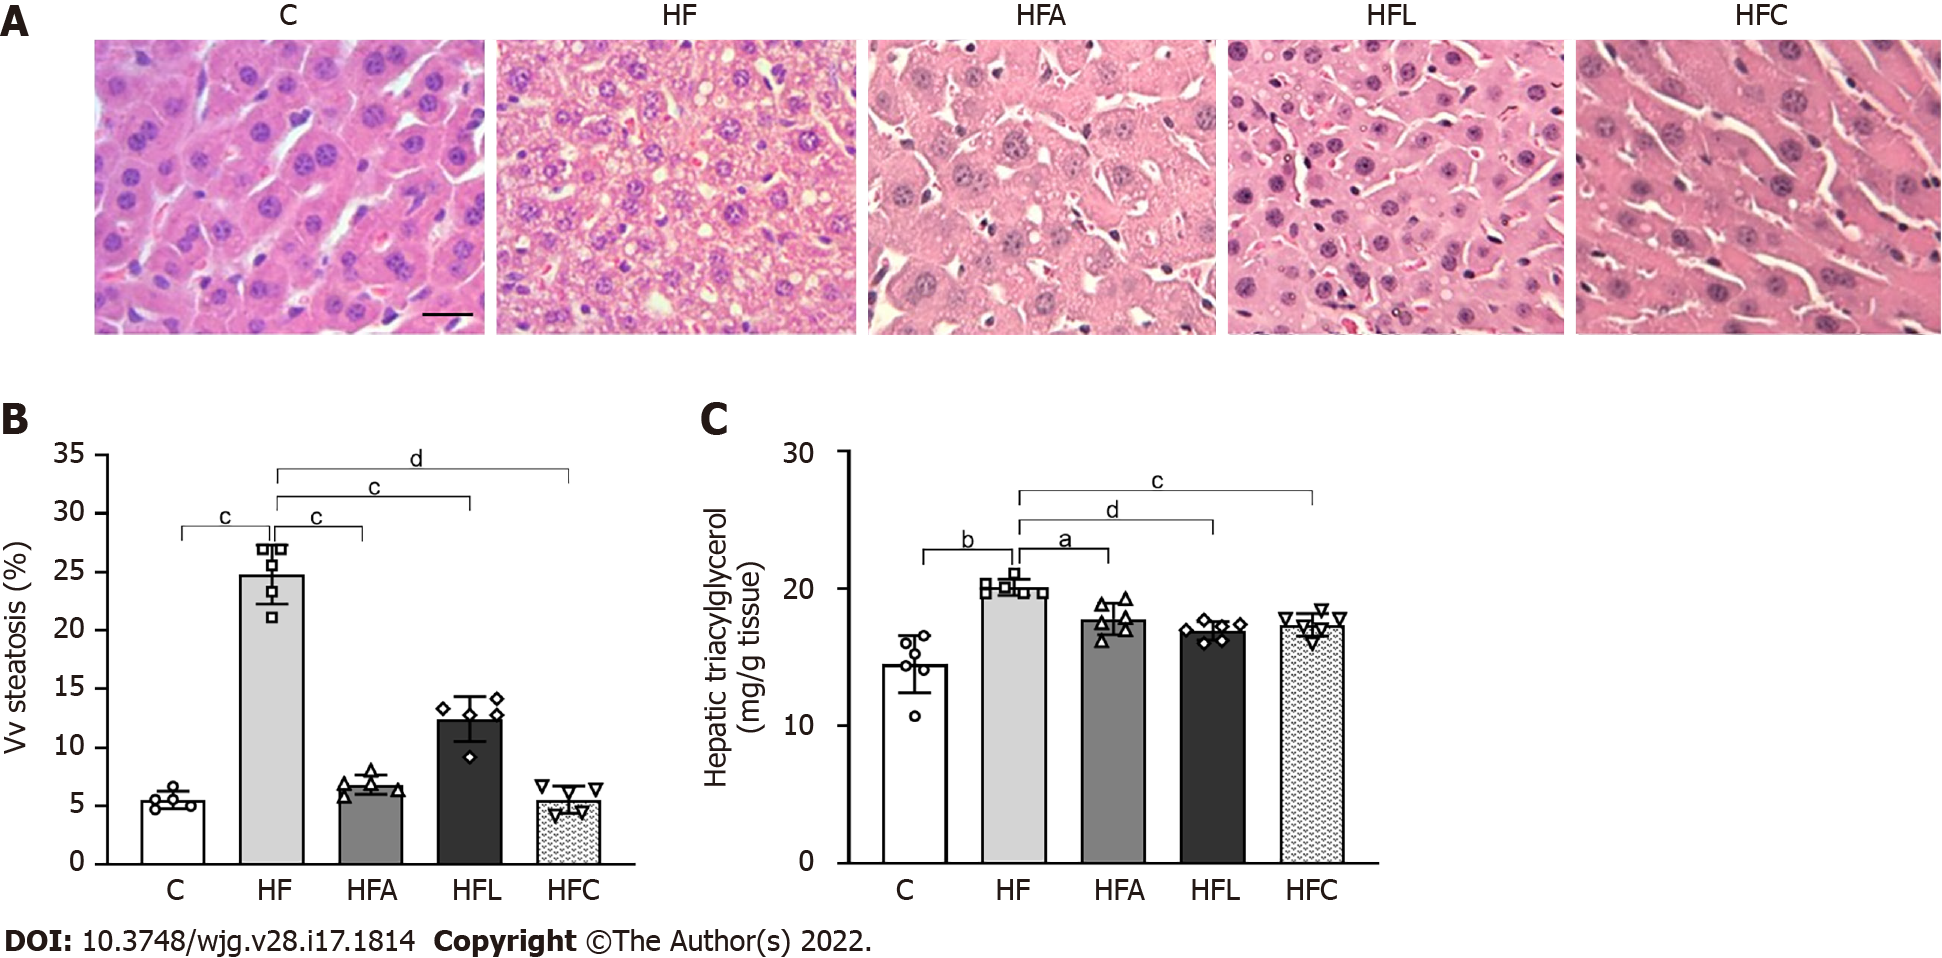
Figure 5 Liver histology, stereology, and biochemistry.
A: Hematoxylin-eosin liver sections; B: Volume density (Vv) (liver steatosis); C: Hepatic triacylglycerol. Liver sections show widespread hepatic steatosis after chronic HF diet intake and expressive reduction in all treated groups (scale bar = 50 μm. Both stereology (Vv steatosis) and biochemical analyses (hepatic triacylglycerol) confirm these observations. Brown-Forsythe and Welch one-way ANOVA and Dunnett T3 post hoc test (mean ± SD, n = 6 for biochemistry and n = 5 for stereology). Significant differences are indicated as follows: aP < 0.05; bP < 0.01; cP < 0.001; dP < 0.0001. C: Control diet; HF: High-fat diet; HFA: High-fat diet plus PPAR-alpha agonist (WY14643); HFL: High-fat diet plus DPP-4 inhibitor (linagliptin); HFC: High-fat diet plus the combination of WY14643 with linagliptin; Vv: Volume density.
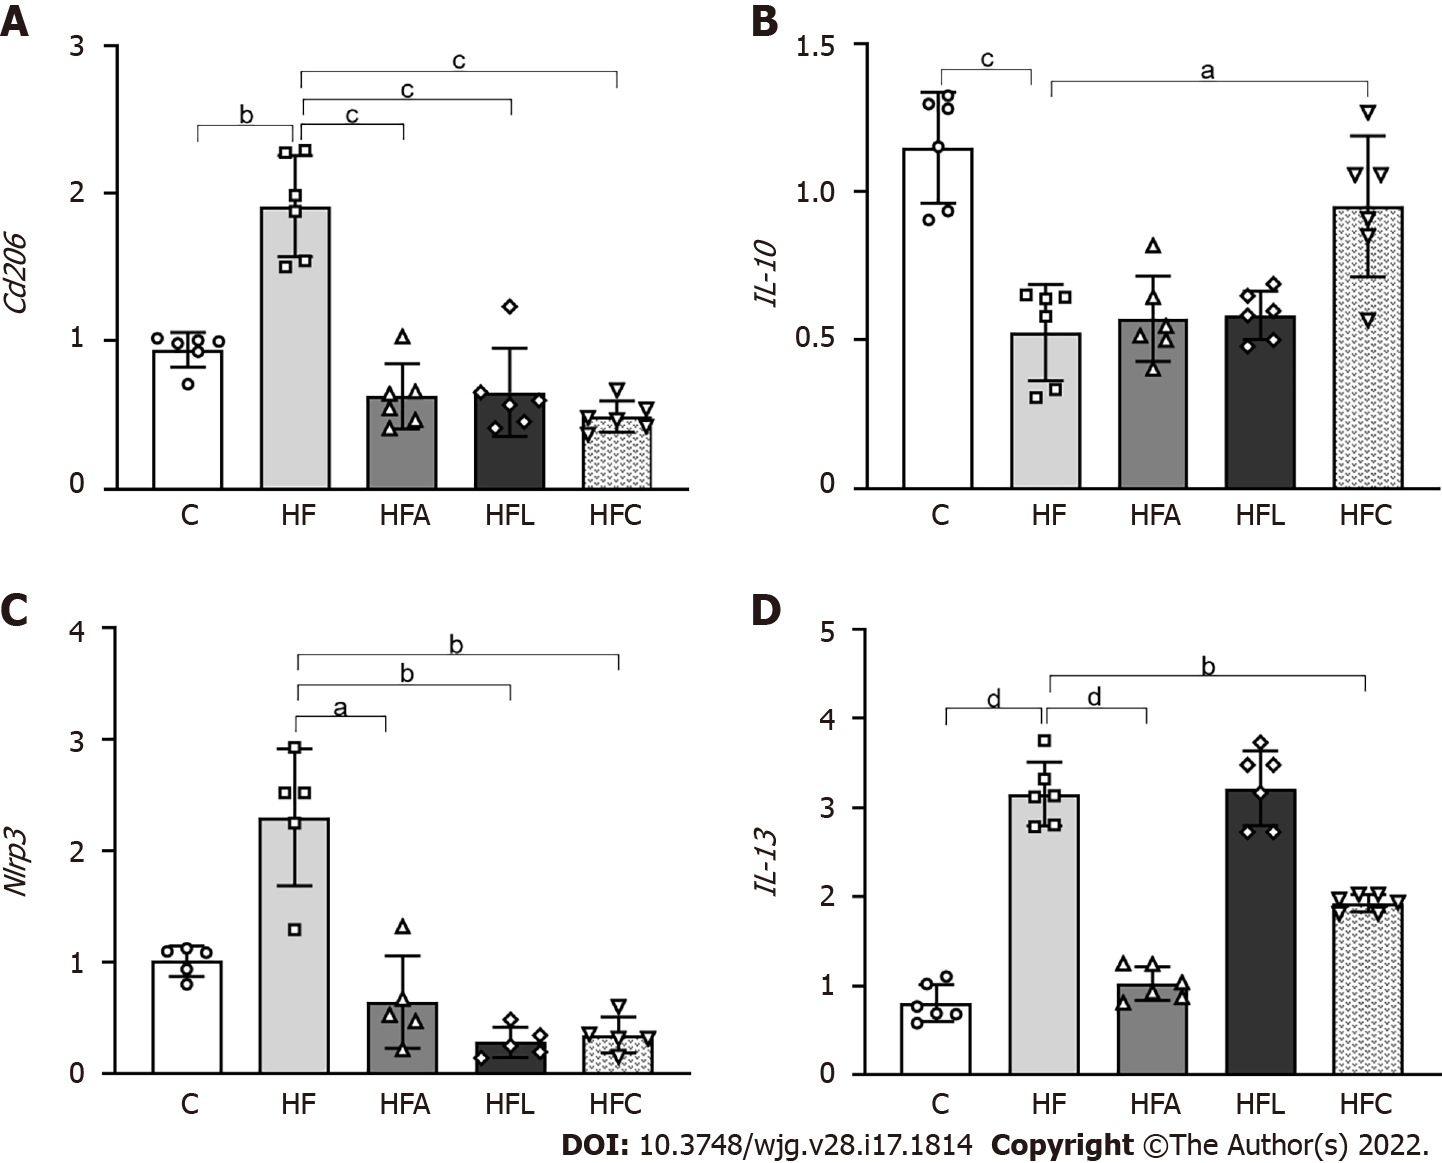
Figure 6 Liver gene expression.
A: Cd206; B: IL-10; C: Nlrp3; D: IL-13. Brown-Forsythe and Welch one-way ANOVA and Dunnett T3 post hoc test (mean ± SD, n = 5 or 6). Significant differences are indicated as follows: aP < 0.05; bP < 0.01; cP < 0.001; dP < 0.0001. C: Control diet; HF: High-fat diet; HFA: High-fat diet plus PPAR-alpha agonist (WY14643); HFL: High-fat diet plus DPP-4 inhibitor (linagliptin); HFC: High-fat diet plus the combination of WY14643 with linagliptin.
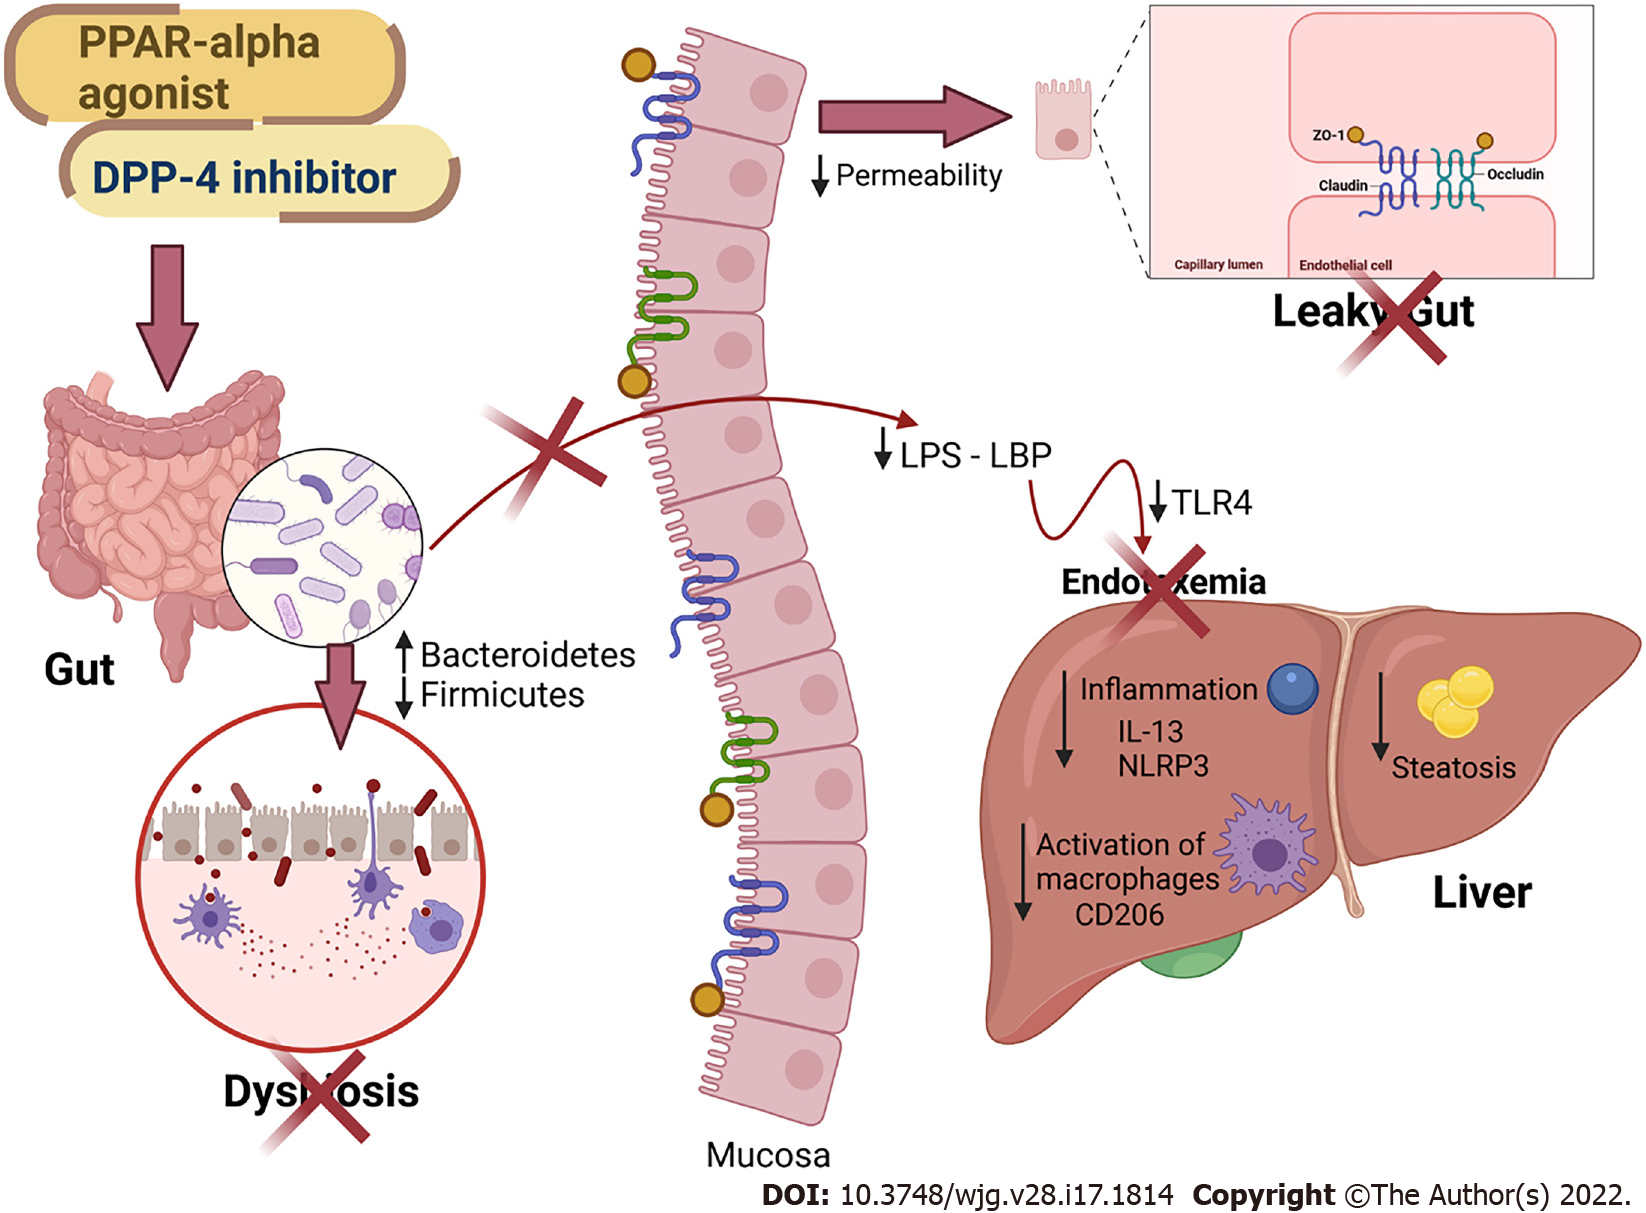
Figure 7 Main findings of the study.
All treatments alleviated fatty liver by countering gut dysbiosis and rescuing the intestinal barrier integrity. The reduced lipopolysaccharide (LPS) influx to the liver caused reduced inflammasome and CD206 macrophage activation. Peroxisome proliferator-activated receptor-alpha activation and DPP-4 inhibition can be regarded as viable tools to treat leaky gut and prevent LPS-driven hepatic steatosis. PPAR: Peroxisome proliferator-activated receptor; DPP-4: Dipeptidyl peptidase-4; LPS: Lipopolysaccharide; LBP: Lipopolysaccharide-binding protein; TLR4: Toll-Like receptor 4; ZO-1: Zonula occludens 1; NLRP3: NLR family pyrin domain containing 3; CD206: Cluster of differentiation 206; IL: Interleukin. Created with Biorender: www.biorender.com.
- Citation: Silva-Veiga FM, Miranda CS, Vasques-Monteiro IML, Souza-Tavares H, Martins FF, Daleprane JB, Souza-Mello V. Peroxisome proliferator-activated receptor-alpha activation and dipeptidyl peptidase-4 inhibition target dysbiosis to treat fatty liver in obese mice . World J Gastroenterol 2022; 28(17): 1814-1829
- URL: https://www.wjgnet.com/1007-9327/full/v28/i17/1814.htm
- DOI: https://dx.doi.org/10.3748/wjg.v28.i17.1814


