Copyright
©The Author(s) 2022.
World J Gastroenterol. May 7, 2022; 28(17): 1798-1813
Published online May 7, 2022. doi: 10.3748/wjg.v28.i17.1798
Published online May 7, 2022. doi: 10.3748/wjg.v28.i17.1798
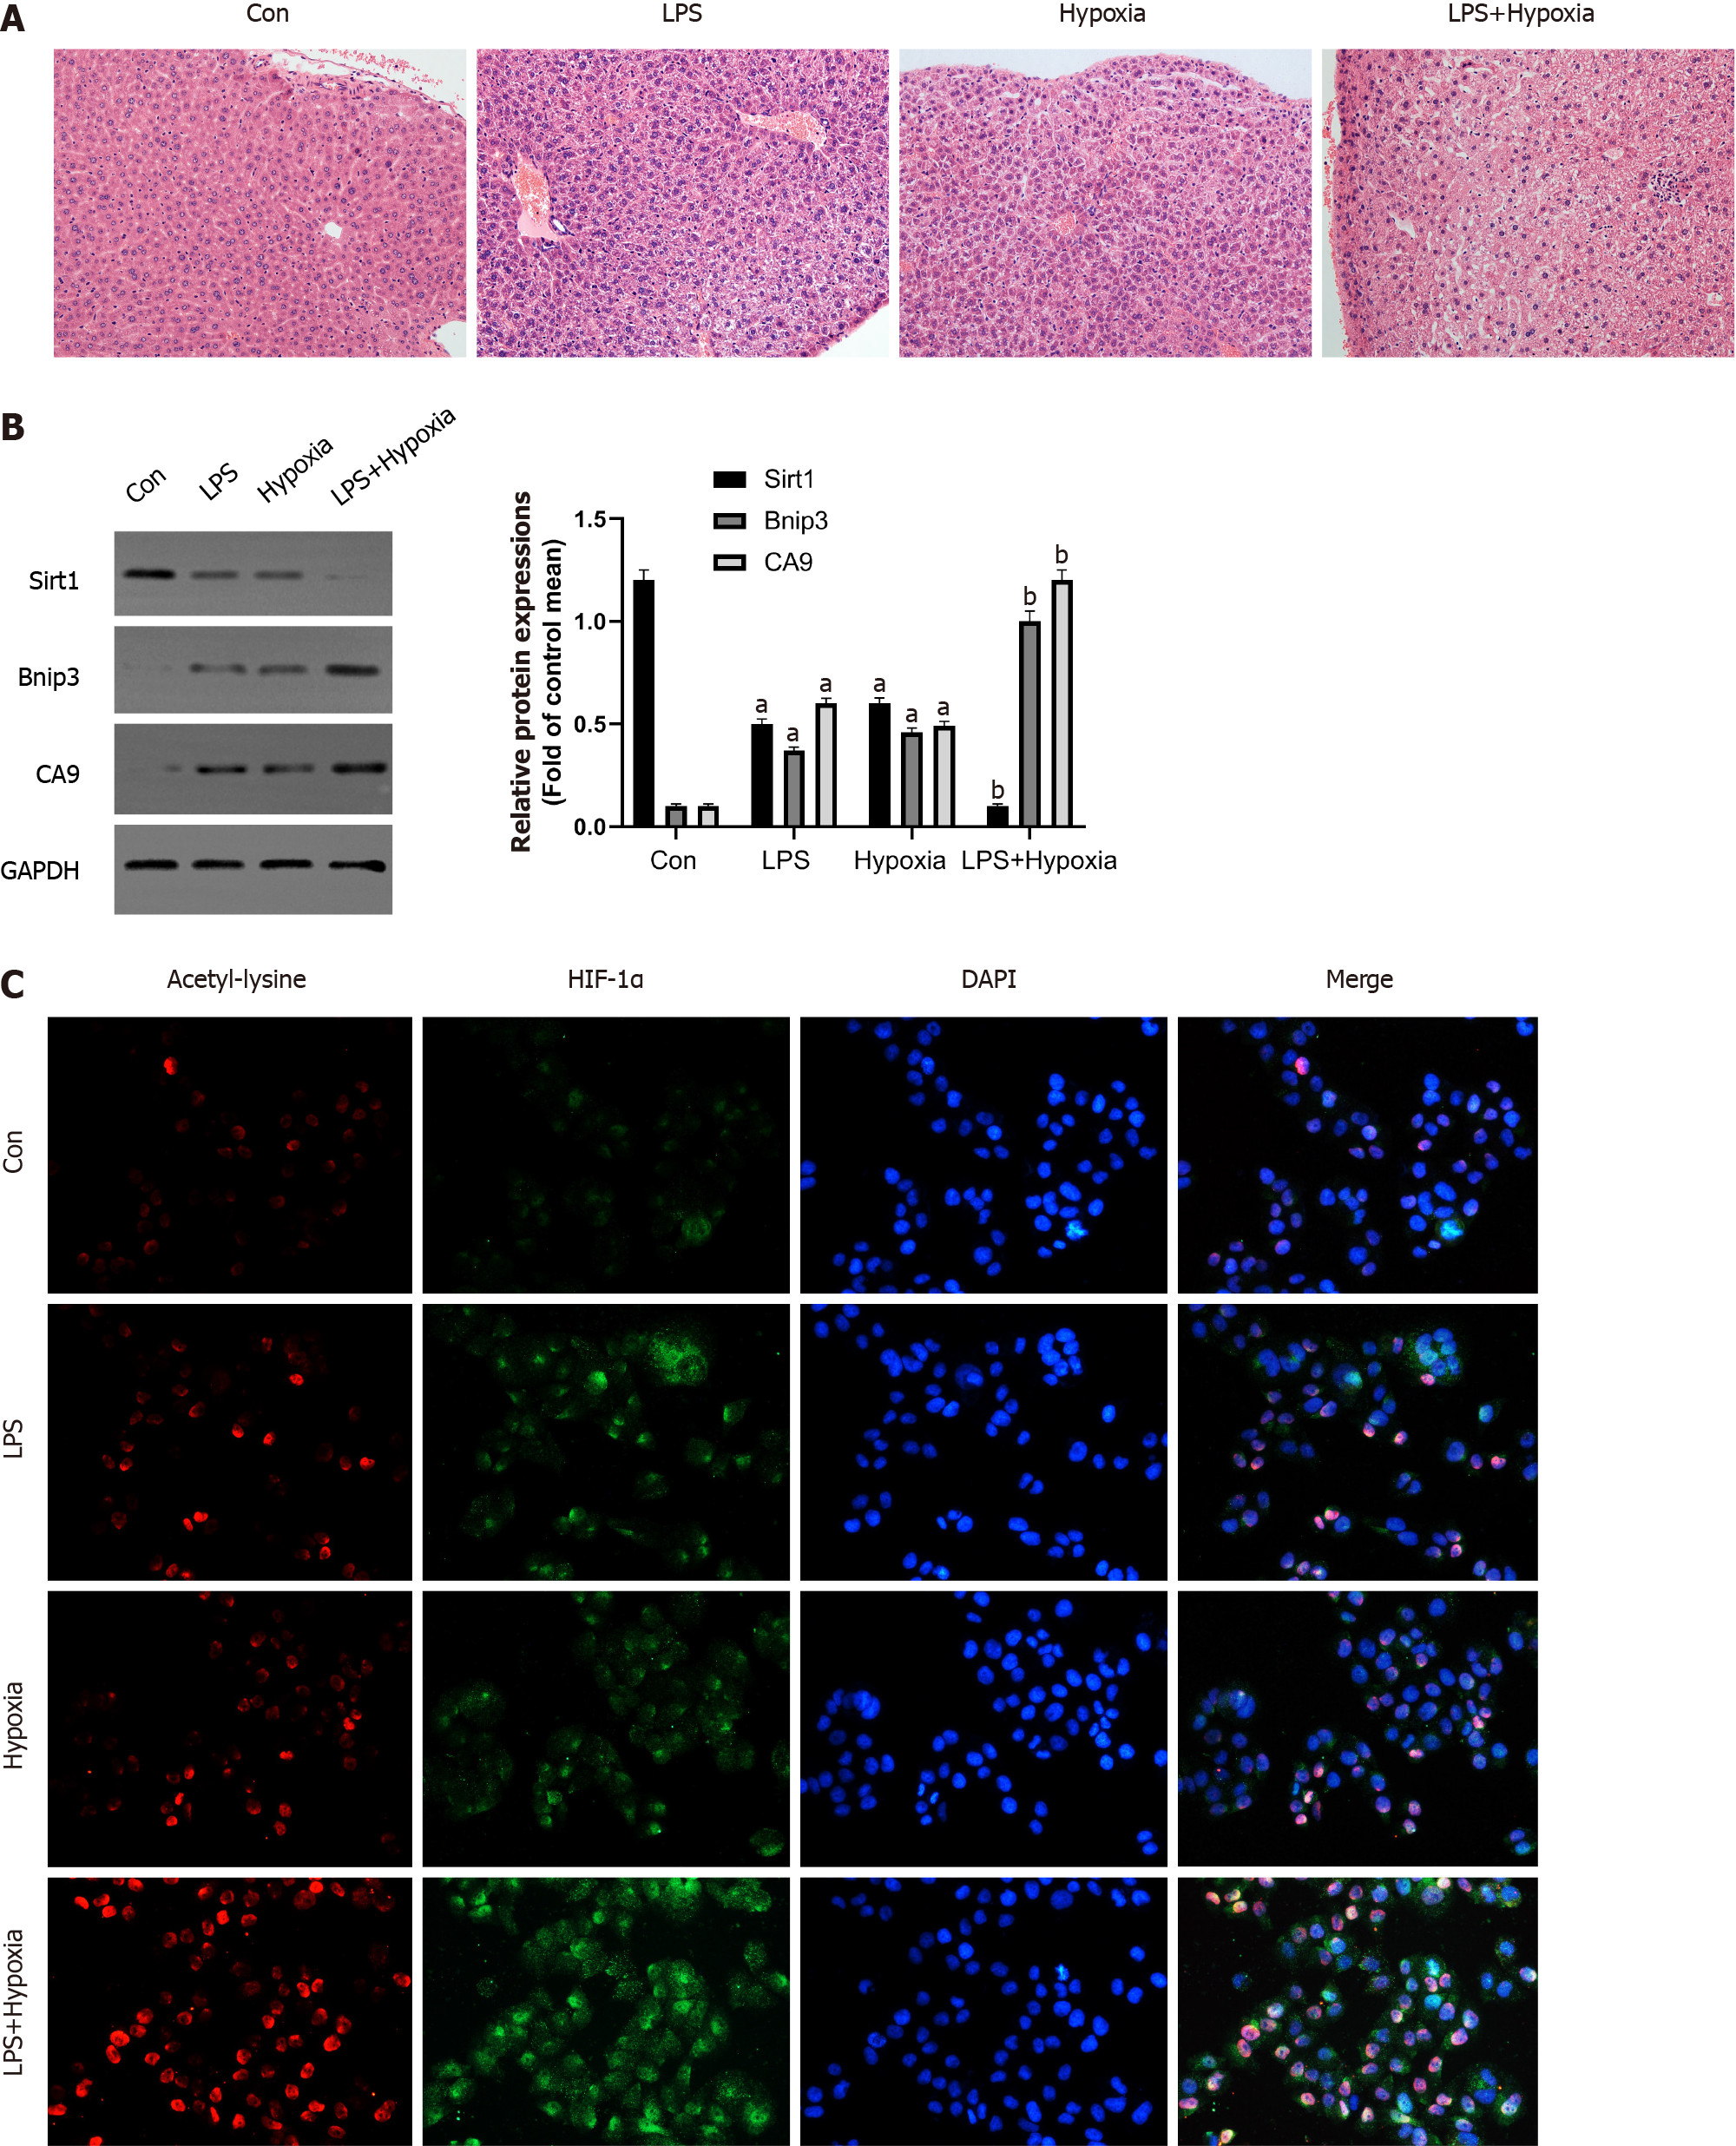
Figure 1 Hypoxia aggravated acute liver failure and increased the expression of hypoxia inducible factor-1α and its acetylation.
A: The representative images of hematoxylin and eosin staining of liver in each group; B: Western blotting was performed to measure the levels of Sirtuin1 (Sirt1), Bcl-2 adenovirus E1B-interacting protein 3 (Bnip3) and carbonic anhydrase 9 (CA9) in liver tissues; C: The representative images of immunofluorescence staining for Acetyl-lysine and hypoxia inducible factor (HIF)-1α. Data shown are means ± standard deviation of three separate experiments. aP < 0.05 vs Control group; bP < 0.05 vs Lipopolysaccharide (LPS)-treated group; one-way analysis of variance combined with Bonferroni's post hoc test; the error bars indicate the standard deviations. GAPDH: Glyceraldehyde-3-phosphate dehydrogenase.
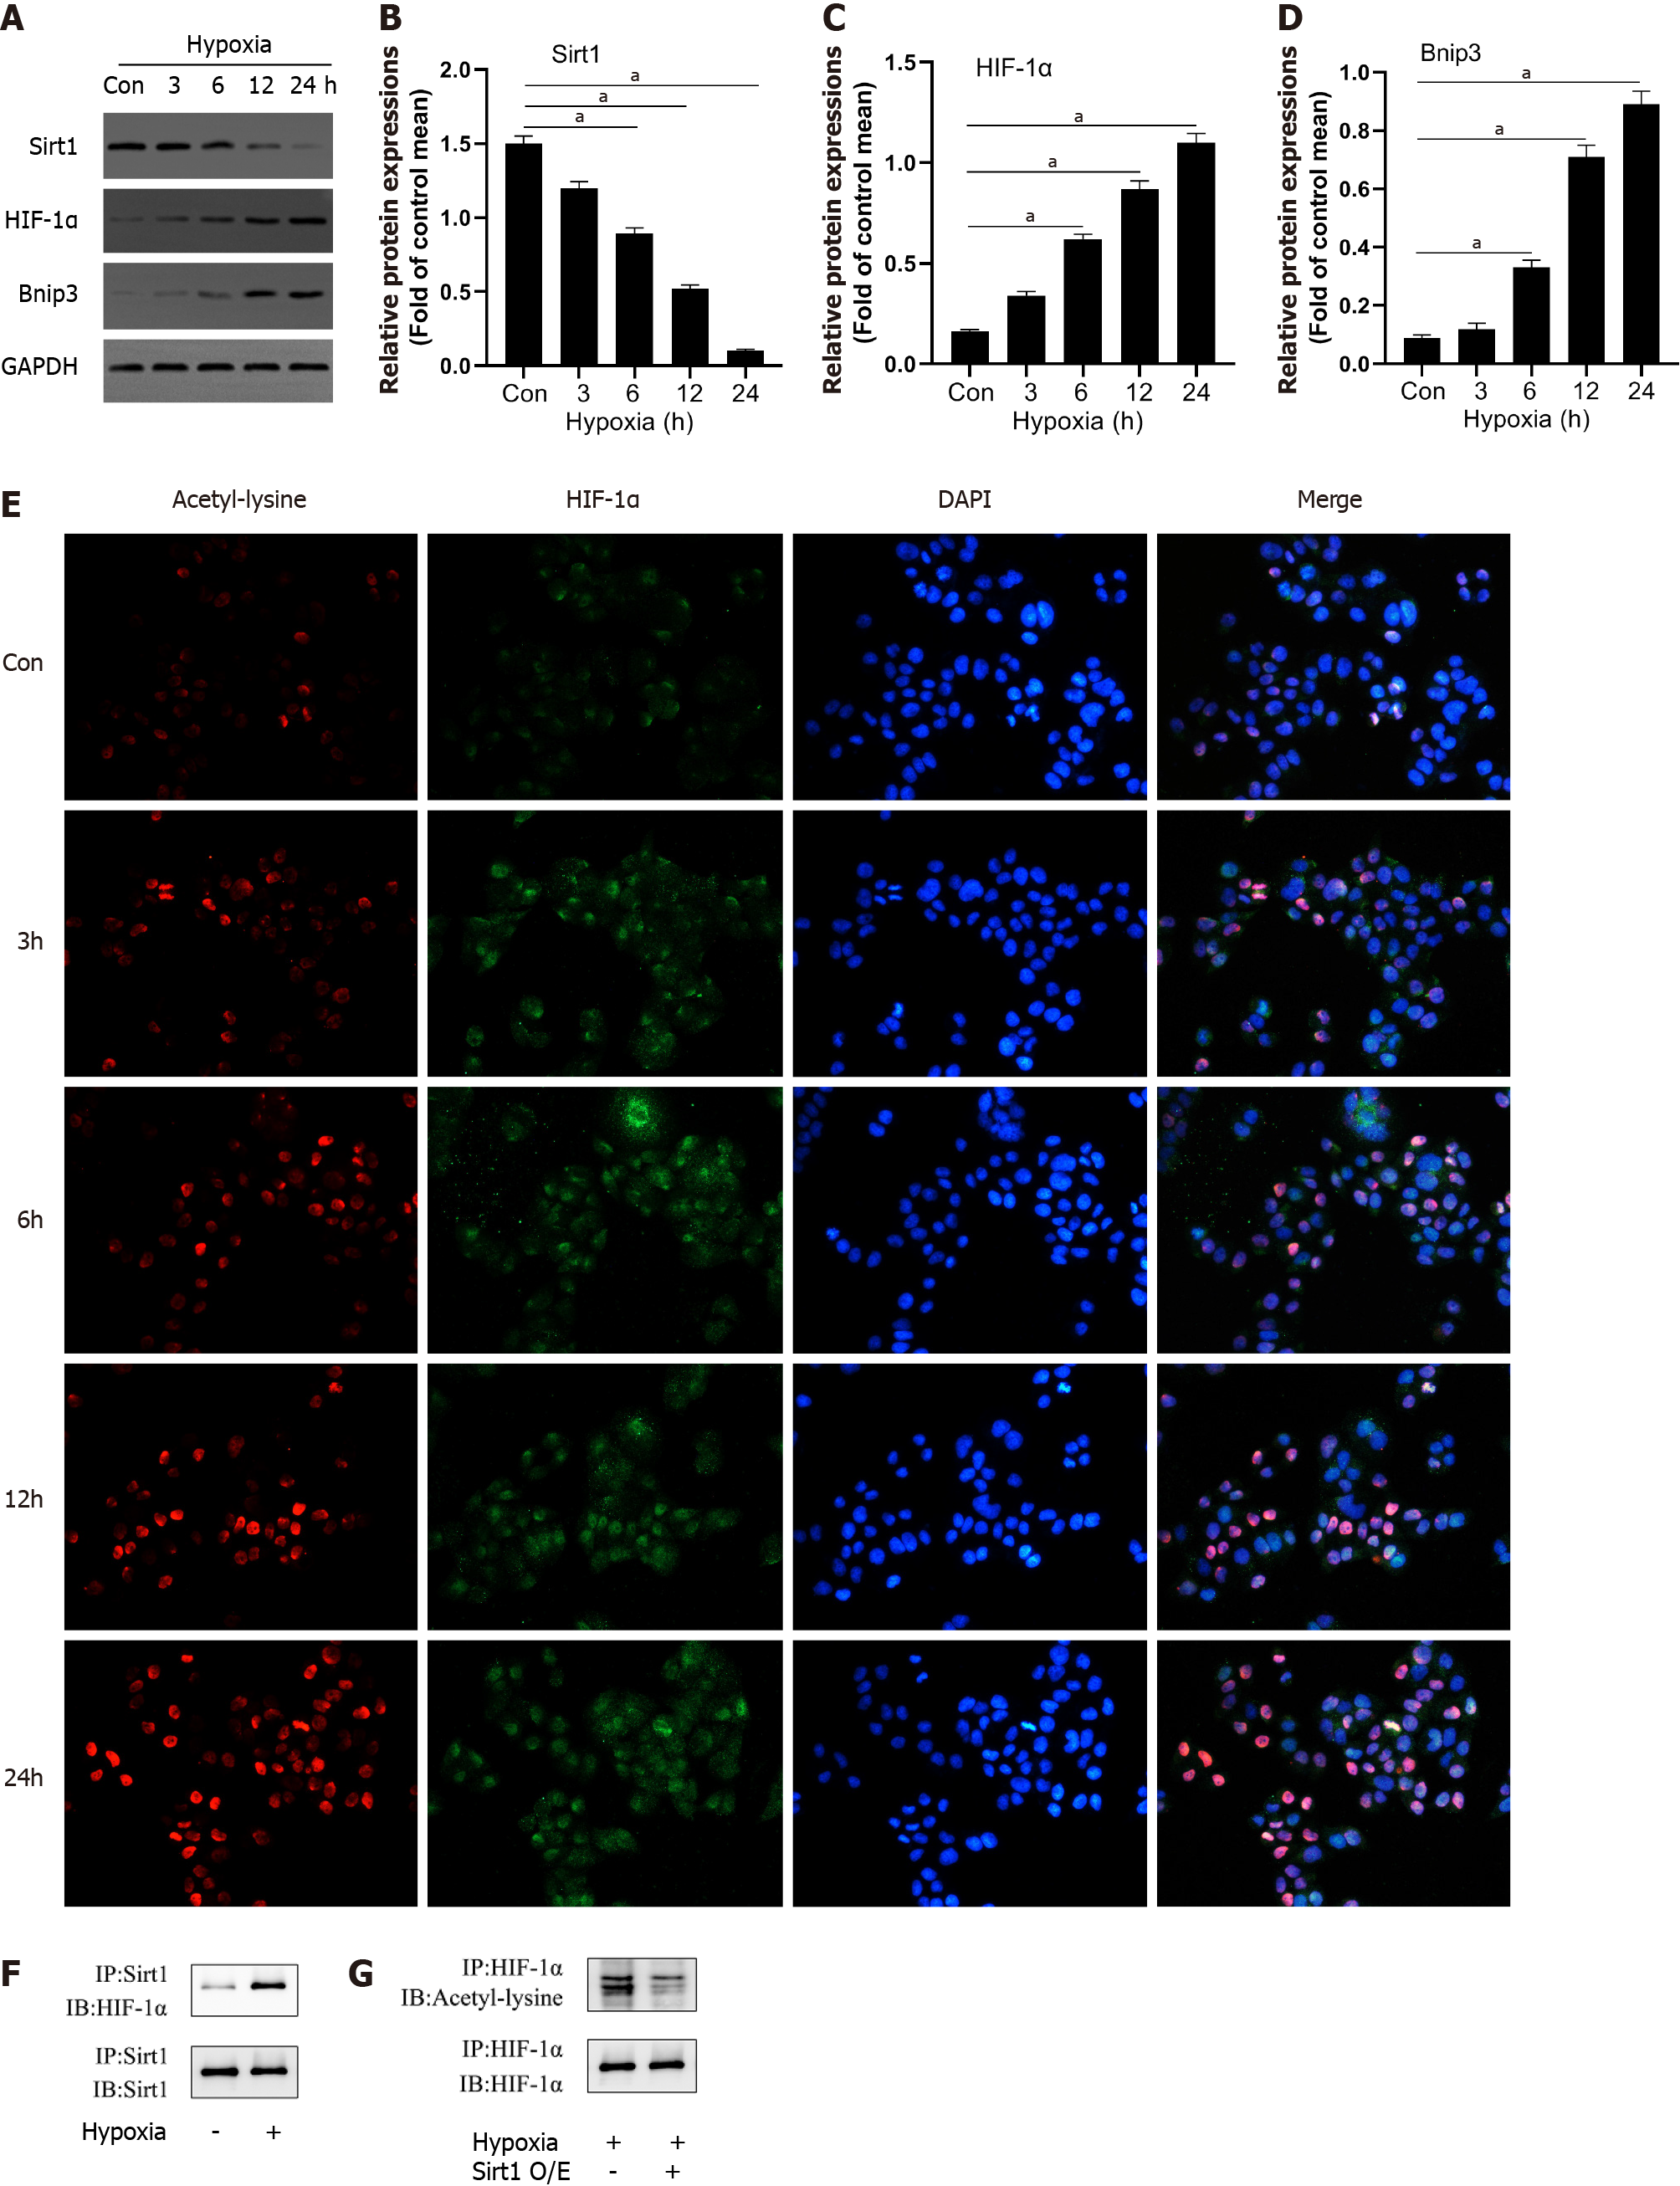
Figure 2 Hypoxia decreased Sirtuin1 expression leading to the acetylation and activation of hypoxia inducible factor-1α.
A-D: Western blotting was performed to measure the levels of Sirtuin1 (Sirt1), Bcl-2 adenovirus E1B-interacting protein 3 (Bnip3), and hypoxia inducible factor (HIF)-1α in L02 cells; E: The representative images of immunofluorescence staining for Acetyl-lysine and HIF-1α; F and G: Equal amounts of protein were subjected to immunoprecipitation with Sirt1 antibody or HIF-1α antibody followed by immunoblotting with antibody against Sirt1, HIF-1α, or acetyl-lysine and effect of Sirt1 overexpression (O/E) was shown. Data shown are means ± standard deviations (SDs) of three separate experiments. aP < 0.05 vs Control group; one-way analysis of variance combined with Bonferroni's post hoc test; the error bars indicate the SDs.
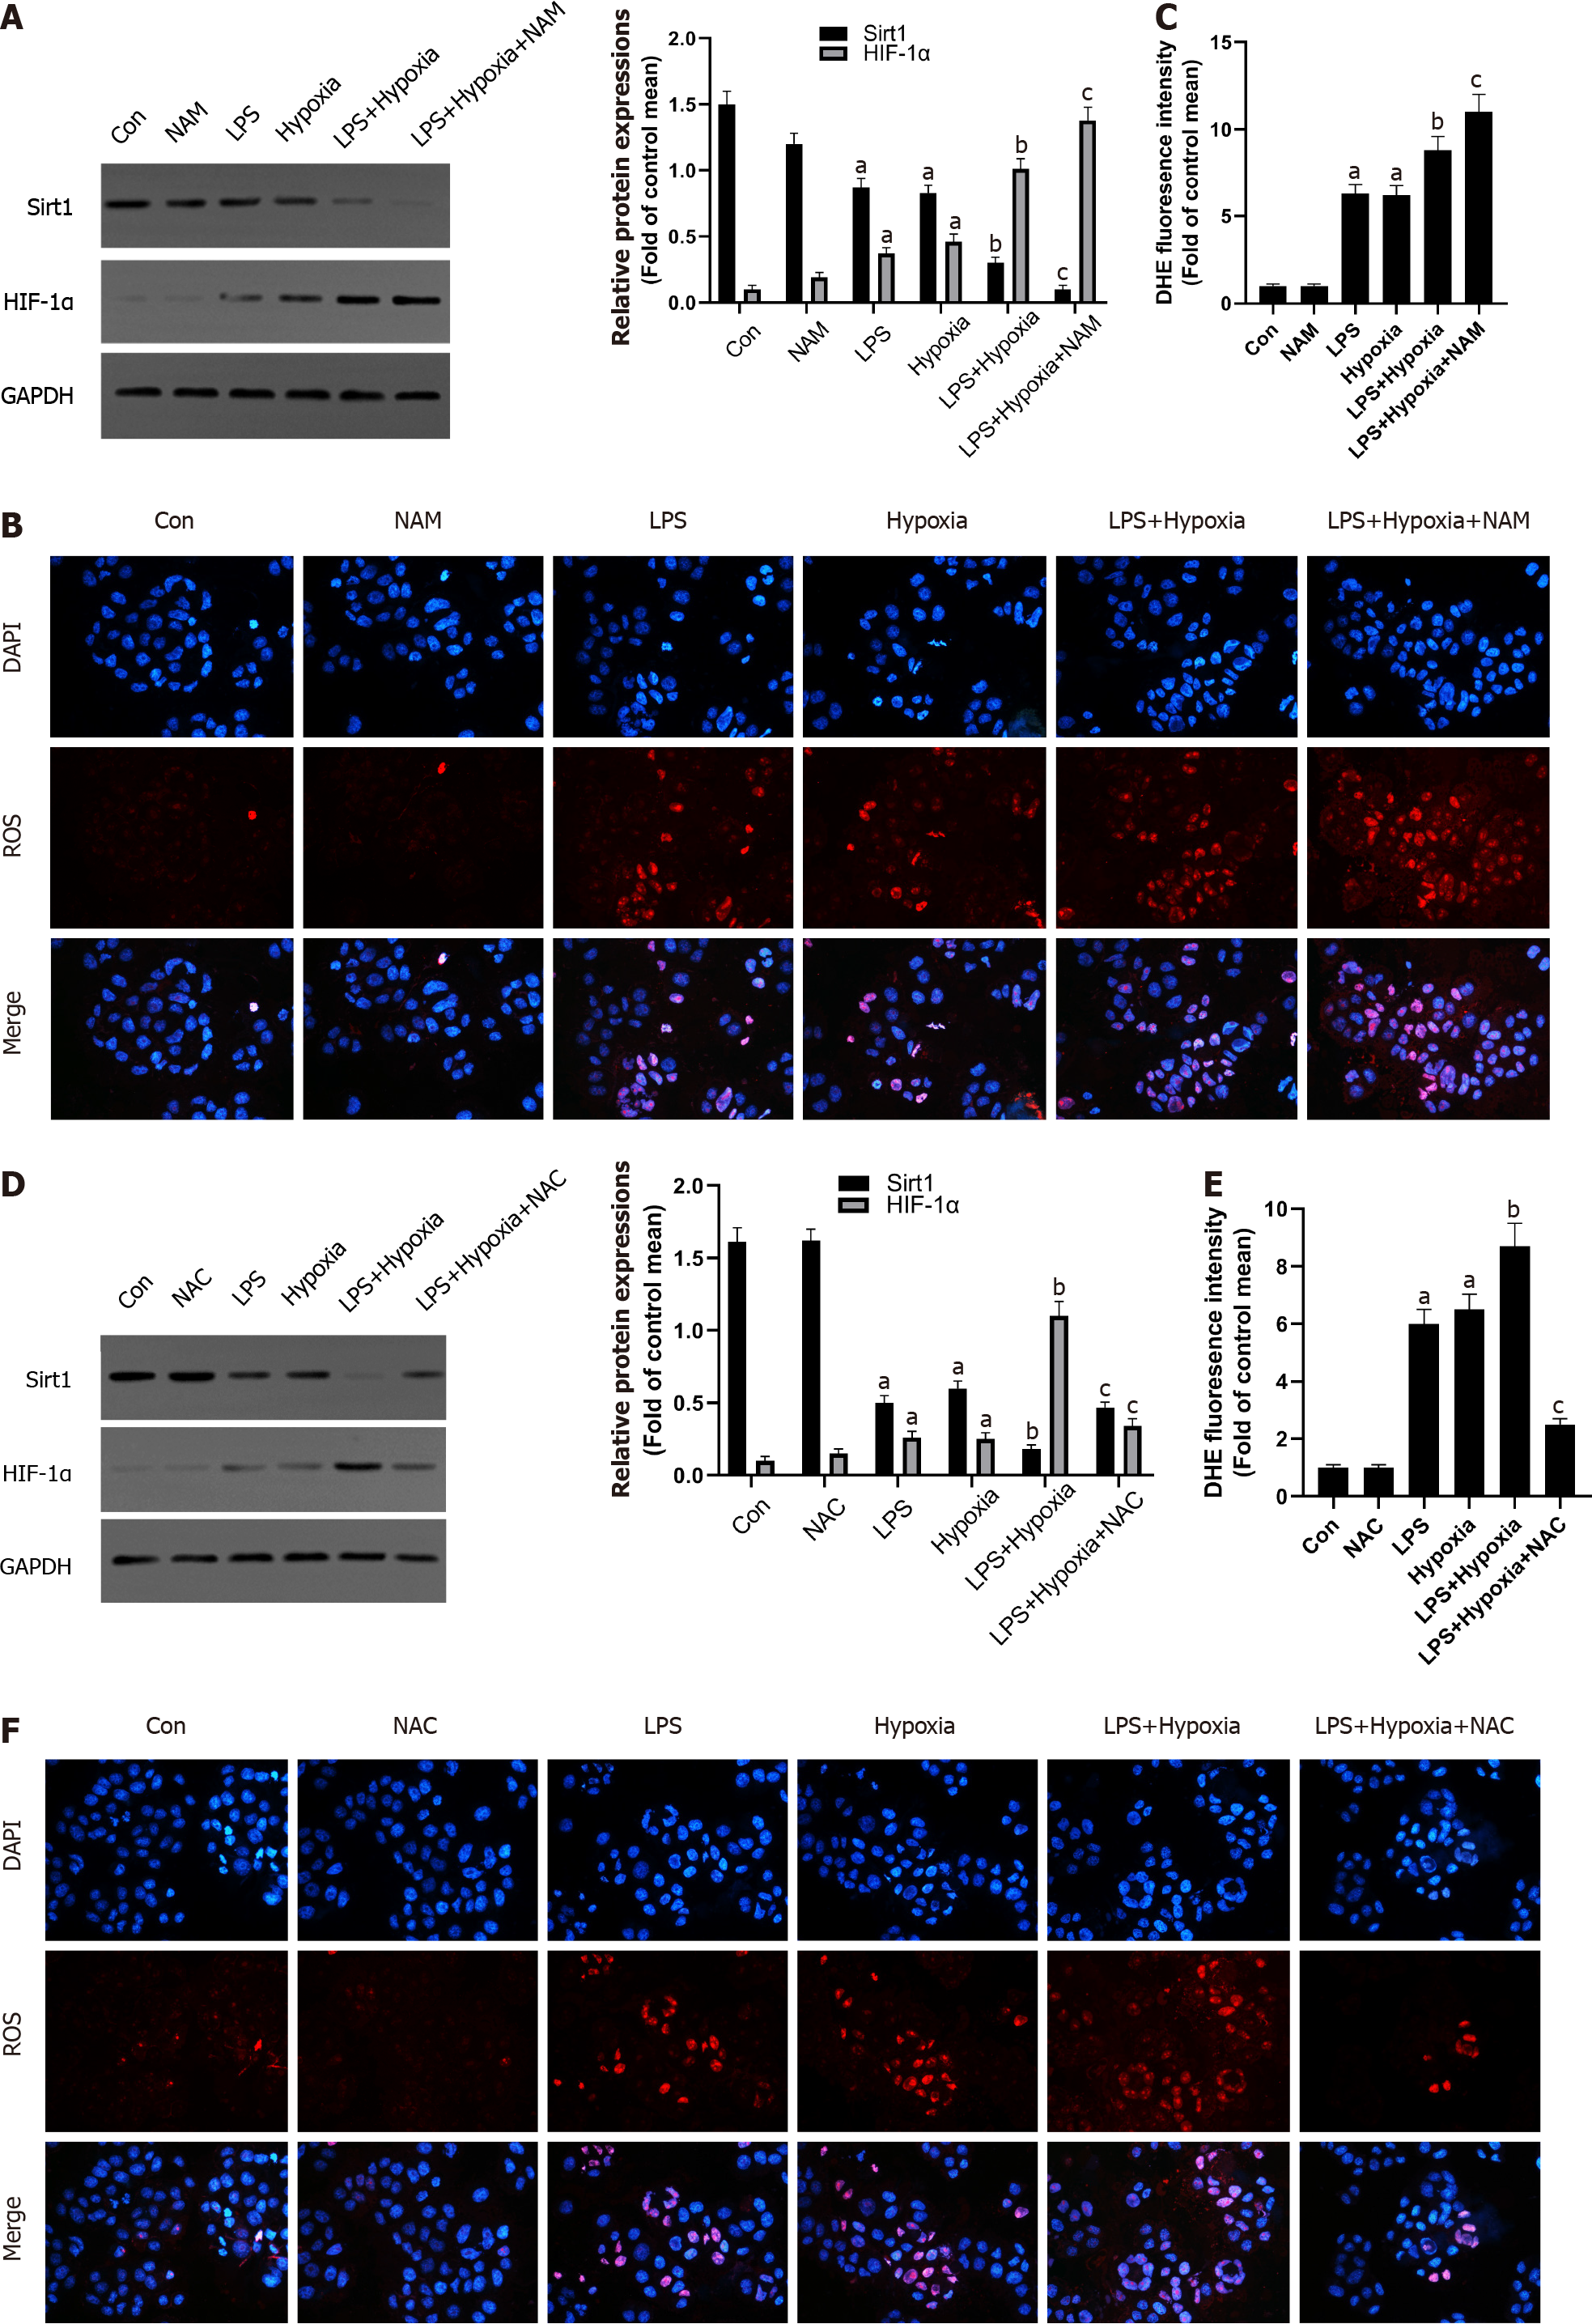
Figure 3 The inhibition of Sirtuin1 induced activation of hypoxia inducible factor-1α and subsequently increased hypoxia-induced reactive oxygen species production.
A: Western blotting was performed to measure the levels of Sirtuin1 (Sirt1) and hypoxia inducible factor (HIF)-1α in L02 cells; B: Reactive oxygen species (ROS) productions were detected by dihydroethidium (DHE) staining. Representative images of the DHE staining in different groups; C: ROS productions were evaluated by quantification of mean fluorescence intensity in DHE staining; D: Western blotting was performed to measure the levels of Sirt1 and HIF-1α in L02 cells; E and F: ROS productions were detected by DHE staining. Data shown are means ± standard deviations (SDs) of three separate experiments. aP < 0.05 vs Control group; bP < 0.05 vs Lipopolysaccharide (LPS)-treated group; cP < 0.05 vs LPS + Hypoxia-treated group; one-way analysis of variance with Bonferroni's post hoc test; the error bars indicate the SDs.
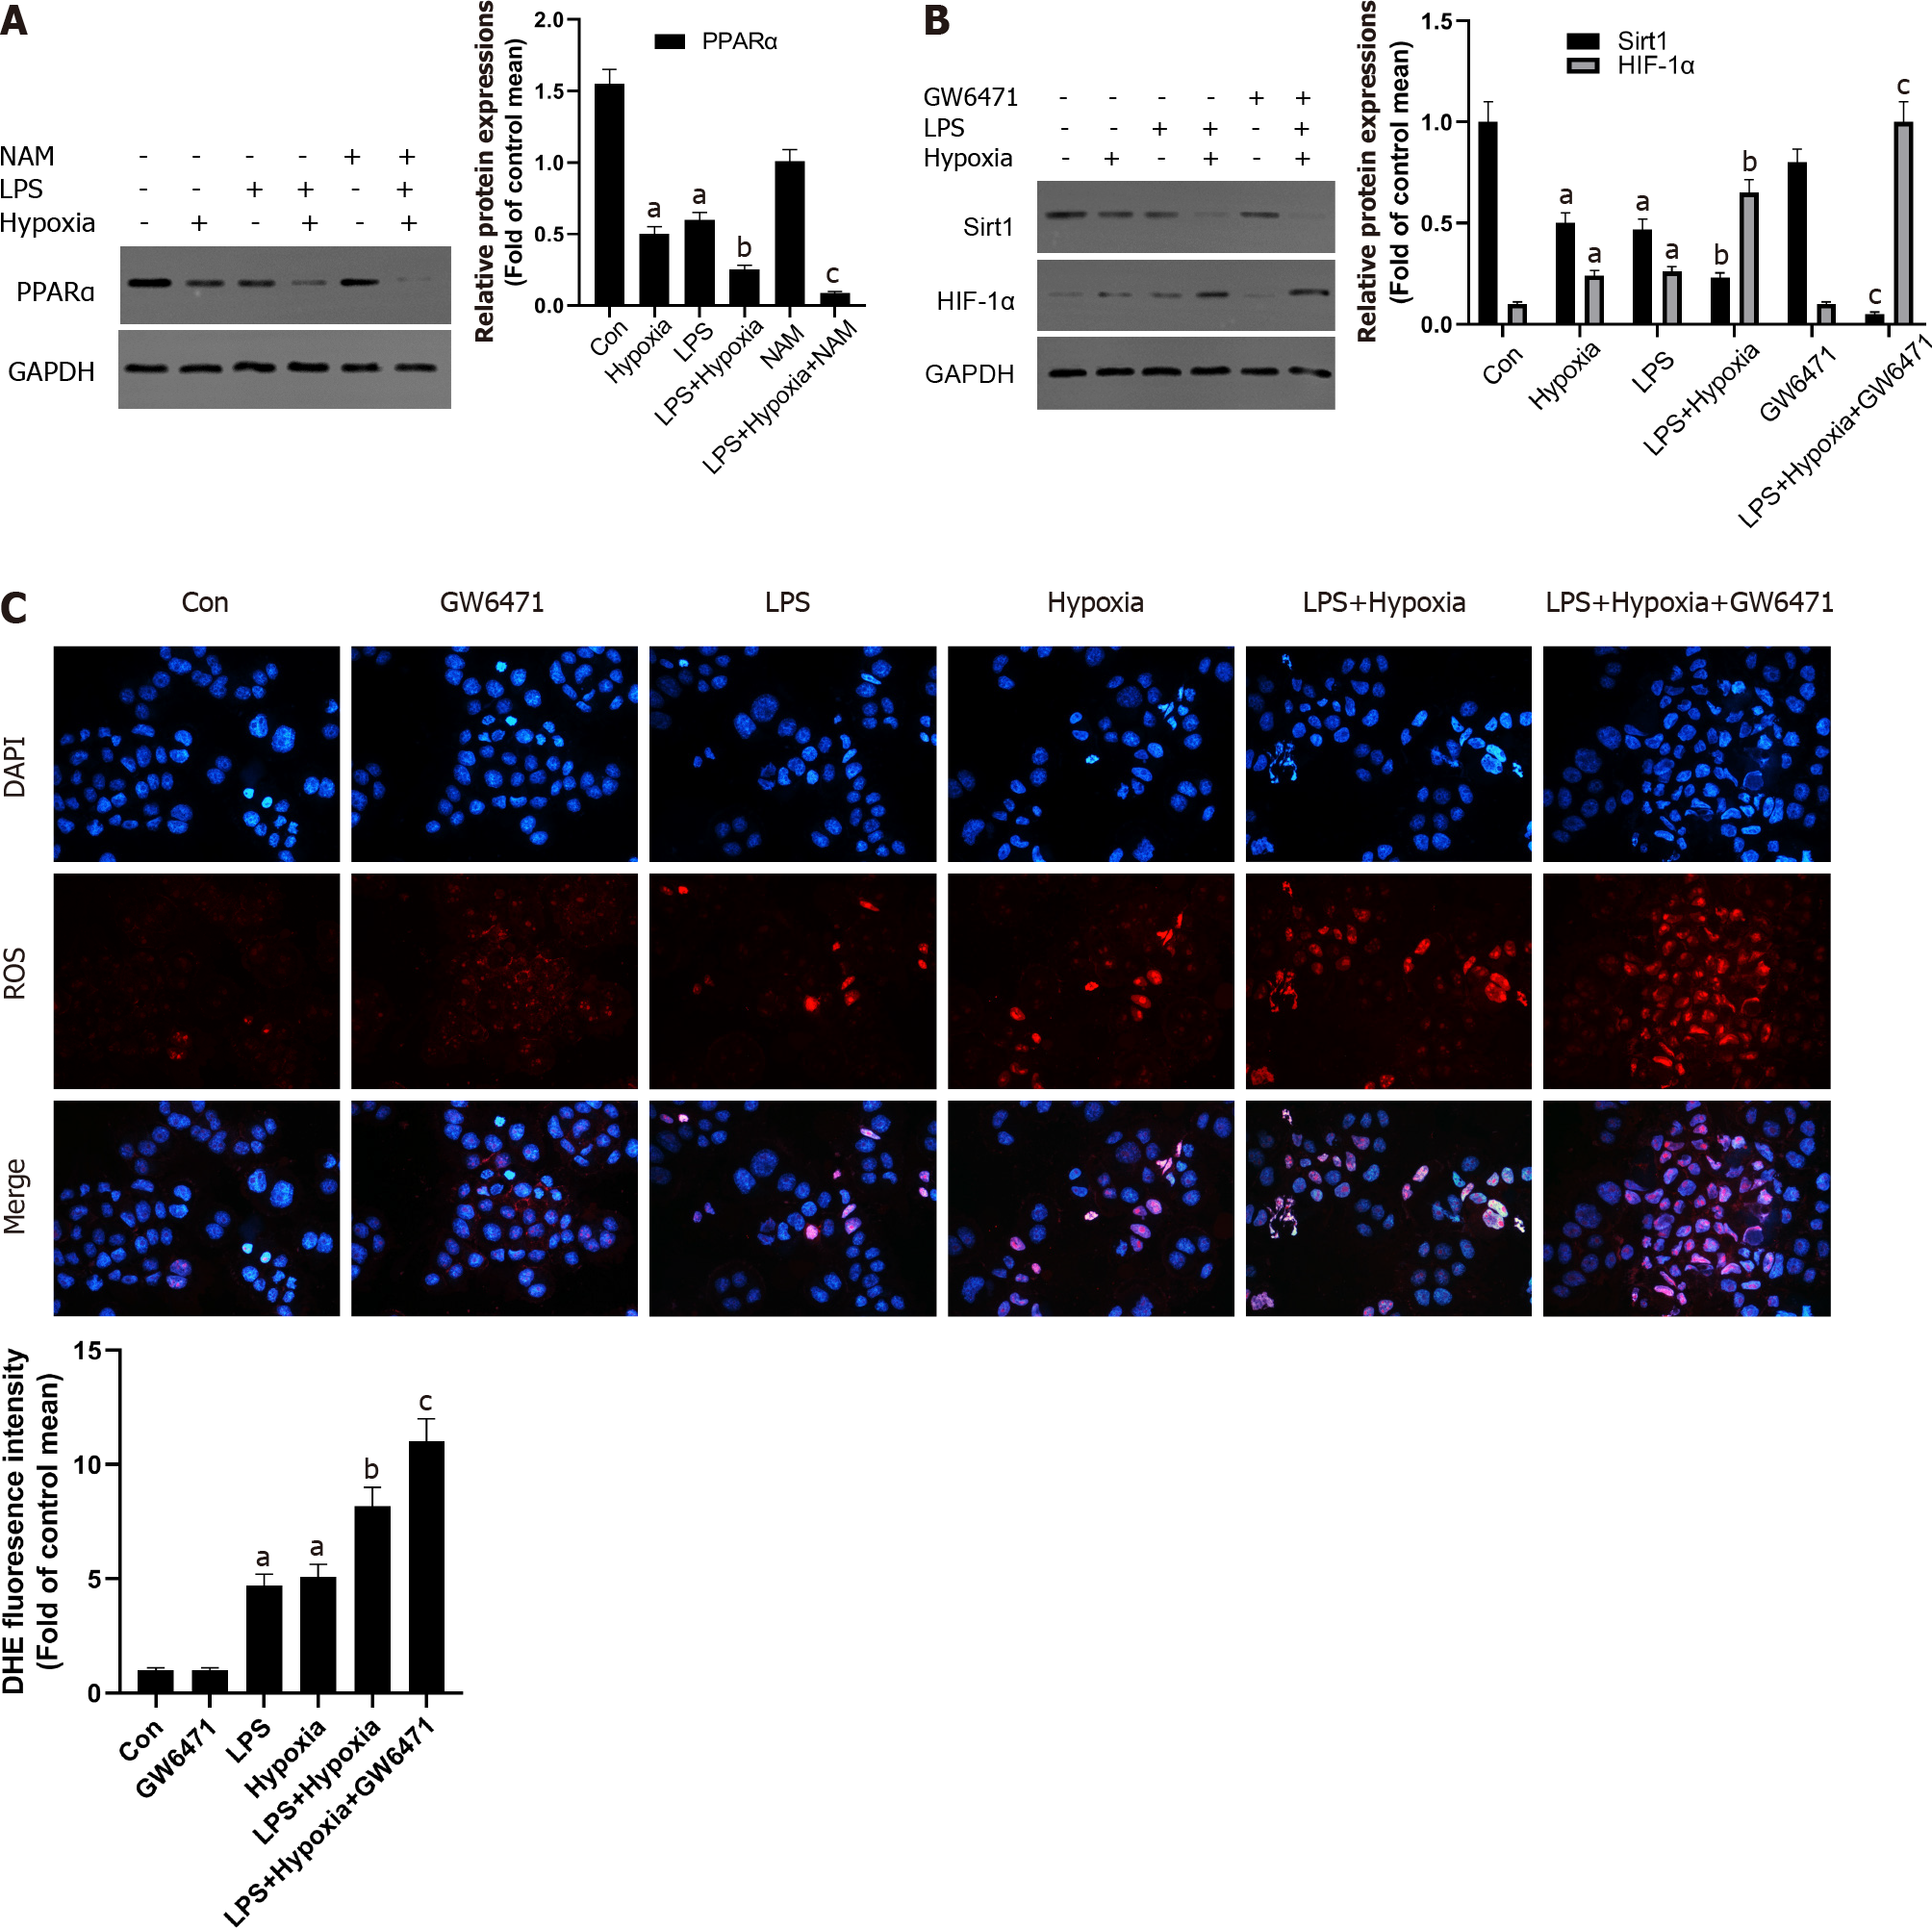
Figure 4 The inhibition of Sirtuin1/peroxisome proliferator-activated receptor alpha signaling pathway increased hypoxia-induced reactive oxygen species production.
A: Western blotting was performed to measure the levels of peroxisome proliferator-activated receptor alpha (PPARα) in L02 cells; B: The levels of Sirtuin1 (Sirt1) and hypoxia inducible factor (HIF)-1α in L02 cells; C: Reactive oxygen species productions were detected by dihydroethidium (DHE) staining and evaluated by quantification of mean fluorescence intensity in DHE staining. Data shown are means ± standard deviations (SDs) of three separate experiments. aP < 0.05 vs Control group; bP < 0.05 vs Lipopolysaccharide (LPS)-treated group; cP < 0.05 vs LPS + Hypoxia-treated group; one-way analysis of variance with Bonferroni's post hoc test; the error bars indicate the SDs.
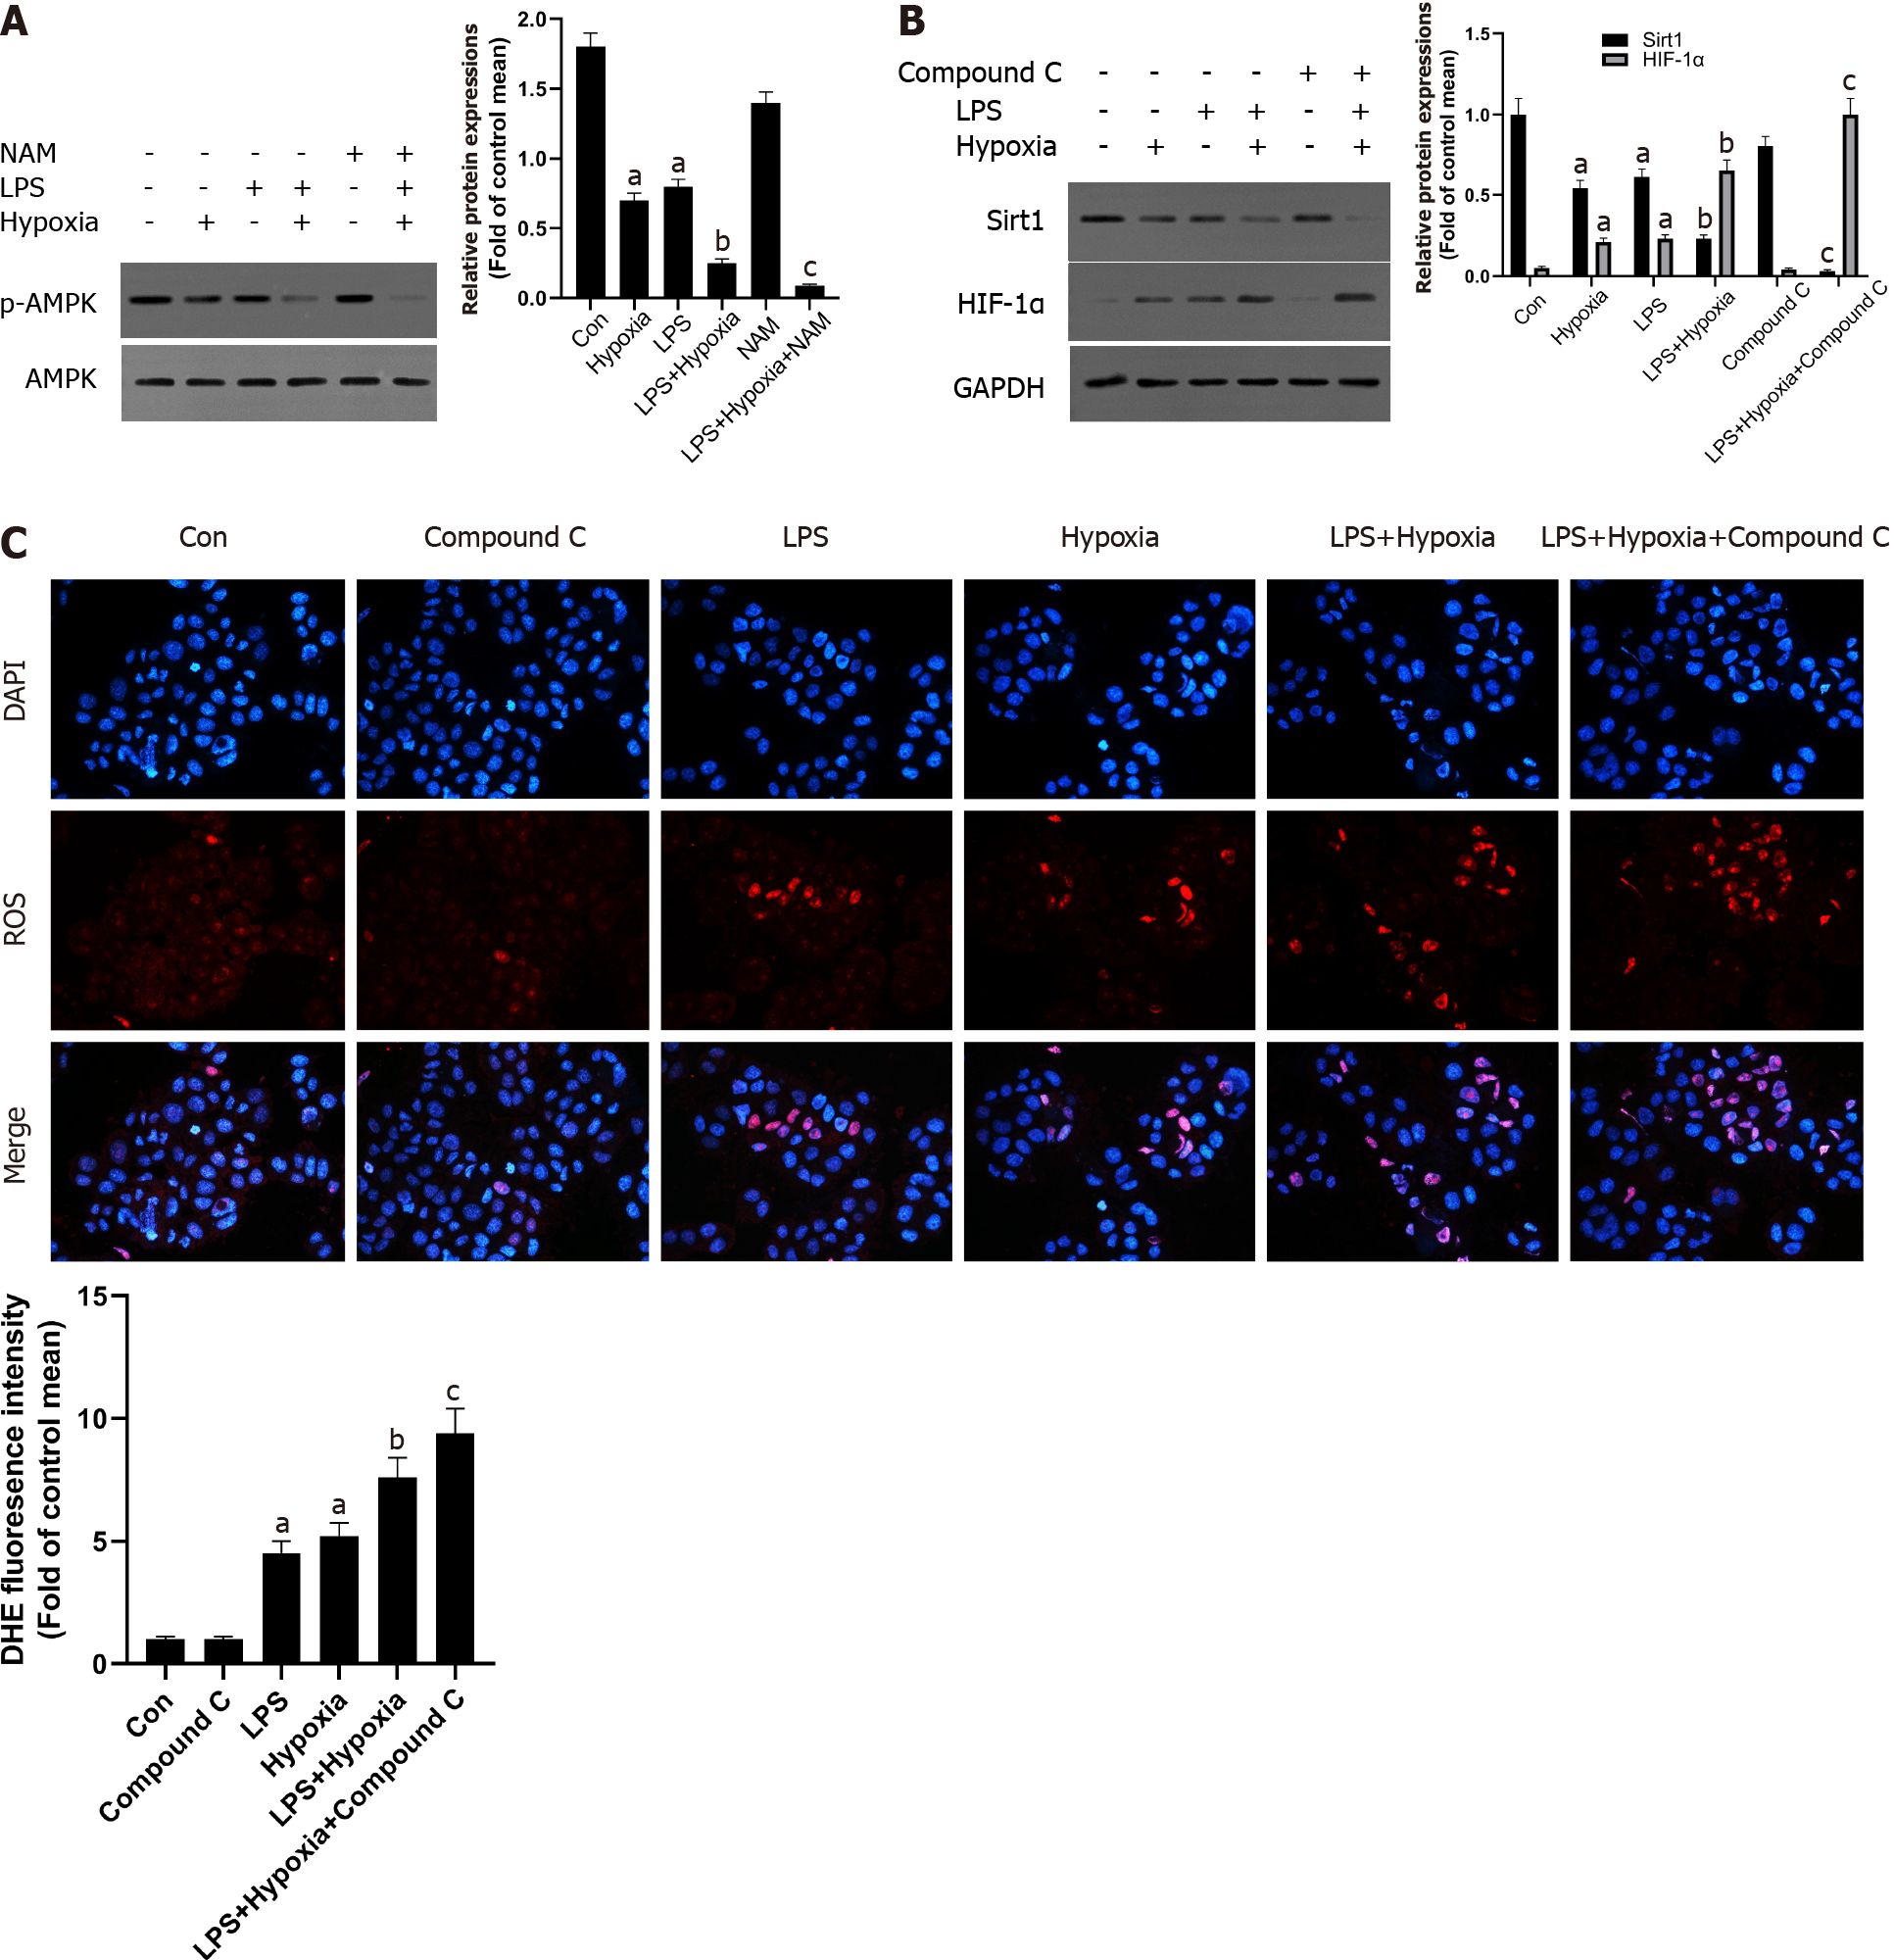
Figure 5 The inhibition of Sirtuin1/AMP-activated protein kinase signaling pathway increased hypoxia-induced reactive oxygen species production.
A: Western blotting was performed to measure the levels of AMP-activated protein kinase (AMPK) and p-AMPK in L02 cells; B: The levels of Sirtuin1 (Sirt1) and hypoxia inducible factor (HIF)-1α in L02 cells; C: Reactive oxygen species (ROS) productions were detected by dihydroethidium (DHE) staining and evaluated by quantification of mean fluorescence intensity in DHE staining. Data shown are means ± standard deviations (SDs) of three separate experiments. aP < 0.05 vs Control group; bP < 0.05 vs Lipopolysaccharide (LPS)-treated group; cP < 0.05 vs LPS + Hypoxia-treated group; one-way analysis of variance combined with Bonferroni's post hoc test; the error bars indicate the SDs.
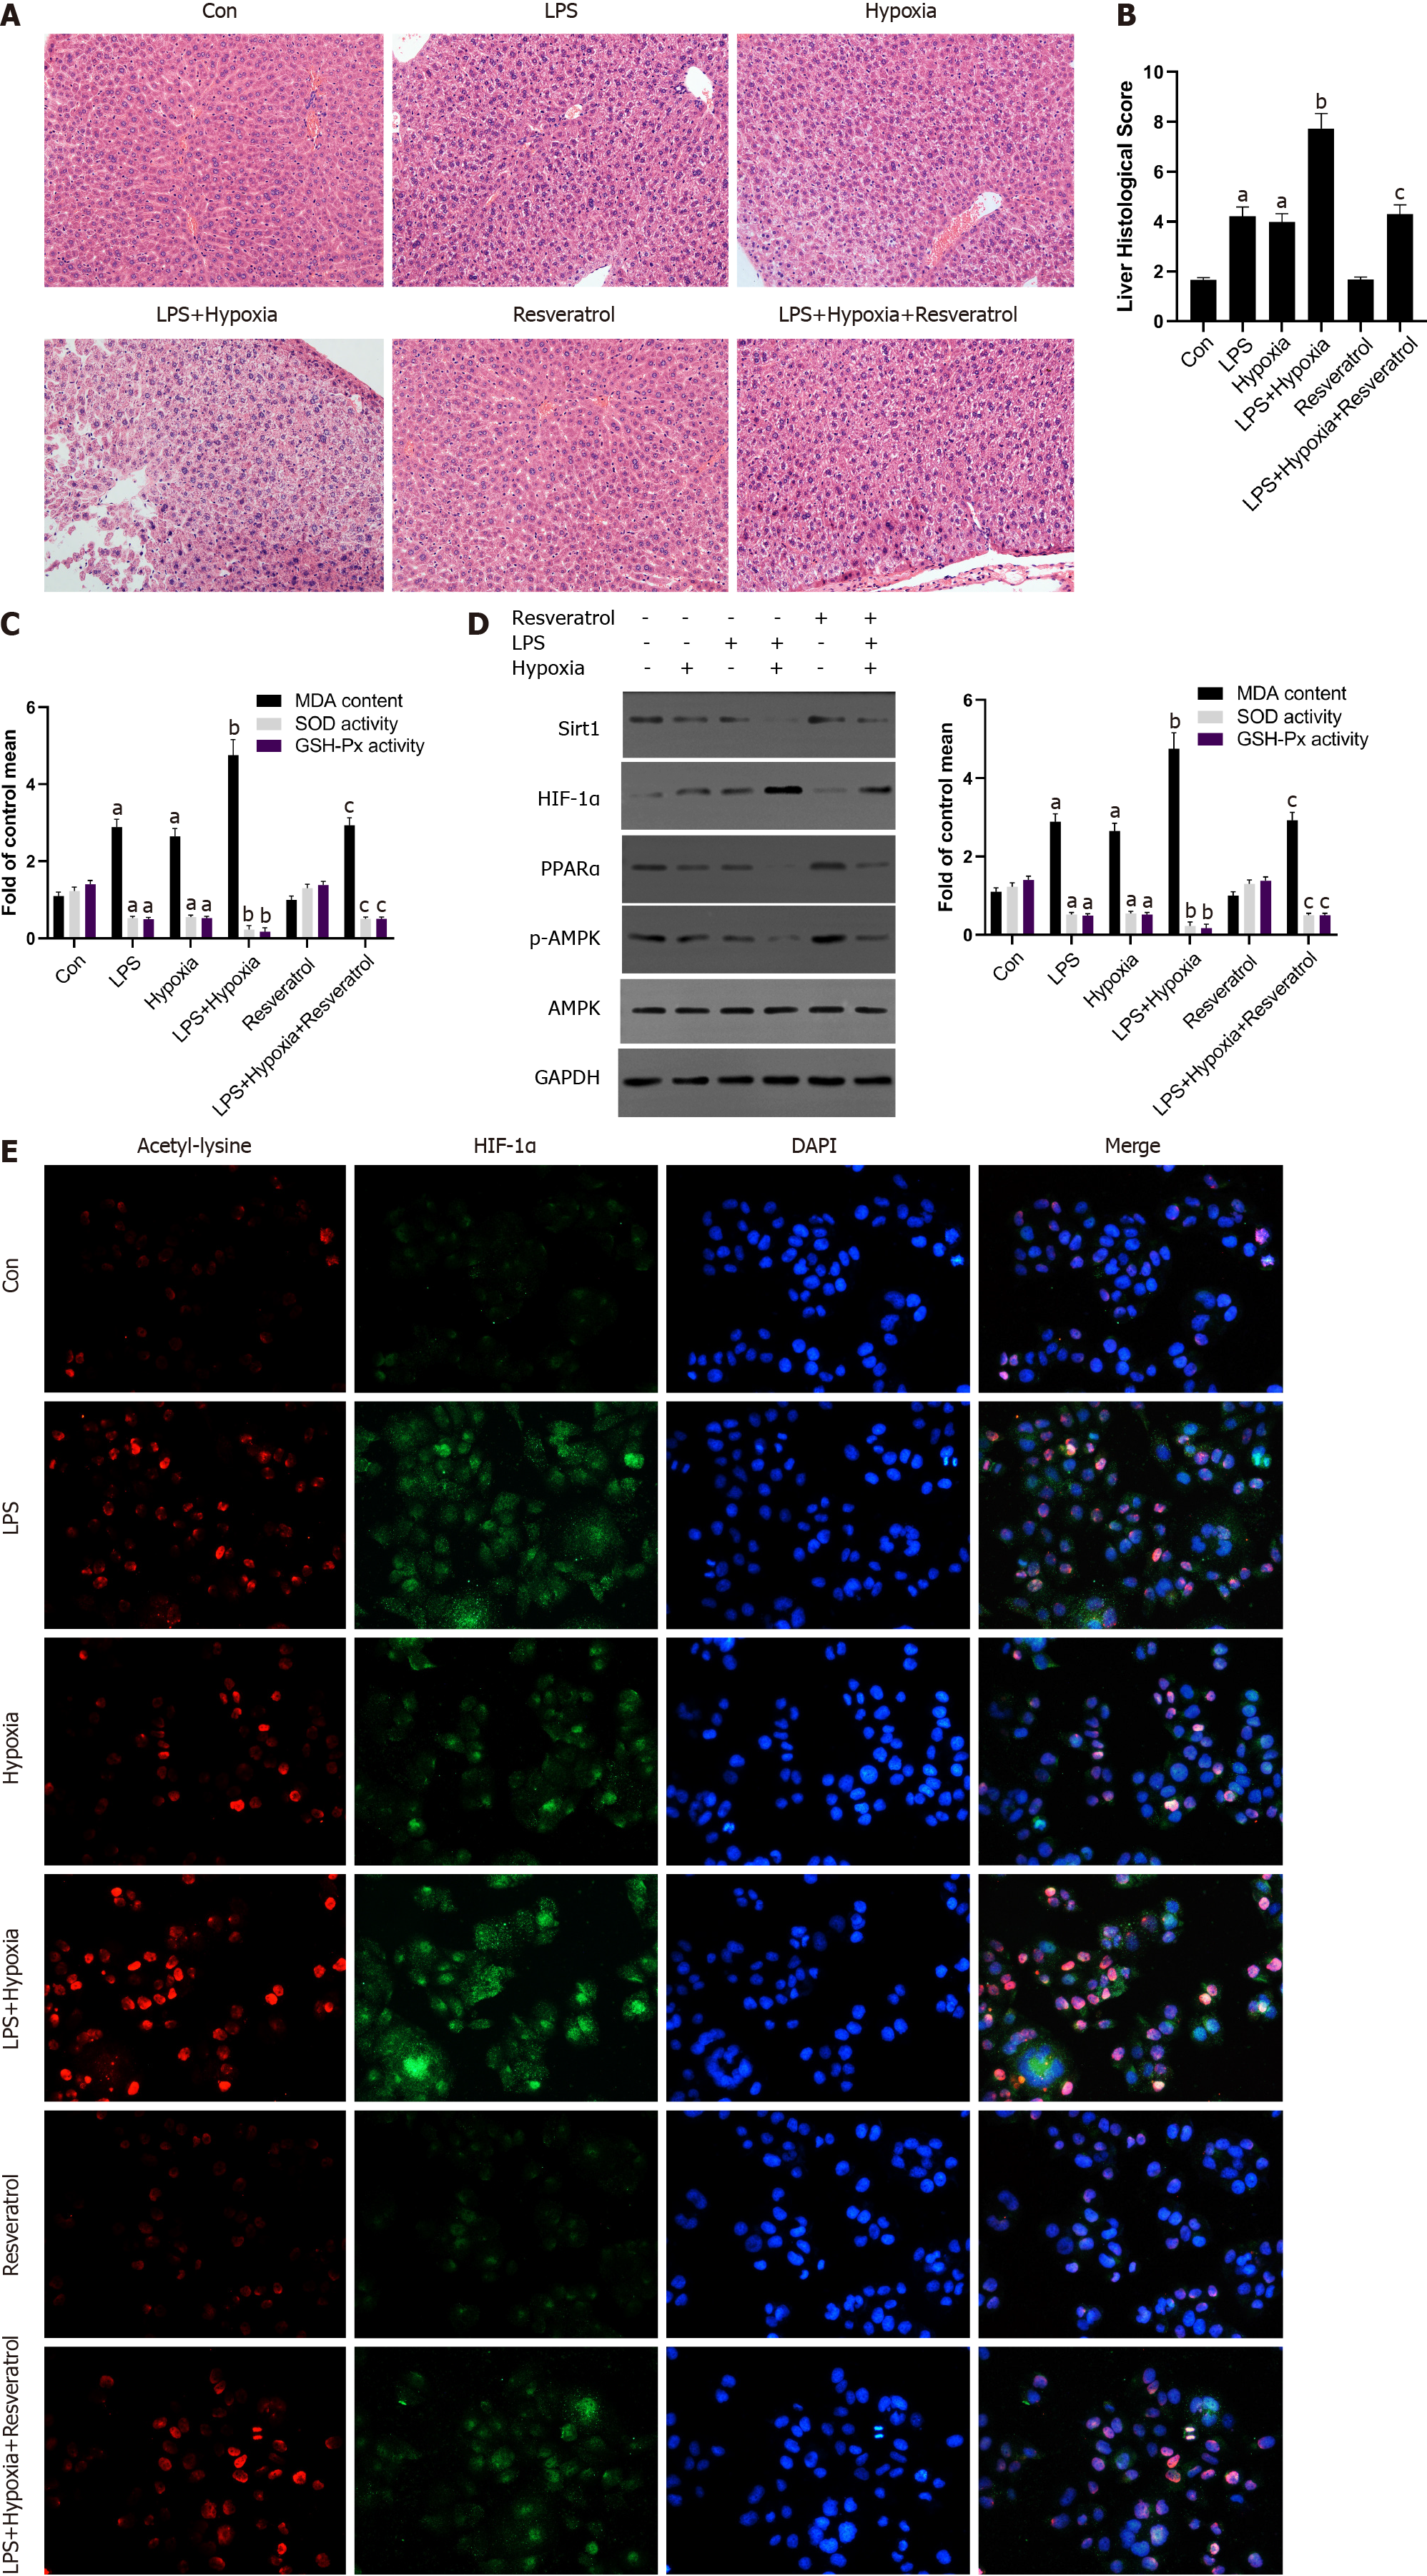
Figure 6 The activation of Sirtuin1 induced the deacetylation and inactivation of hypoxia inducible factor-1α, and subsequently rescued the progressive aggravation of acute liver failure induced by hypoxia.
A: Mice were pretreated with resveratrol or exposed to hypoxia and then stimulated with lipopolysaccharide (LPS). The representative images of hematoxylin and eosin staining of liver in each group; B: The liver histological score of liver in each group; C: The levels of malondialdehyde (MDA), superoxide dismutase (SOD), and glutathione peroxidase (GSH-Px) of mice in each group; D: Western blotting was performed to measure the levels of Sirtuin1 (Sirt1), hypoxia inducible factor (HIF)-1α, peroxisome proliferator-activated receptor alpha (PPARα) and p-AMP-activated protein kinase (AMPK) in liver tissues and the protein expression were quantified; E: The representative images of immunofluorescence staining for Acetyl-lysine and HIF-1α. Data shown are means ± standard deviations (SDs) of three separate experiments. aP < 0.05 vs Control group; bP < 0.05 vs LPS-treated group; cP < 0.05 vs LPS + Hypoxia-treated group; one-way analysis of variance combined with Bonferroni's post hoc test; the error bars indicate the SDs.
- Citation: Cao P, Chen Q, Shi CX, Wang LW, Gong ZJ. Sirtuin1 attenuates acute liver failure by reducing reactive oxygen species via hypoxia inducible factor 1α. World J Gastroenterol 2022; 28(17): 1798-1813
- URL: https://www.wjgnet.com/1007-9327/full/v28/i17/1798.htm
- DOI: https://dx.doi.org/10.3748/wjg.v28.i17.1798


