Copyright
©The Author(s) 2021.
World J Gastroenterol. Nov 7, 2021; 27(41): 7173-7189
Published online Nov 7, 2021. doi: 10.3748/wjg.v27.i41.7173
Published online Nov 7, 2021. doi: 10.3748/wjg.v27.i41.7173
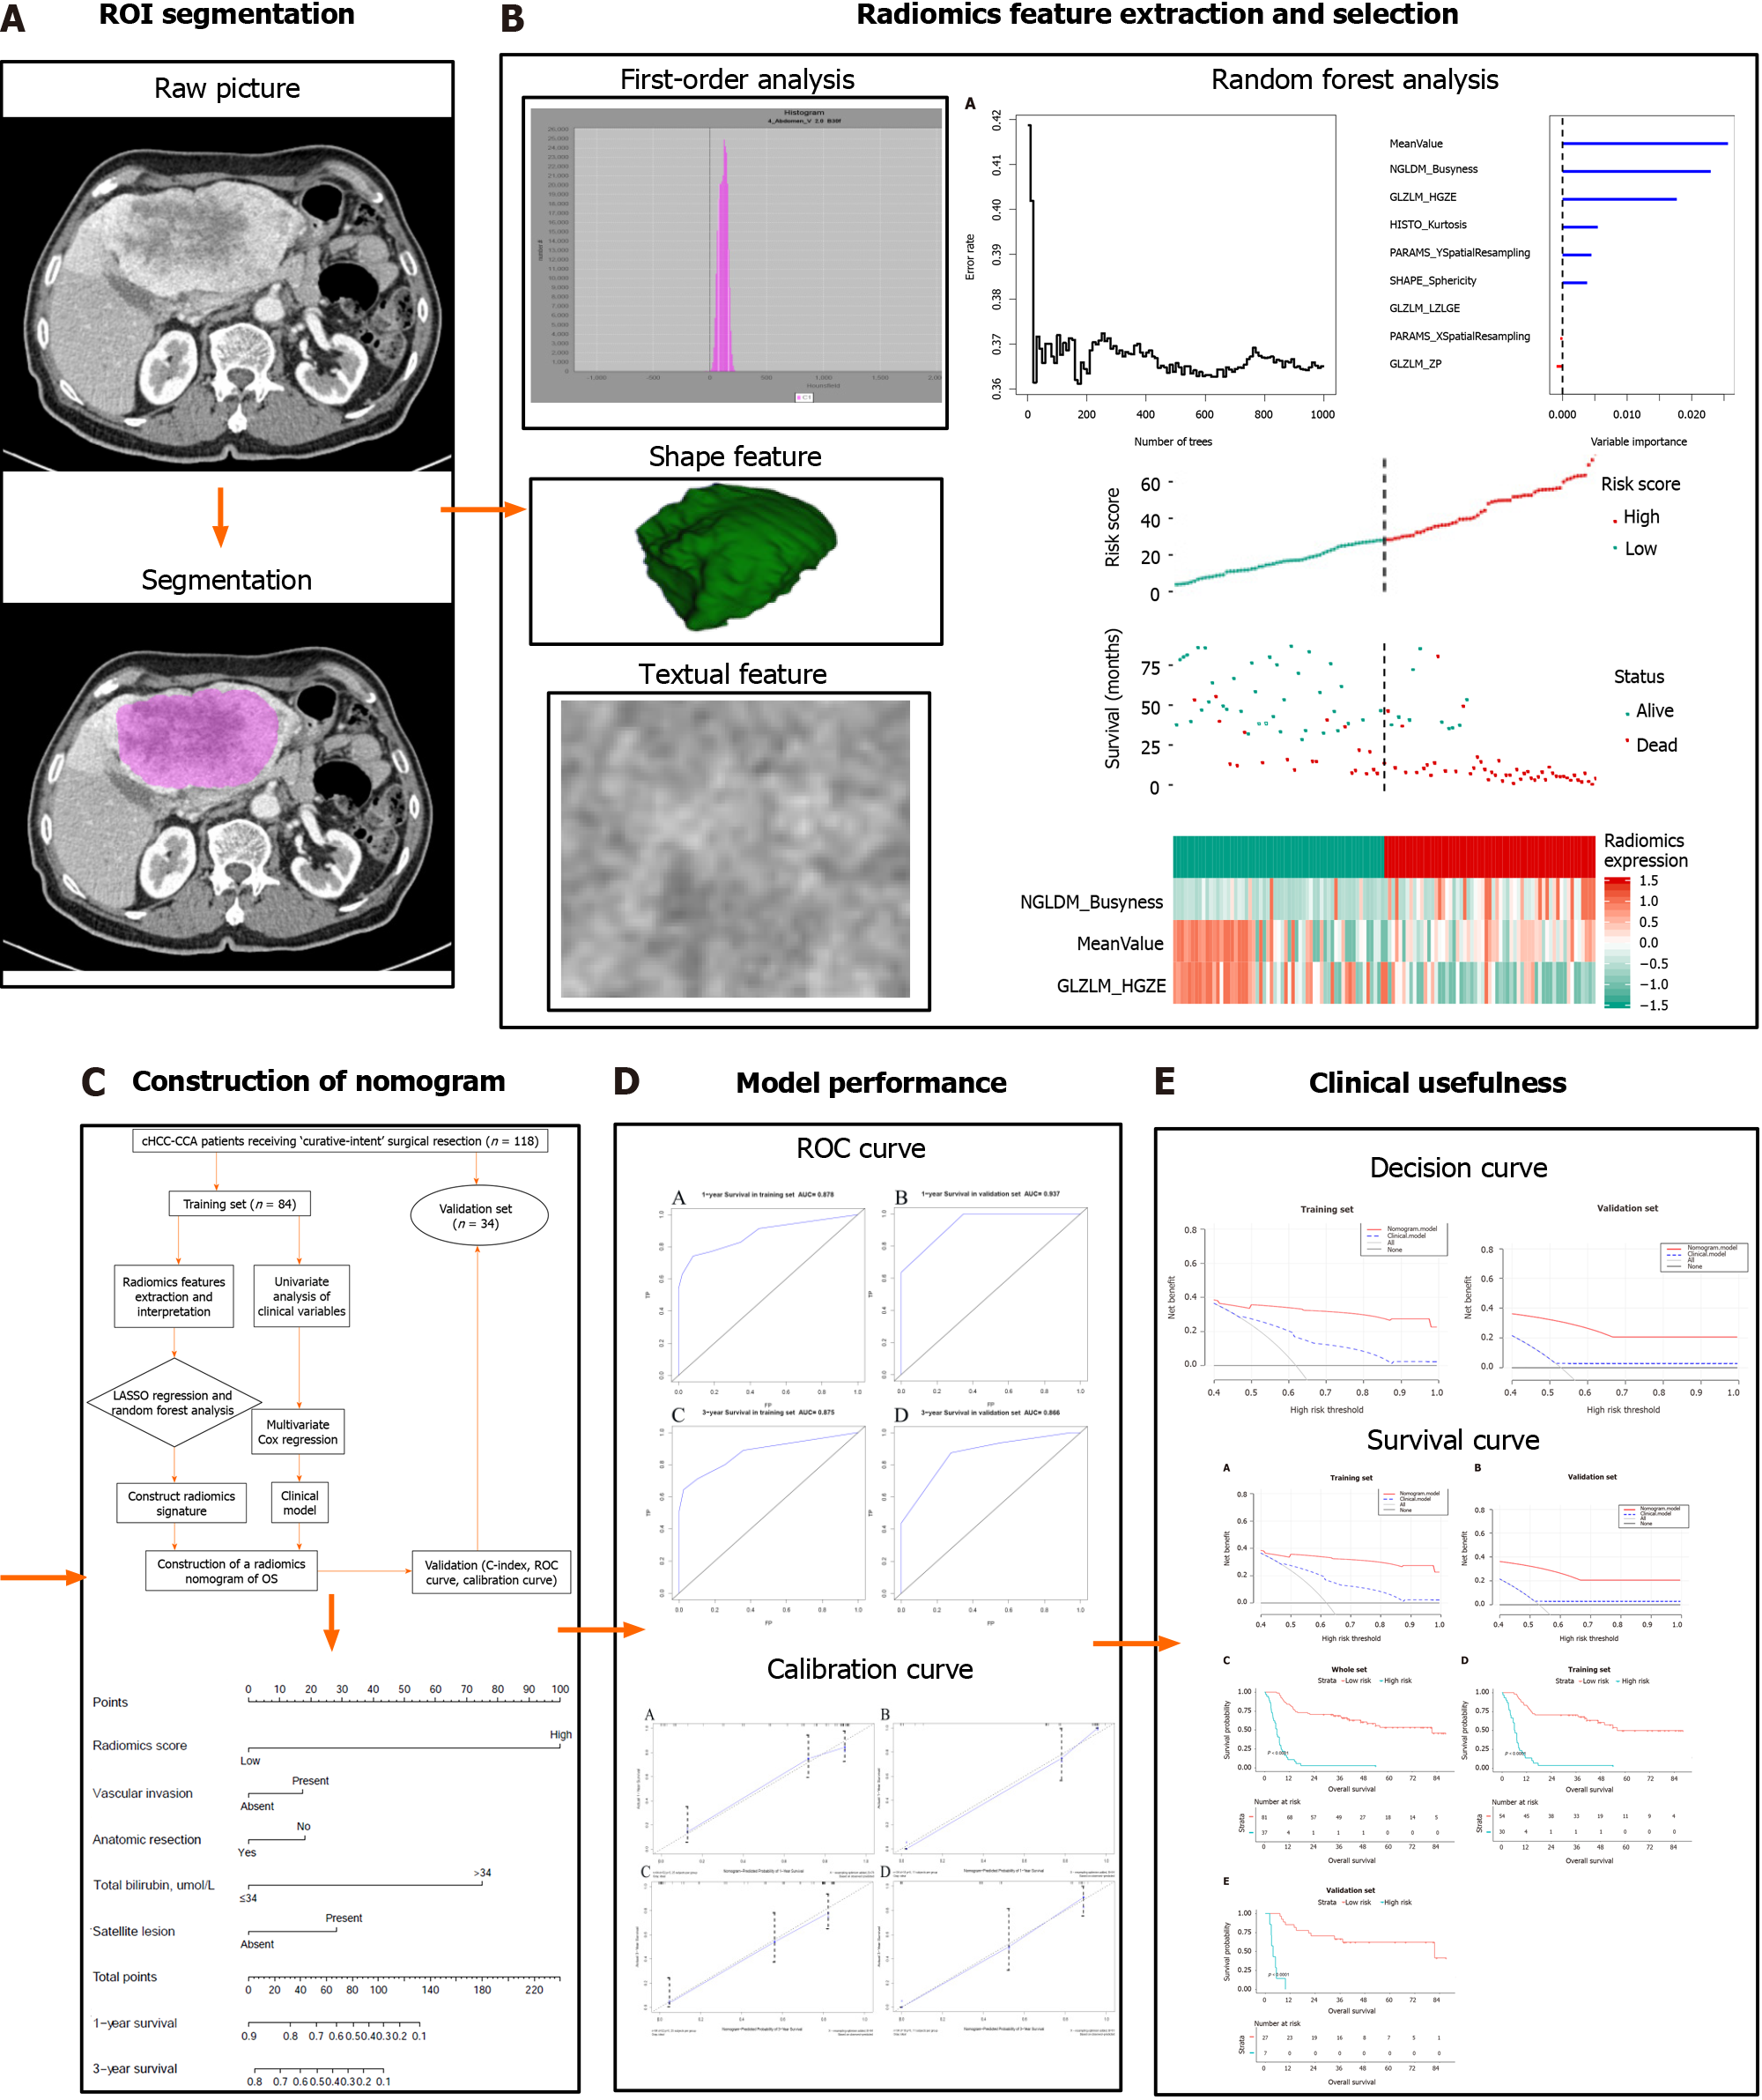
Figure 1 Study workflow.
A: Segmentation of the region of interest; B: Extraction and selection of radiomics features; C: Construction of nomogram; D: Comparison of model performance; E: Decision curve analysis and overall survival comparisons between the training and validation sets. ROI: Region of interest; cHCC-CCA: Combined hepatocellular carcinoma and cholangiocarcinoma; LASSO: Least absolute shrinkage and selection operator; OS: Overall survival; ROC: Receiver operating characteristic.
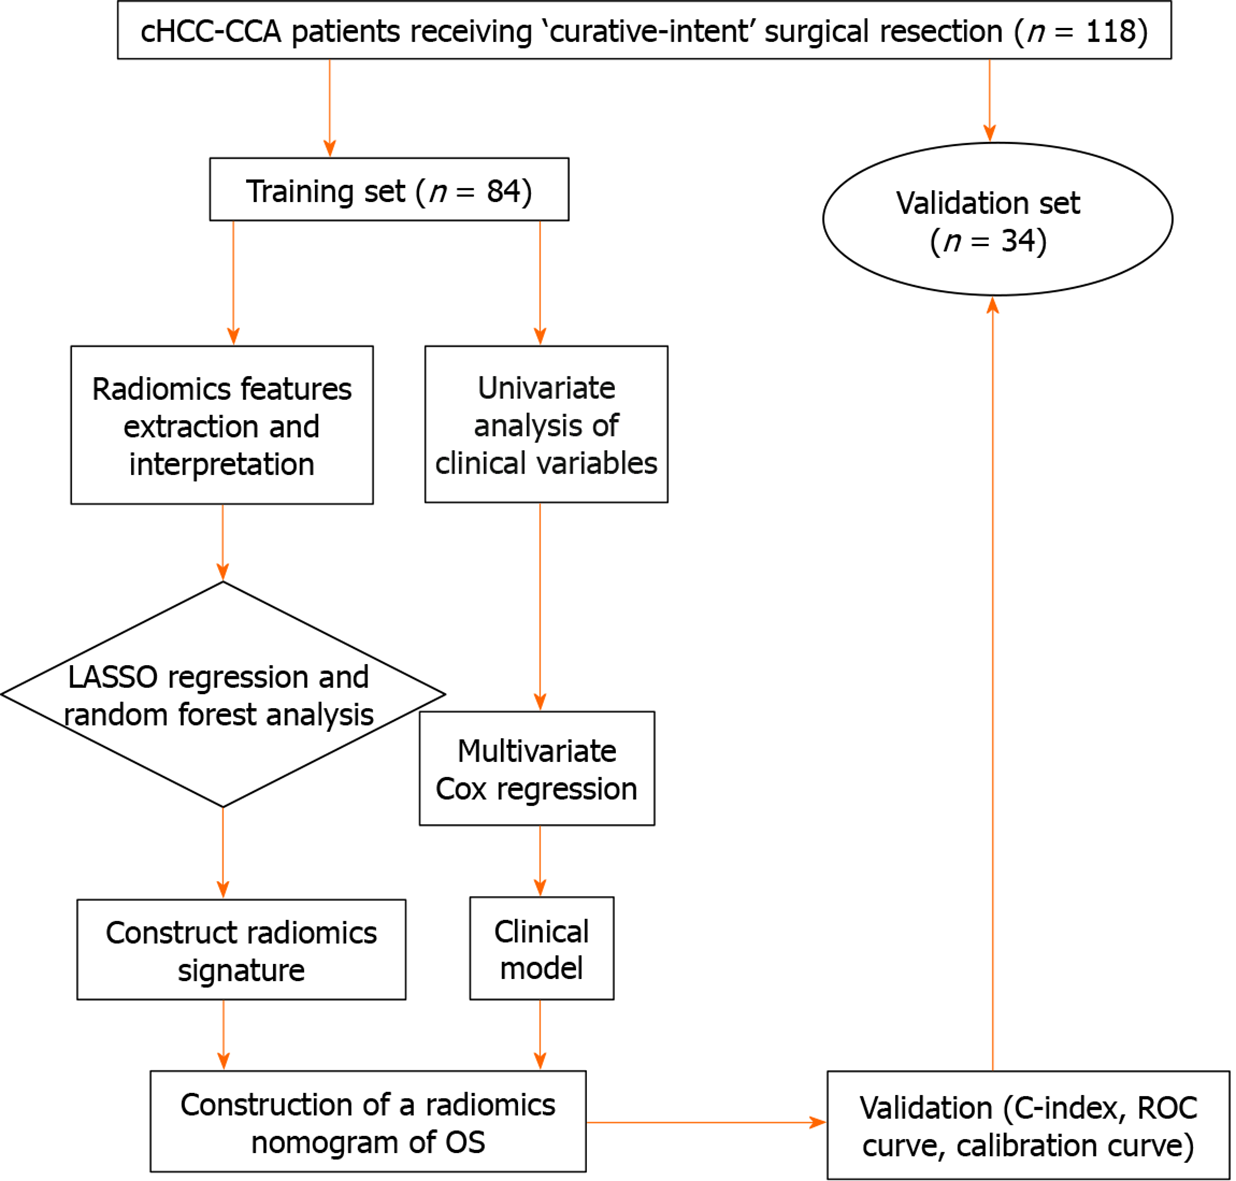
Figure 2 Flow diagram of patient selection.
cHCC-CCA: Combined hepatocellular carcinoma and cholangiocarcinoma; LASSO: Least absolute shrinkage and selection operator; OS: Overall survival; ROC: Receiver operating characteristic.
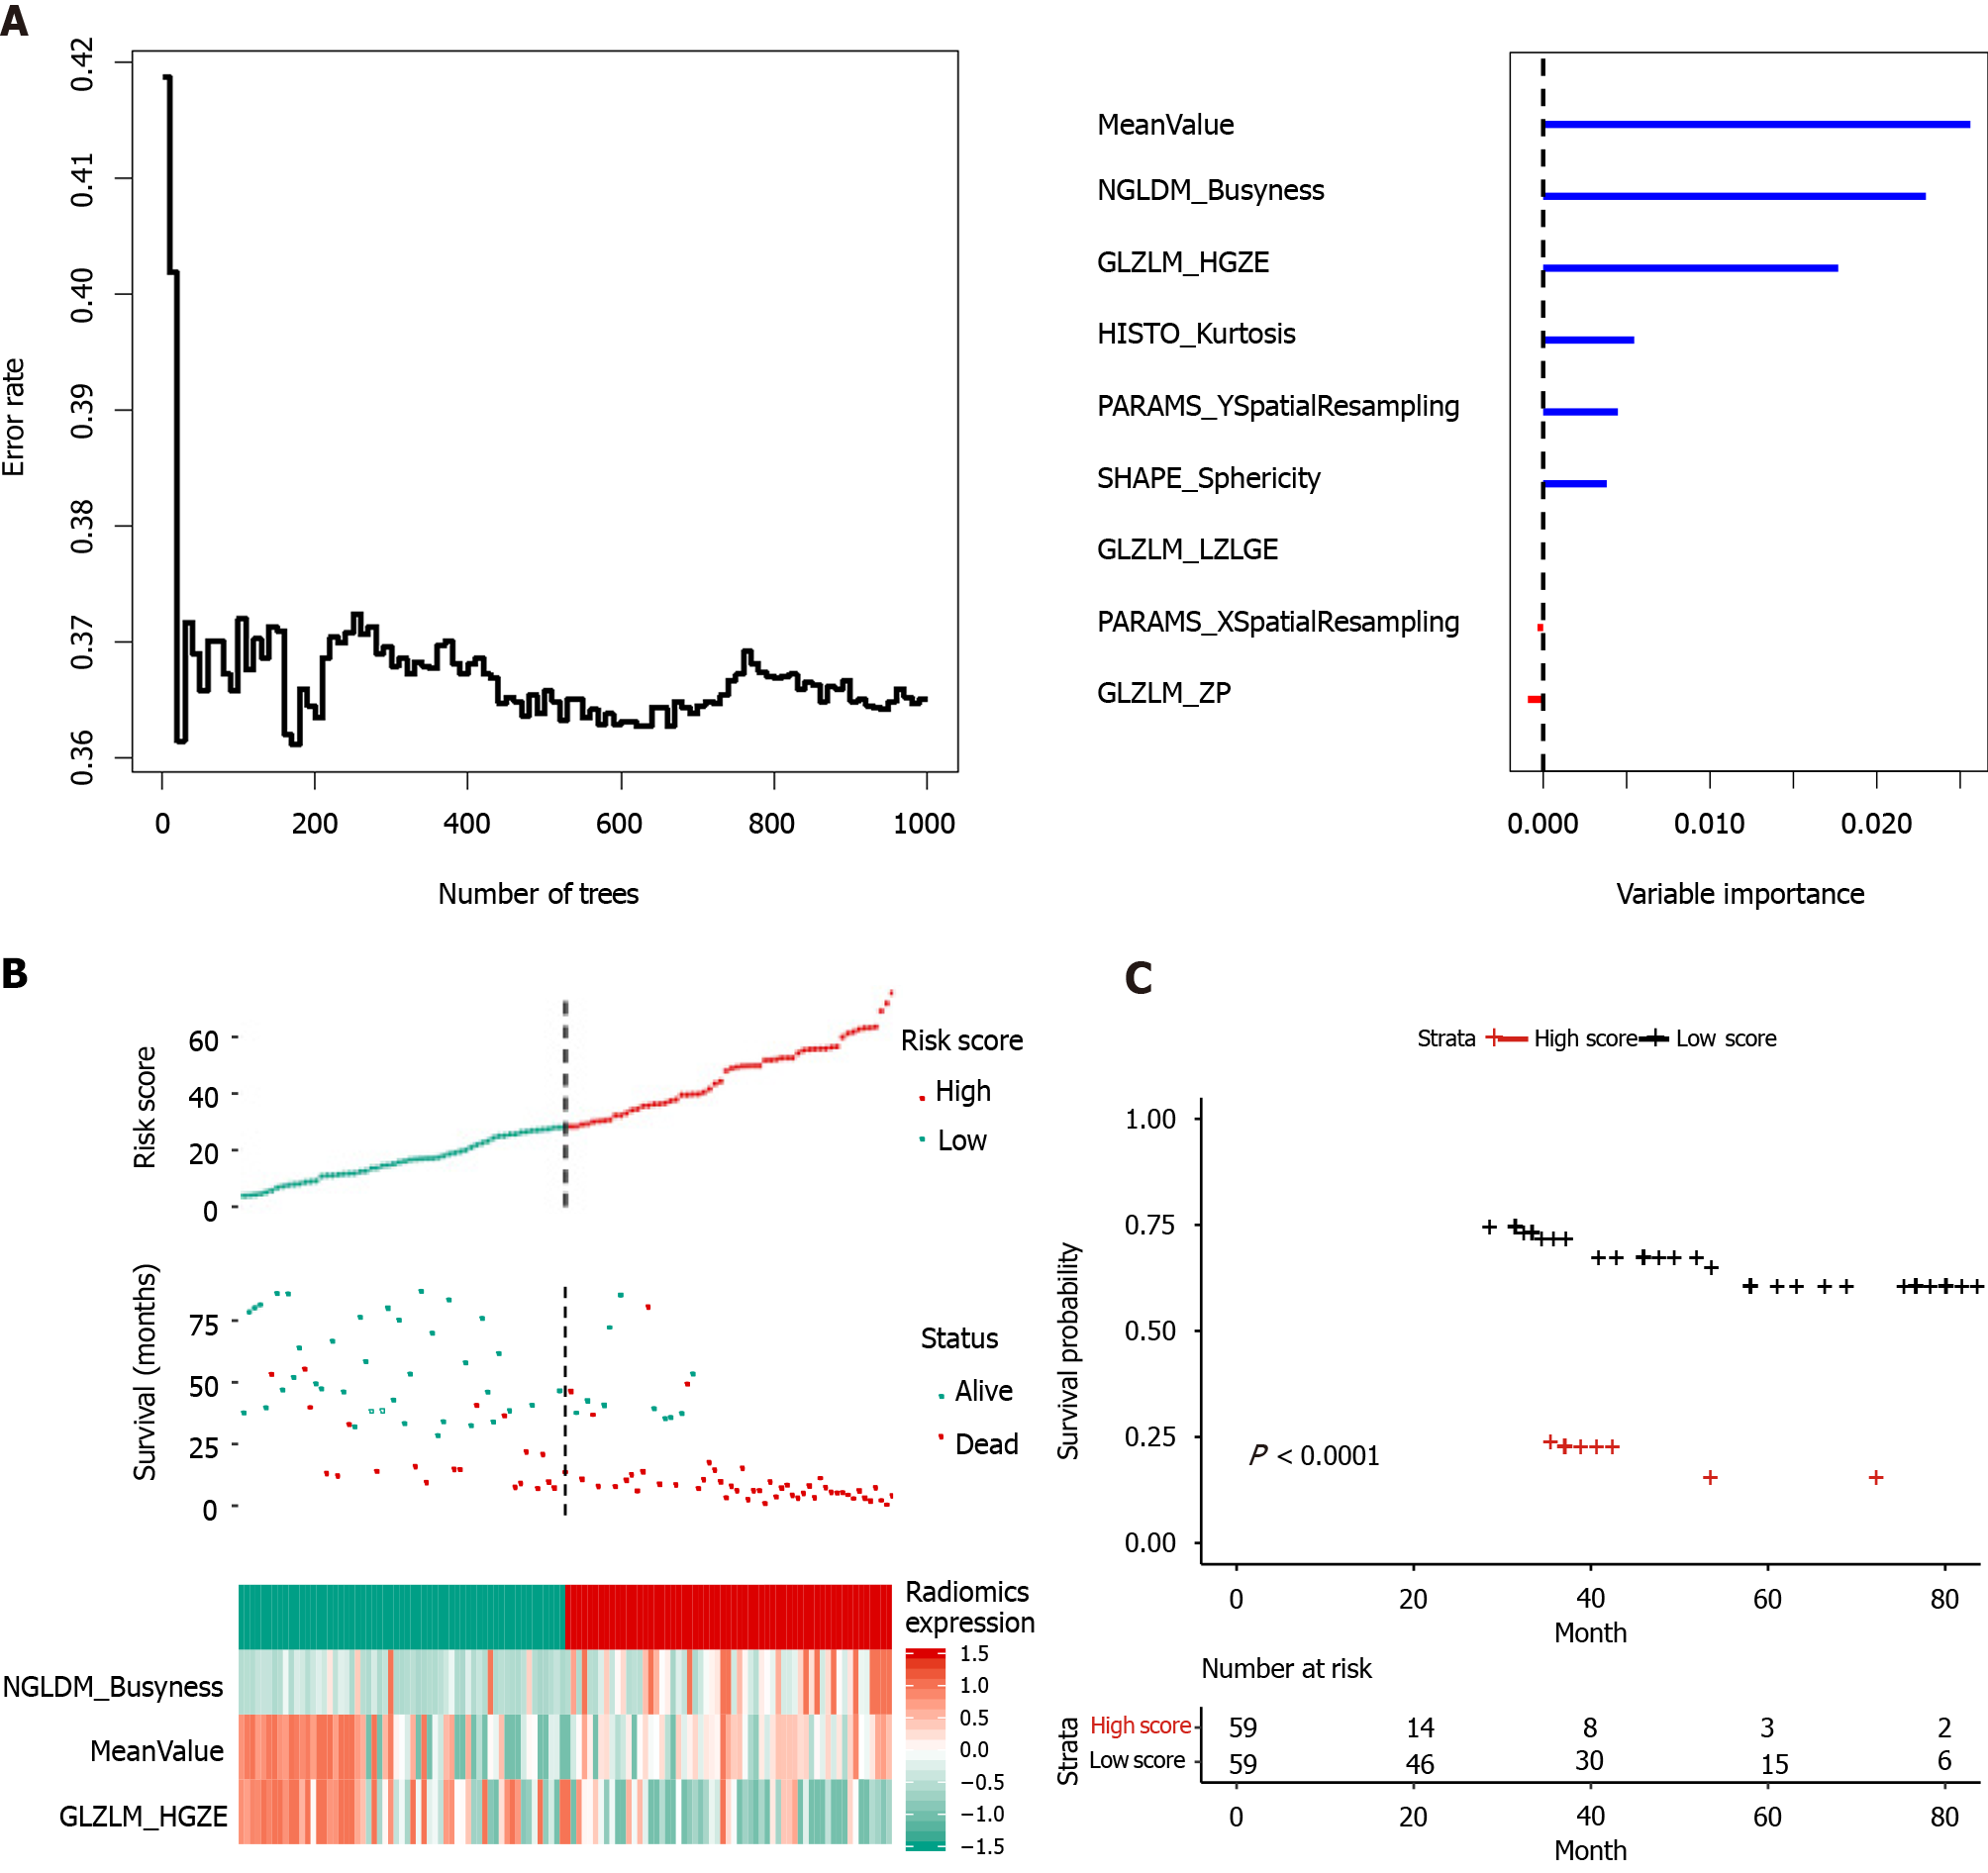
Figure 3 Radiomics feature selection.
A: Random forest analysis. Least absolute shrinkage and selection operator regression selected nine radiomics features, of which three were chosen by random forest analysis; B: Weights of MeanValue, NGLDM Busyness, and GLZLM HGZE in each patient; C: Overall survival curves for the entire cohort of patients, stratified by low or high radiomics score.
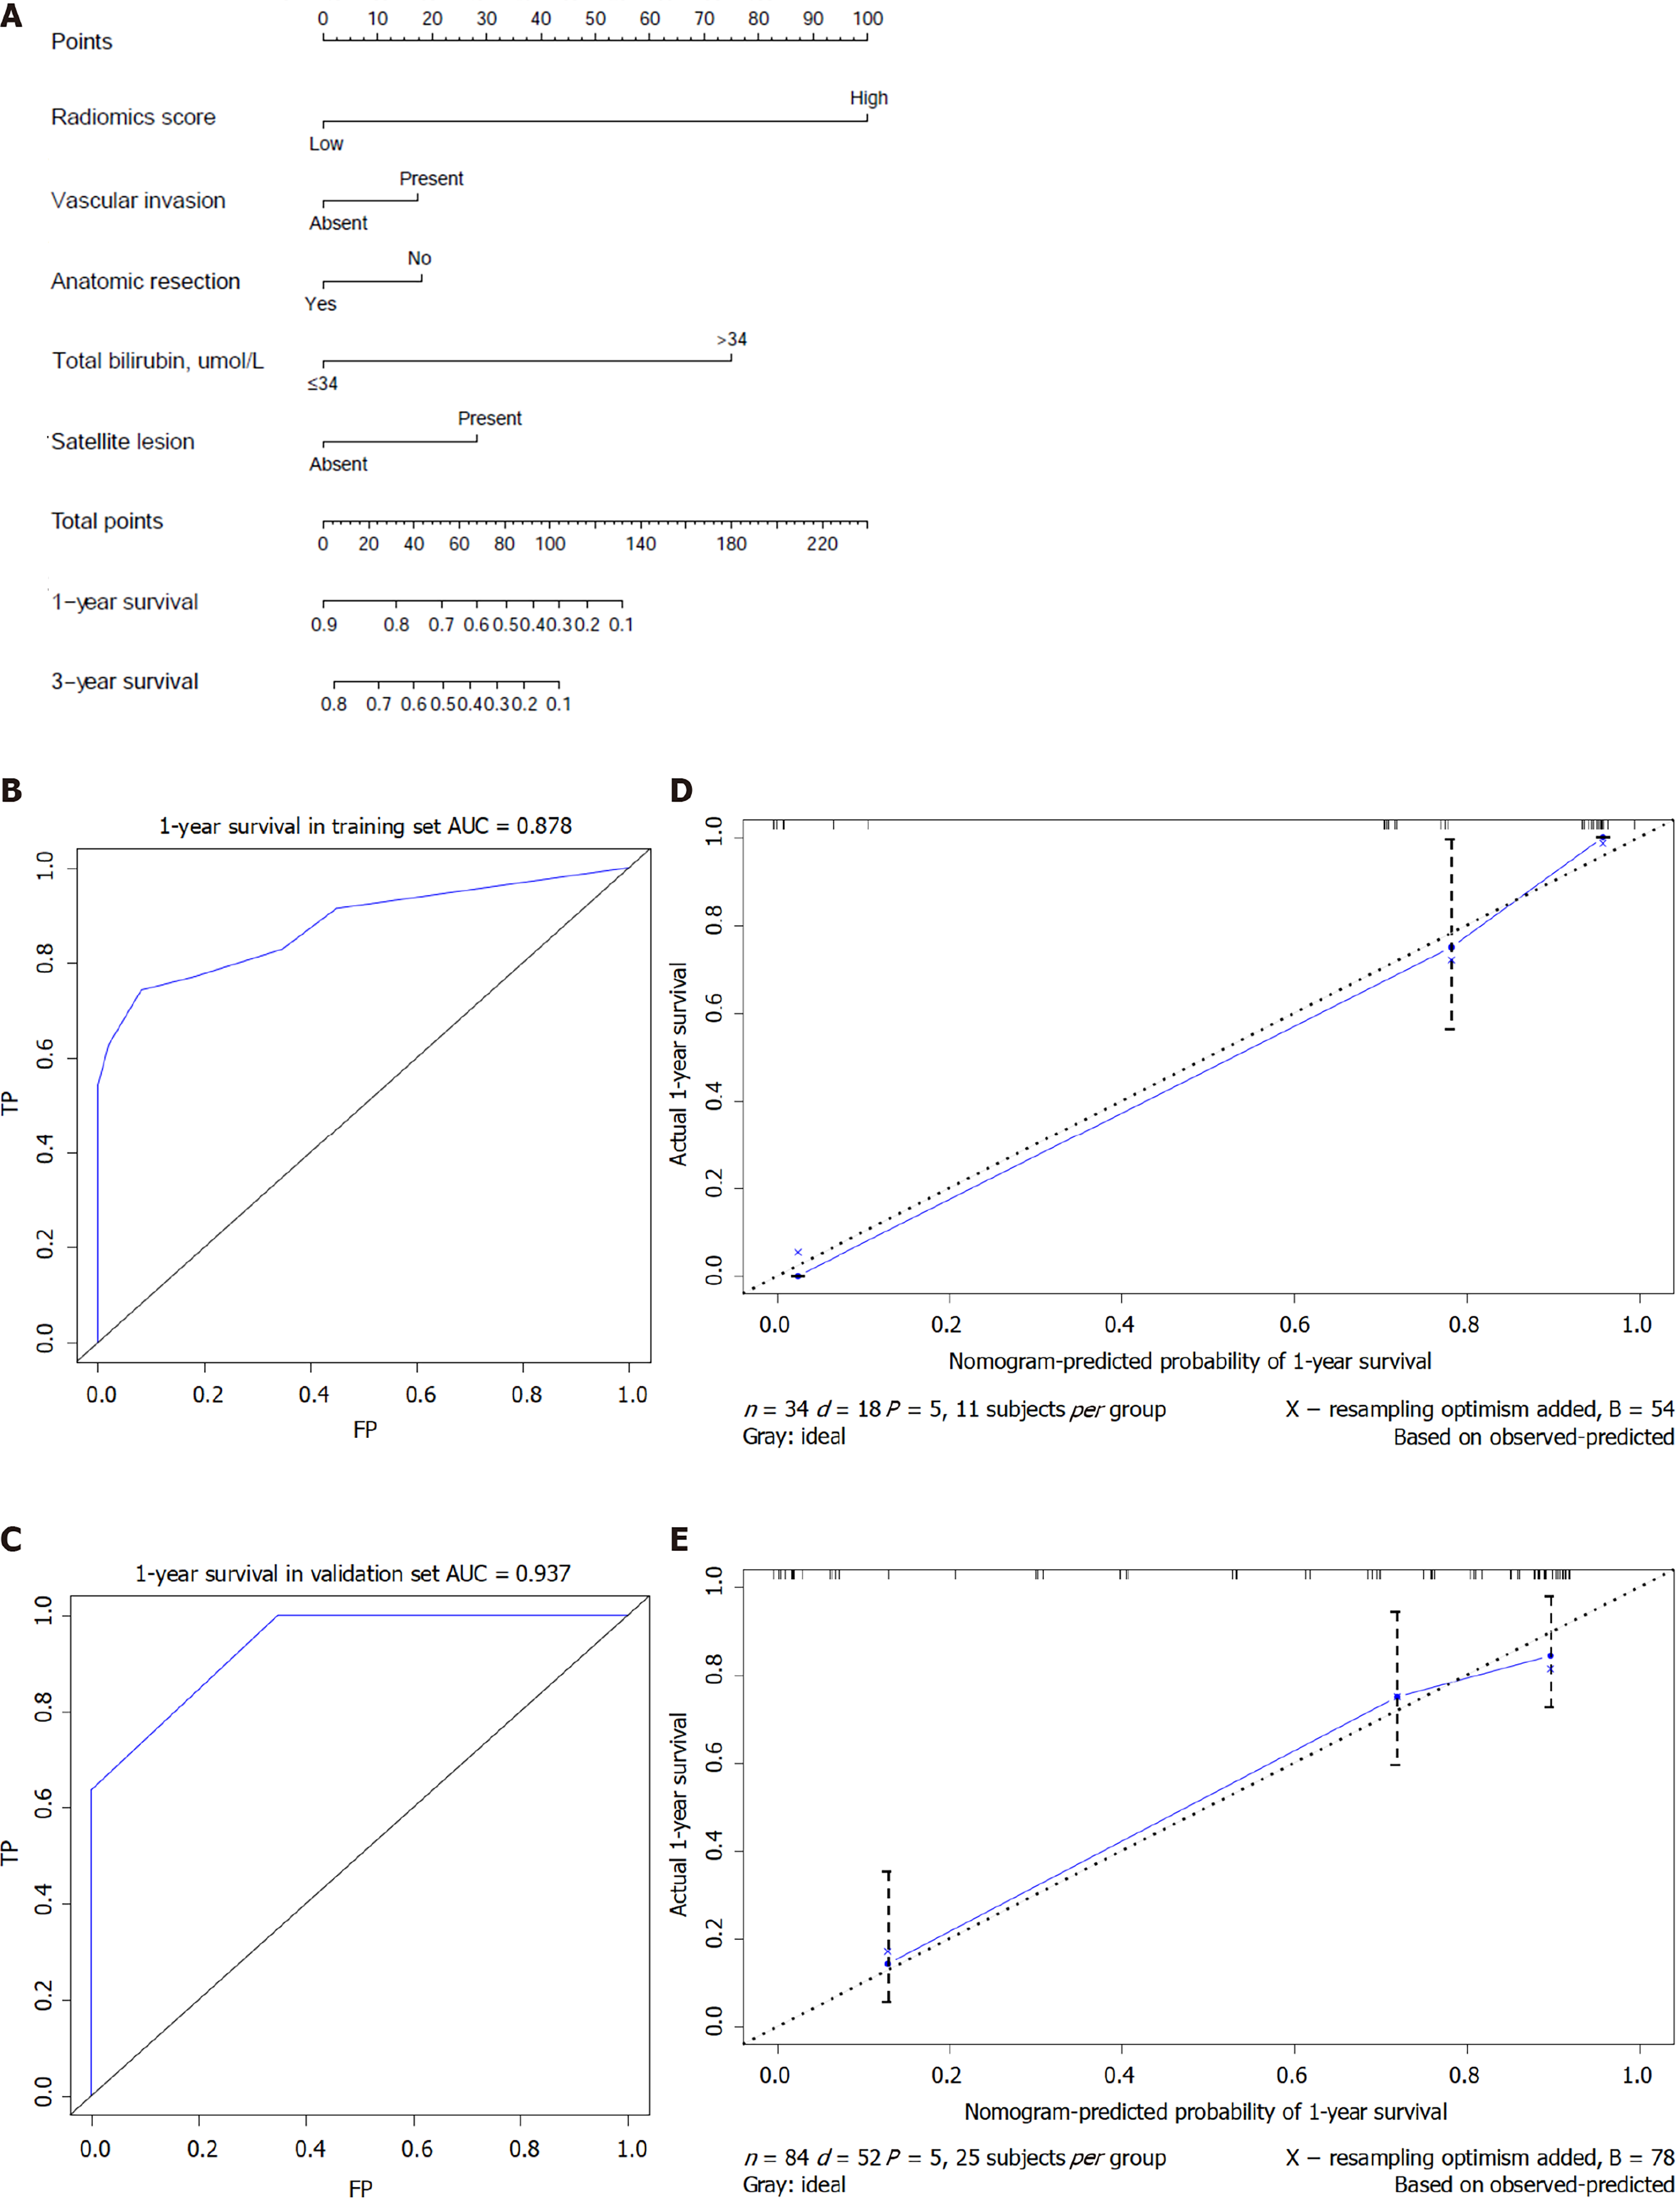
Figure 4 Construction and validation of a radiomics nomogram to predict overall survival of combined hepatocellular carcinoma and cholangiocarcinoma patients after surgical resection.
A: Radiomics nomogram to predict overall survival (OS) at 1 and 3 years; B and C: Receiver operating characteristic curves for predicting 1-year OS in the training or validation set. The area under the curve in both cases was > 0.85; D and E: Calibration curves for 1-year OS in the training and validation sets. The horizontal axis is the survival rate predicted by the nomogram, and the vertical axis is the actual survival rate. The black dashed line indicates the case of perfect agreement between the two rates.
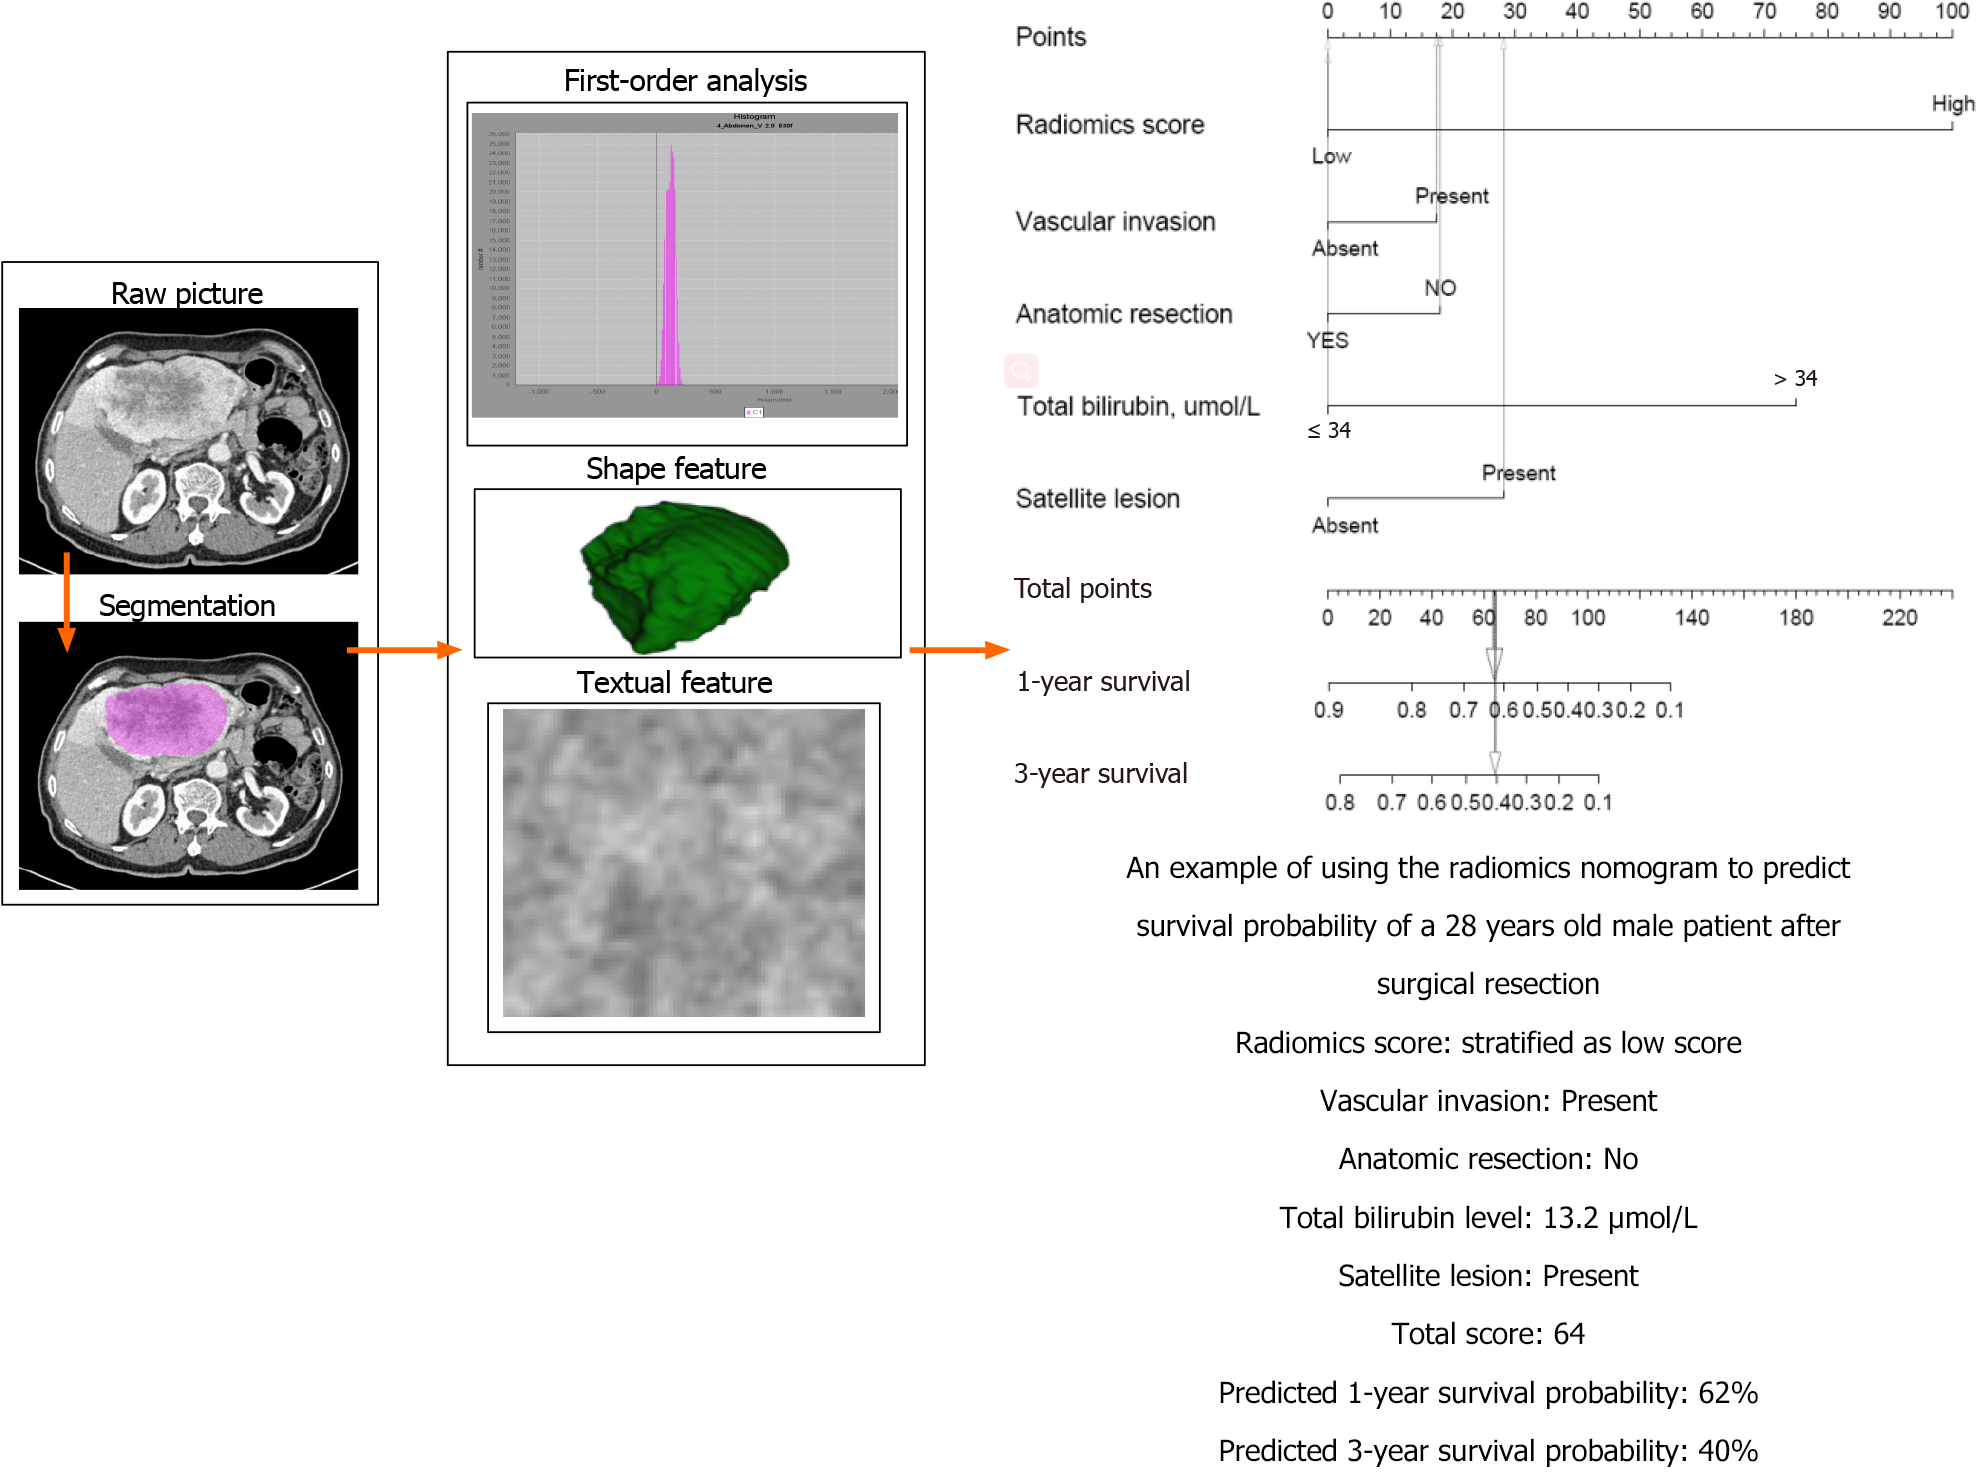
Figure 5 Example of using the radiomics nomogram to predict the overall survival of a 28-year-old man with combined hepatocellular carcinoma and cholangiocarcinoma.
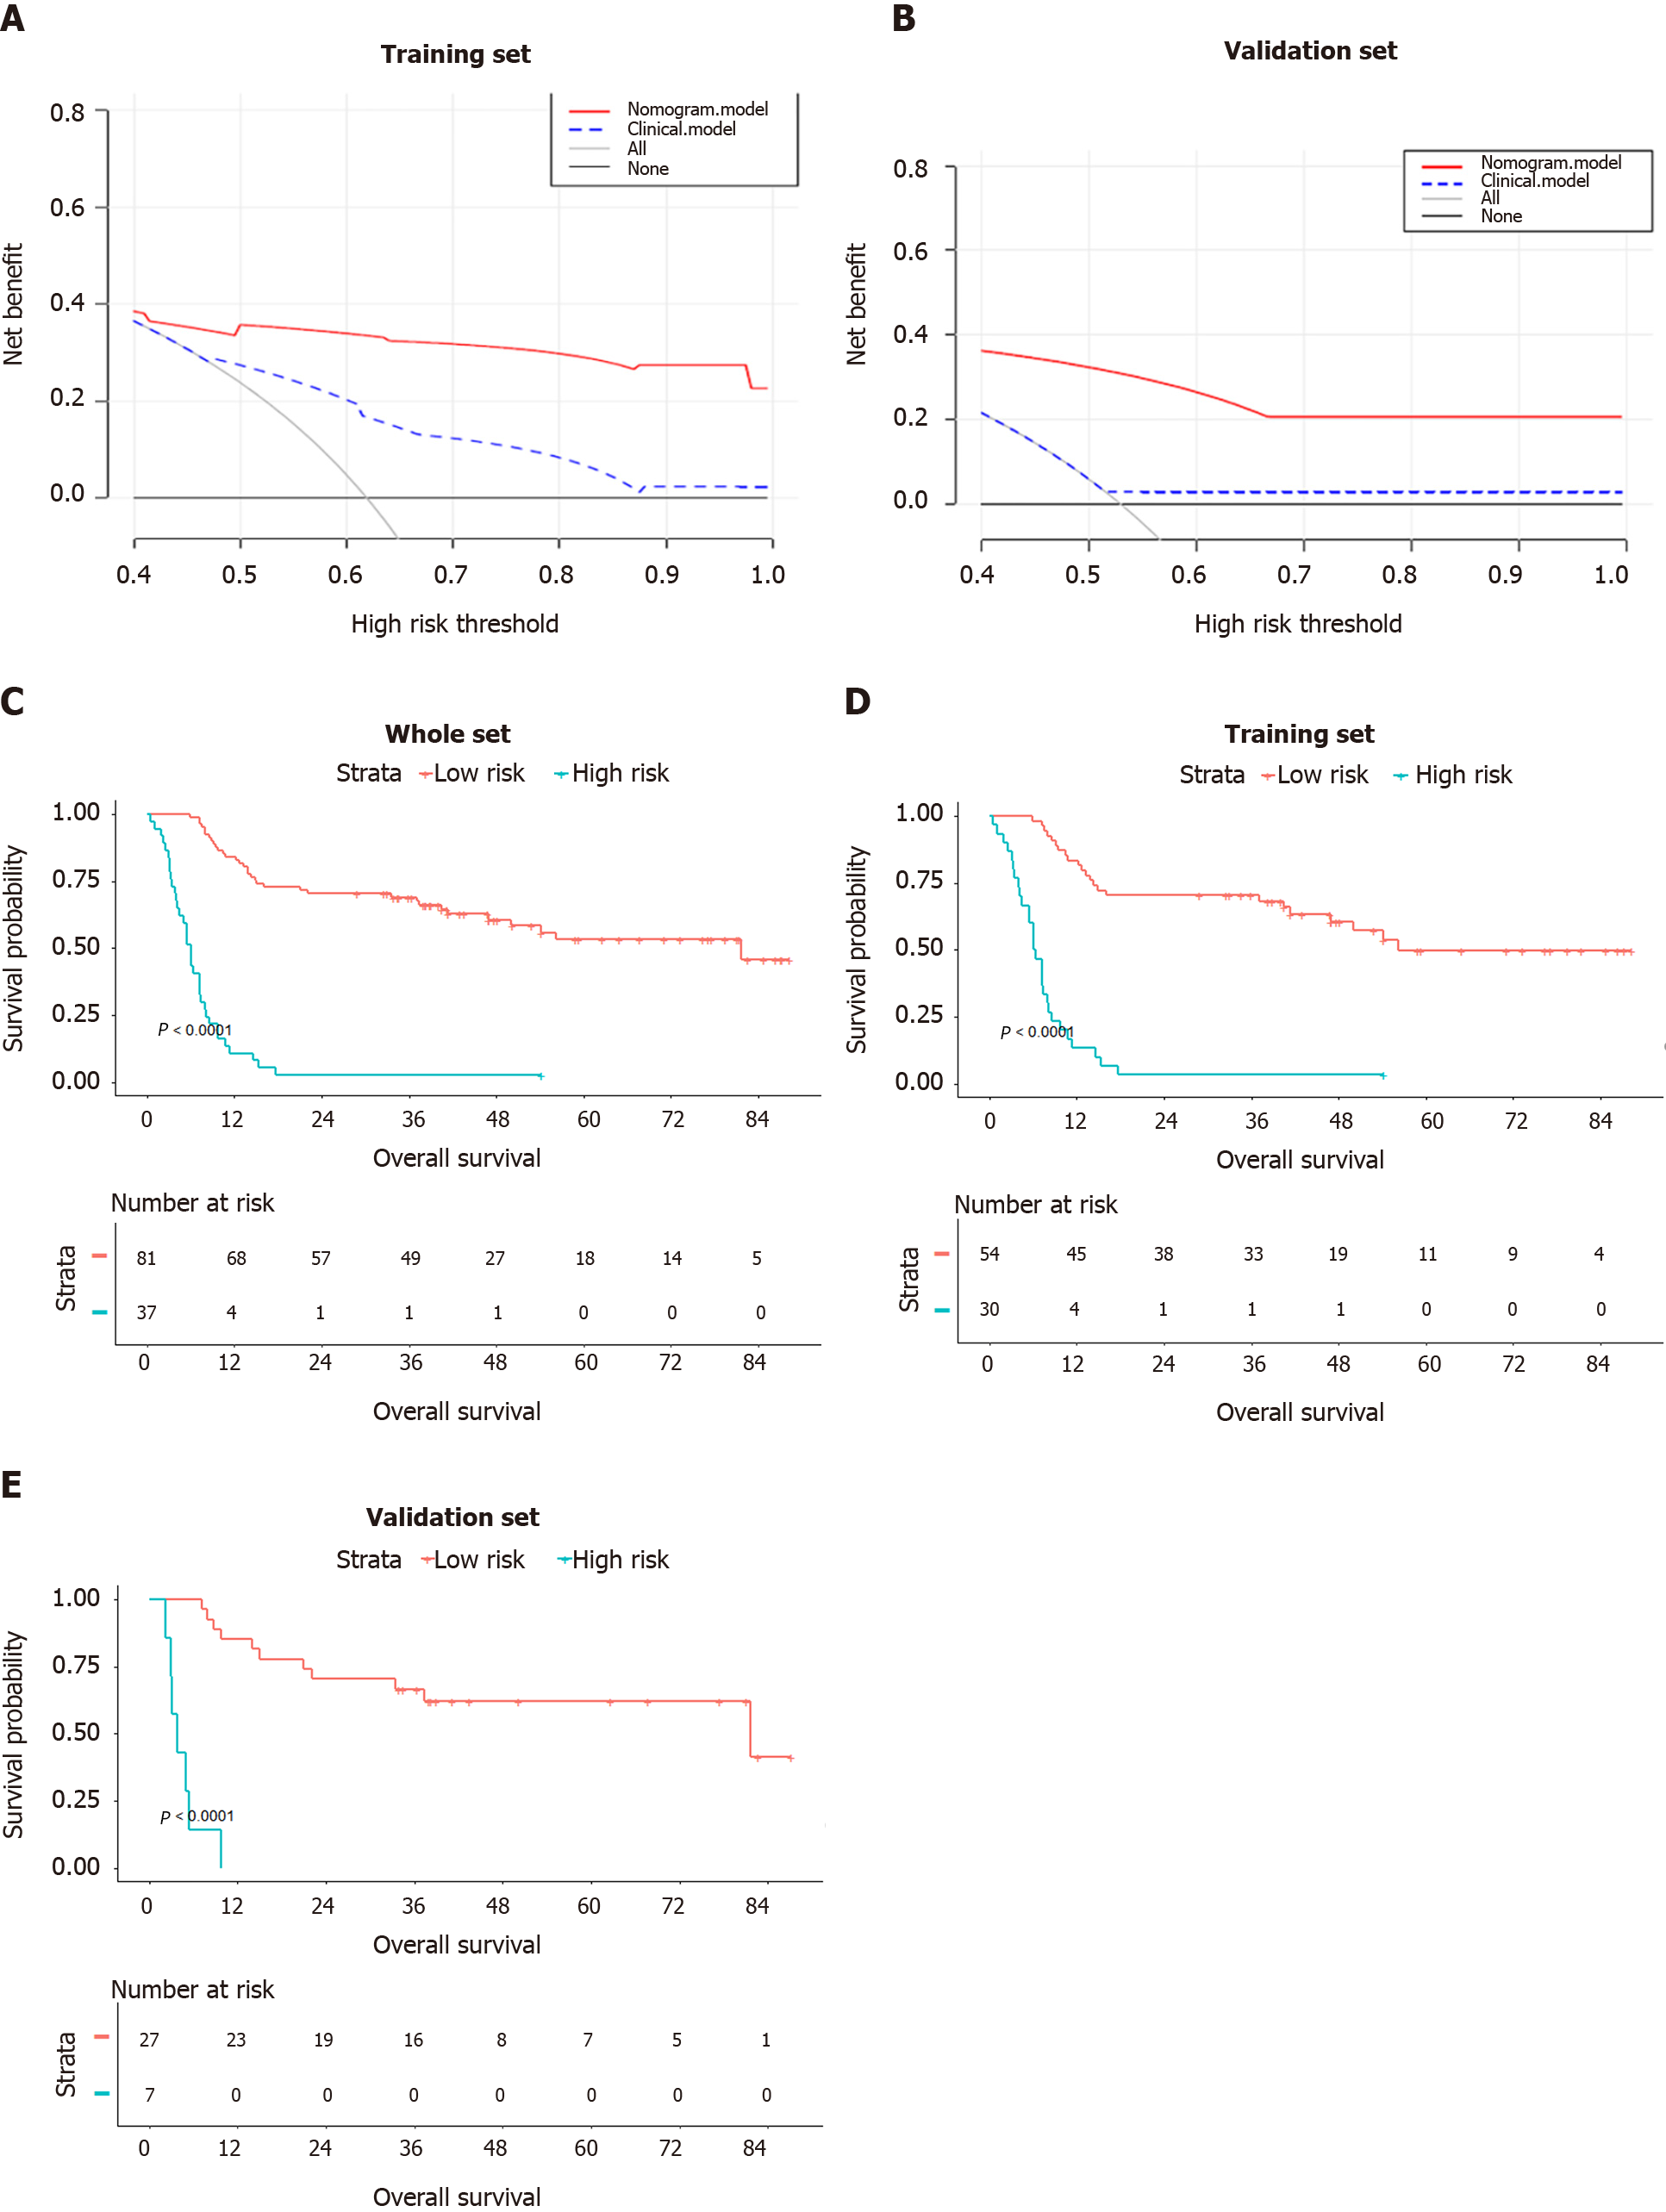
Figure 6 Clinical usefulness of the radiomics nomogram.
A and B: Decision curve analysis assessing the ability of the radiomics nomogram or a model based on four clinical factors to predict overall survival (OS) in the training and validation sets. The y-axis indicates “net benefit”; the red line, the radiomics nomogram; the blue dotted line, the model based on clinical factors; the gray dotted line, the result in the event that all patients died; and the black dotted line, the result in the event that no patient died; C-E: OS comparison between patients classified by the radiomics nomogram as at “low risk” or “high risk” of poor OS; C: All patients; D: The training set; and E: The validation set.
- Citation: Tang YY, Zhao YN, Zhang T, Chen ZY, Ma XL. Comprehensive radiomics nomogram for predicting survival of patients with combined hepatocellular carcinoma and cholangiocarcinoma. World J Gastroenterol 2021; 27(41): 7173-7189
- URL: https://www.wjgnet.com/1007-9327/full/v27/i41/7173.htm
- DOI: https://dx.doi.org/10.3748/wjg.v27.i41.7173


