Copyright
©The Author(s) 2021.
World J Gastroenterol. Nov 7, 2021; 27(41): 7144-7158
Published online Nov 7, 2021. doi: 10.3748/wjg.v27.i41.7144
Published online Nov 7, 2021. doi: 10.3748/wjg.v27.i41.7144
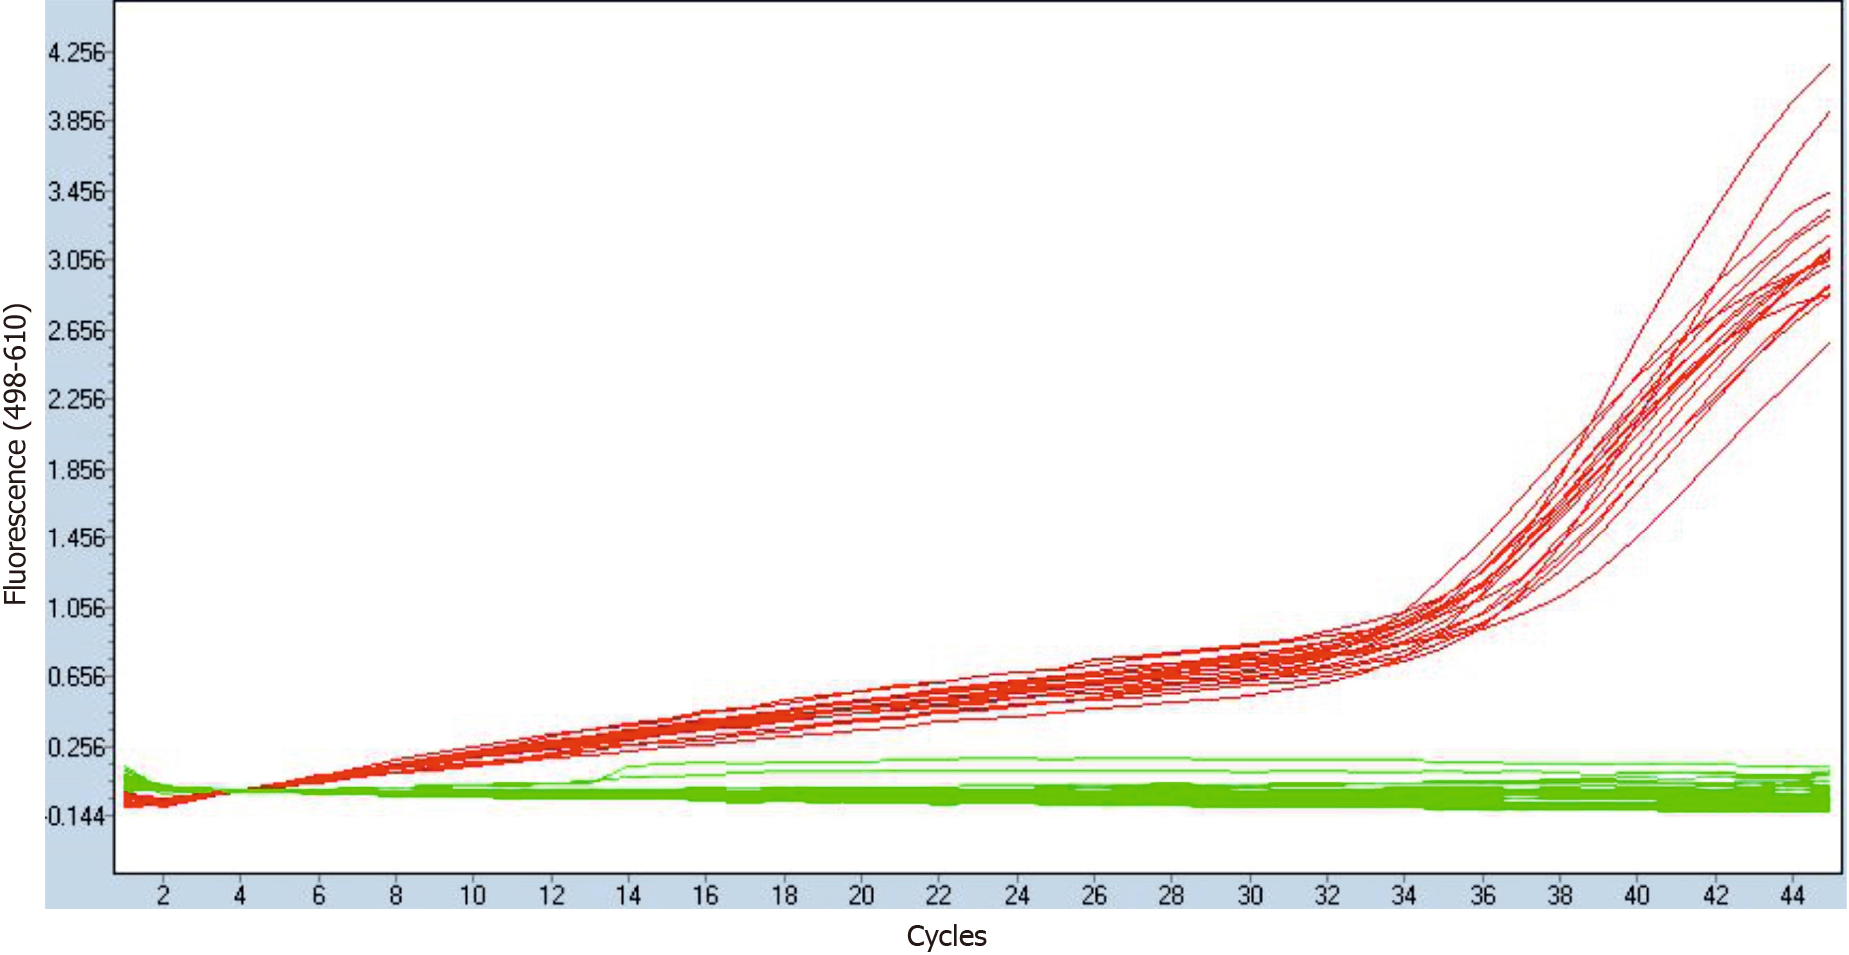
Figure 1 Quantitative polymerase chain reaction verification of residual hepatitis B virus-DNA elimination from hepatitis B virus-RNA isolations after DNAseI treatment.
Fluorescence through quantitative polymerase chain reaction amplification samples is shown as green lines for DNAse I-treated RNA samples, and as red lines for their respective cDNA retrotranscribed samples.
Figure 2 Comparison of mean hepatitis B virus quasispecies complexity.
Hepatitis B virus (HBV) quasispecies complexity analyzed by Rare Haplotype Load of all 13 patients in HBV-DNA quasispecies (blue-framed boxes) and HBV-RNA quasispecies (yellow-framed boxes). Differences were statistically non-significant (P = 0.1641, t test). RHL: Rare Haplotype Load; HBV: Hepatitis B virus.
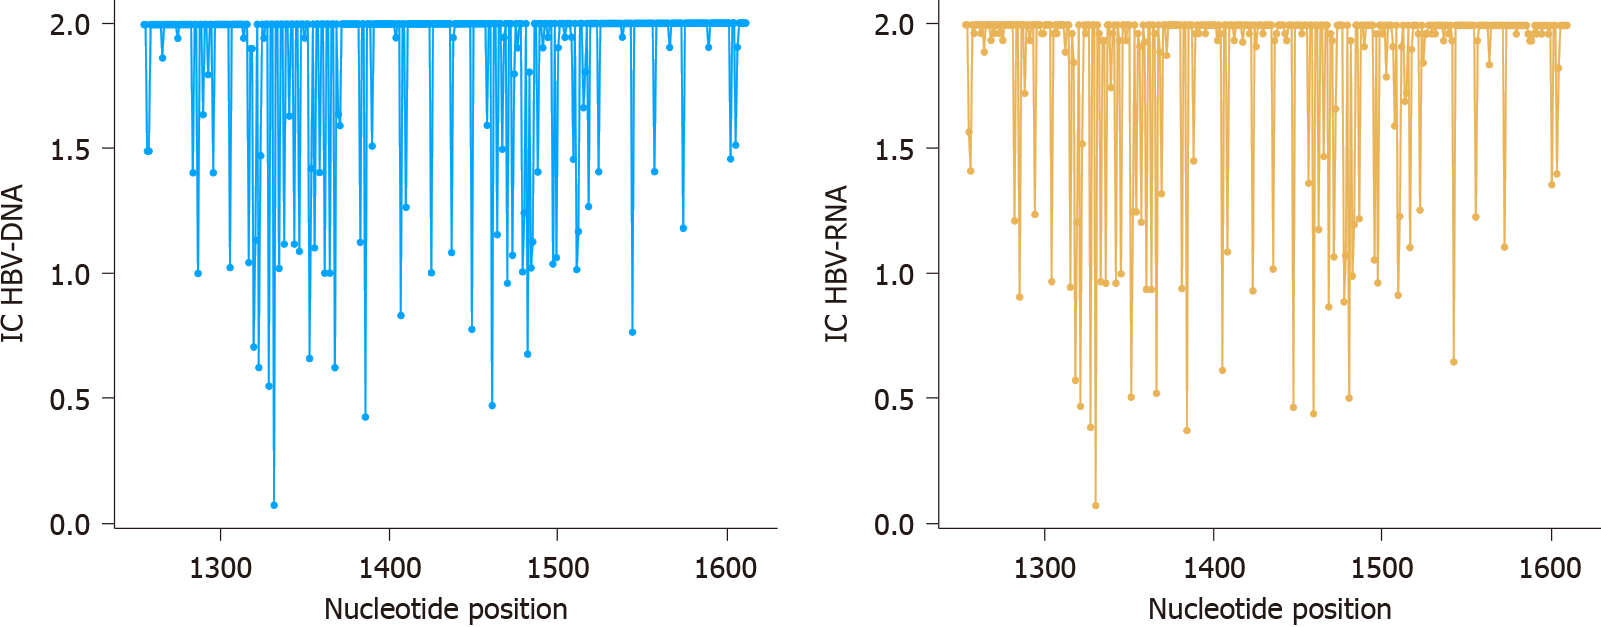
Figure 3 Conservation and variability of 357 nucleotide positions analyzed.
Information content of nucleotide positions from 1255 to 1611 for hepatitis B virus (HBV)-DNA (blue lines) and HBV-RNA (orange lines) quasispecies. IC: Information content; HBV: Hepatitis B virus.
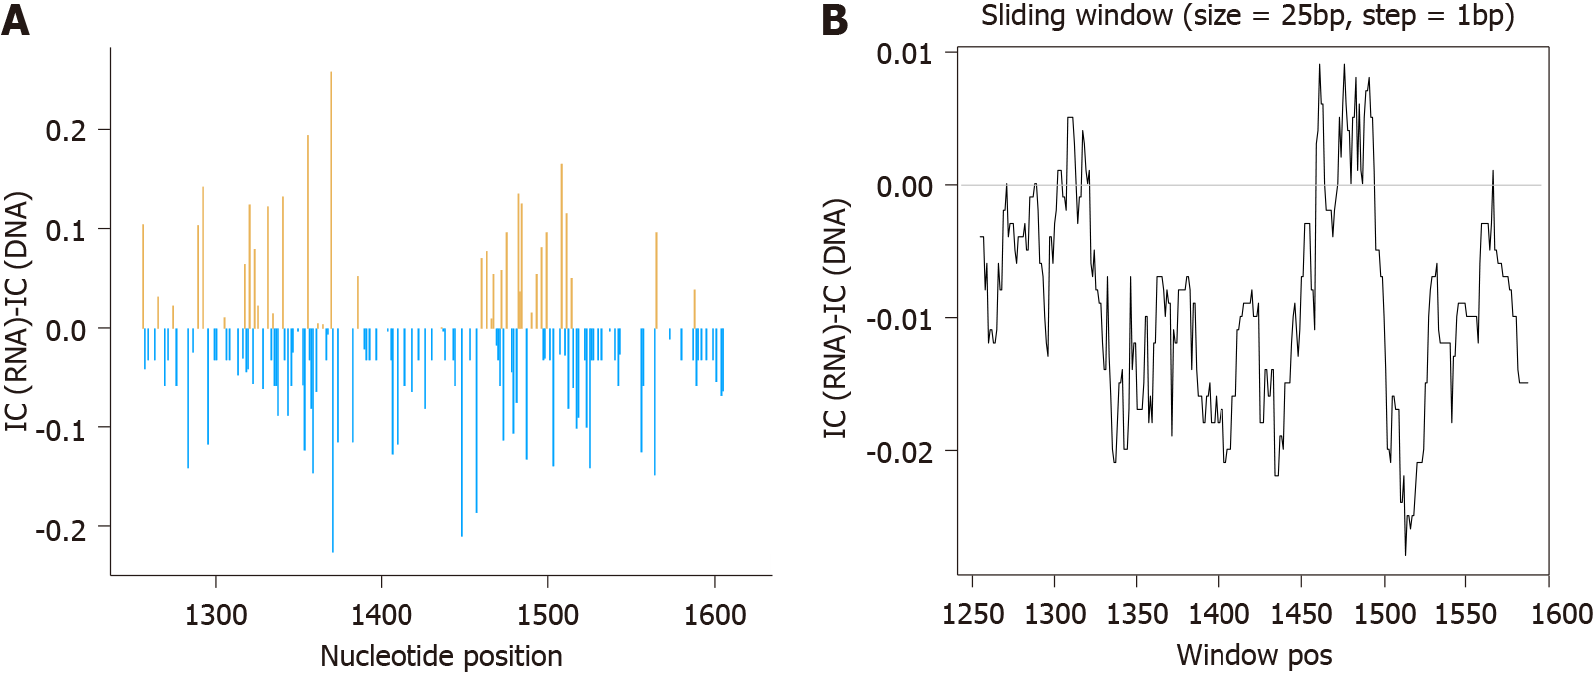
Figure 4 Differences between information content of hepatitis B virus-DNA and RNA quasispecies.
A: Nucleotide positions in which information content (IC) hepatitis B virus (HBV)-RNA > HBV-DNA are depicted in orange while positions where IC HBV-DNA > HBV-RNA in blue; B: Sliding window analysis of the subtraction of mean IC RNA-IC DNA values, in windows of 25 nucleotide positions, displaced in steps of 1 position between them. IC: Information content.
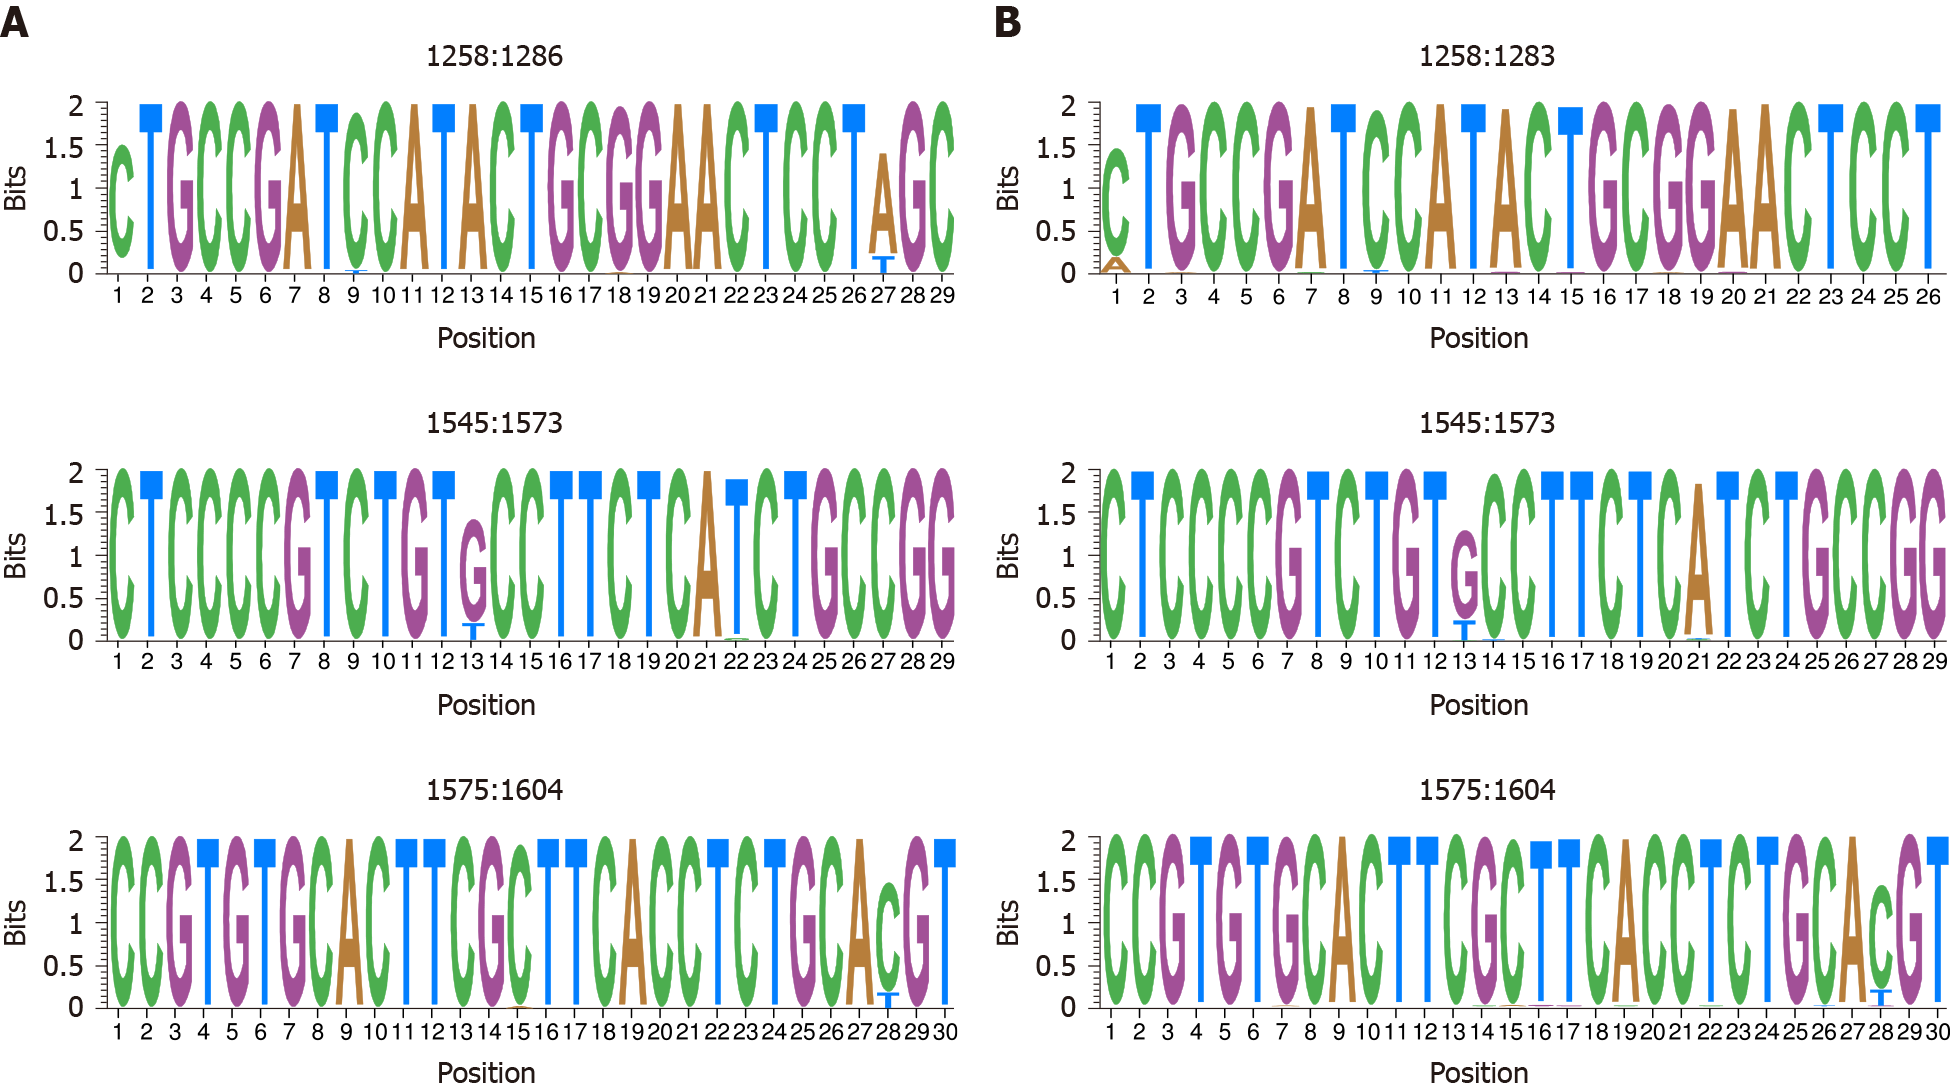
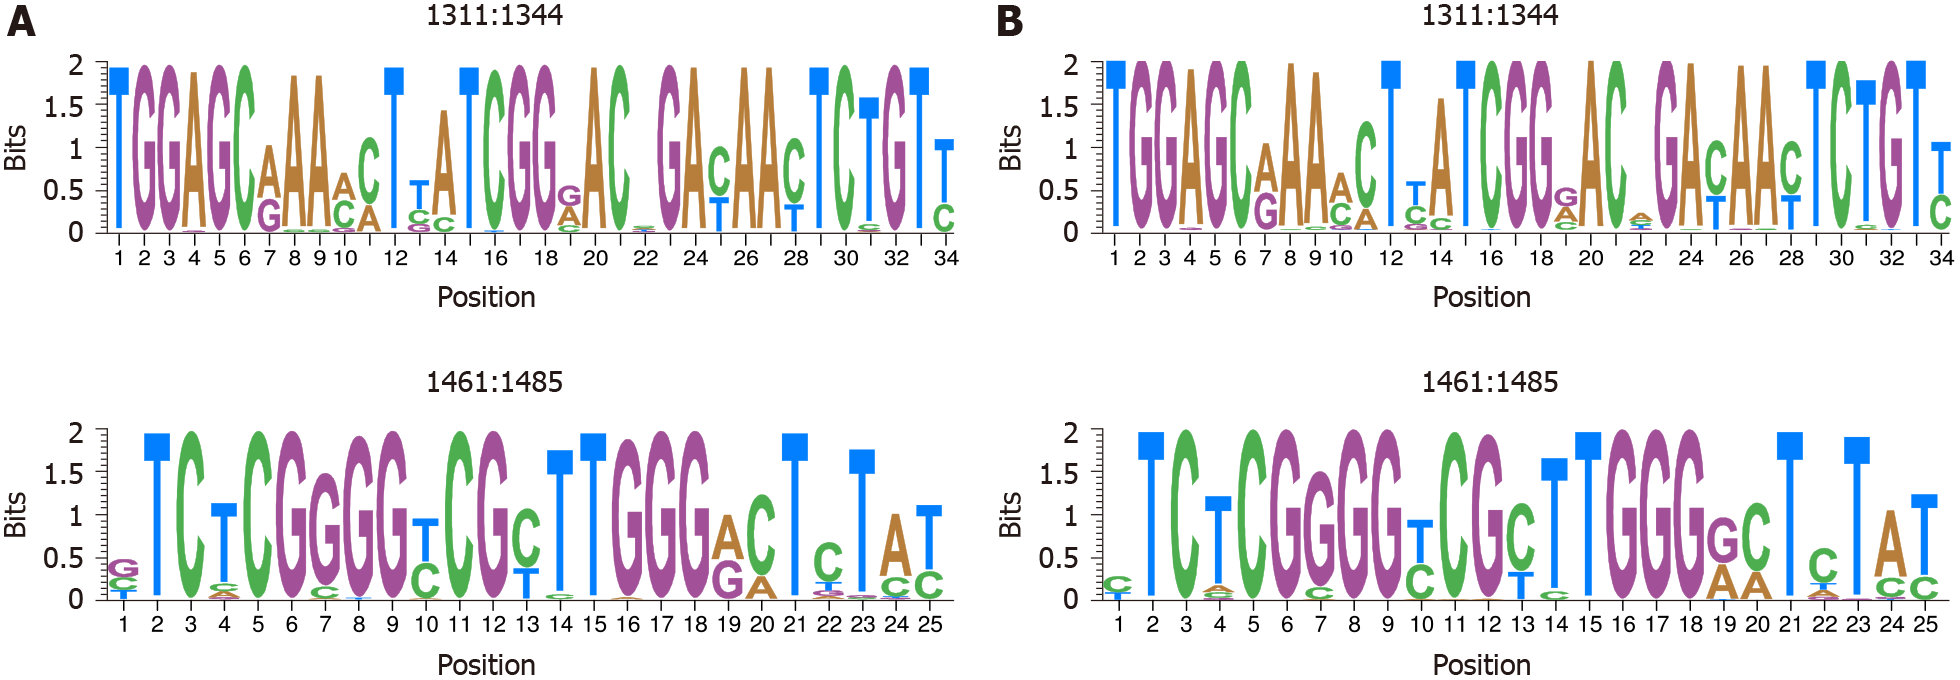
Figure 5 Representation by sequence logos of the information content of the most conserved regions in hepatitis B virus-DNA and hepatitis B virus-RNA quasispecies.
The relative sizes of the letters in each stack, each of them representing a nucleotide (nt) position, indicate their relative frequencies at each position within the multiple alignments of nt haplotypes. The total height of each stack of letters depicts the IC of each nt position, measured in bits (Y-axis), therefore 0 bits is the minimum and 2 the maximum conservation. A: Hepatitis B virus-DNA; B: Hepatitis B virus-RNA.
Figure 6 Representation by sequence logos of the information content of the most variable regions in hepatitis B virus-DNA and hepatitis B virus-RNA quasispecies.
The relative sizes of the letters in each stack, each of them representing a nucleotide (nt) position, indicate their relative frequencies at each position within the multiple alignments of nt haplotypes. The total height of each stack of letters depicts the IC of each nt position, measured in bits (Y-axis), therefore 0 bits is the minimum and 2 the maximum conservation. A: Hepatitis B virus-DNA; B: Hepatitis B virus-RNA.
- Citation: Garcia-Garcia S, Cortese MF, Tabernero D, Gregori J, Vila M, Pacín B, Quer J, Casillas R, Castillo-Ribelles L, Ferrer-Costa R, Rando-Segura A, Trejo-Zahínos J, Pumarola T, Casis E, Esteban R, Riveiro-Barciela M, Buti M, Rodríguez-Frías F. Cross-sectional evaluation of circulating hepatitis B virus RNA and DNA: Different quasispecies? World J Gastroenterol 2021; 27(41): 7144-7158
- URL: https://www.wjgnet.com/1007-9327/full/v27/i41/7144.htm
- DOI: https://dx.doi.org/10.3748/wjg.v27.i41.7144


