Copyright
©The Author(s) 2021.
World J Gastroenterol. Oct 28, 2021; 27(40): 6908-6926
Published online Oct 28, 2021. doi: 10.3748/wjg.v27.i40.6908
Published online Oct 28, 2021. doi: 10.3748/wjg.v27.i40.6908
Figure 1 Glucose transporter 1 expression is correlated with liver fibrosis progression.
A-D: The classic mouse model of CCl4-induced liver fibrosis was used to first clarify whether glucose transporter 1 (GLUT1) is related to liver fibrosis. Sirius red staining and alpha-smooth muscle actin (α-SMA) immunohistochemical (IHC) staining were used to confirm that the liver fibrosis model was successfully established, and then the mice were randomly divided into the CCl4 group and the control oil group (n = 6-10 mice/group) (A); Evaluation of liver fibrosis using Sirius red staining (B); Determination of the area ratio of positive IHC staining for α-SMA in the mouse CCl4-induced liver fibrosis model (C); GLUT1 expression was more abundant in the liver tissue samples from the model group (D); E and F: Immunofluorescence staining for GLUT1 (red) and α-SMA (green) in the CCl4 model. Cell nuclei were counterstained with DAPI. Scale bar for immunofluorescence staining, 200 μm; scale bars for IHC staining and Sirius red staining, 200 μm; G: IHC staining for α-SMA and GLUT1 in the healthy control and liver fibrosis groups (scale bar, 100 μm); H: Western blot analysis of changes in GLUT1 protein levels in the oil group and the CCl4 model group; I: Western blot analysis of GLUT1 protein expression in human liver tissues from the healthy control group and the liver fibrosis group. Data in B-D, G and H are presented as the mean ± SE. Statistically significant differences were detected (compared with the oil group, aP < 0.05 and bP < 0.01; compared with the healthy control group, dP < 0.05). GLUT1: Glucose transporter 1; α-SMA: Alpha-smooth muscle actin.
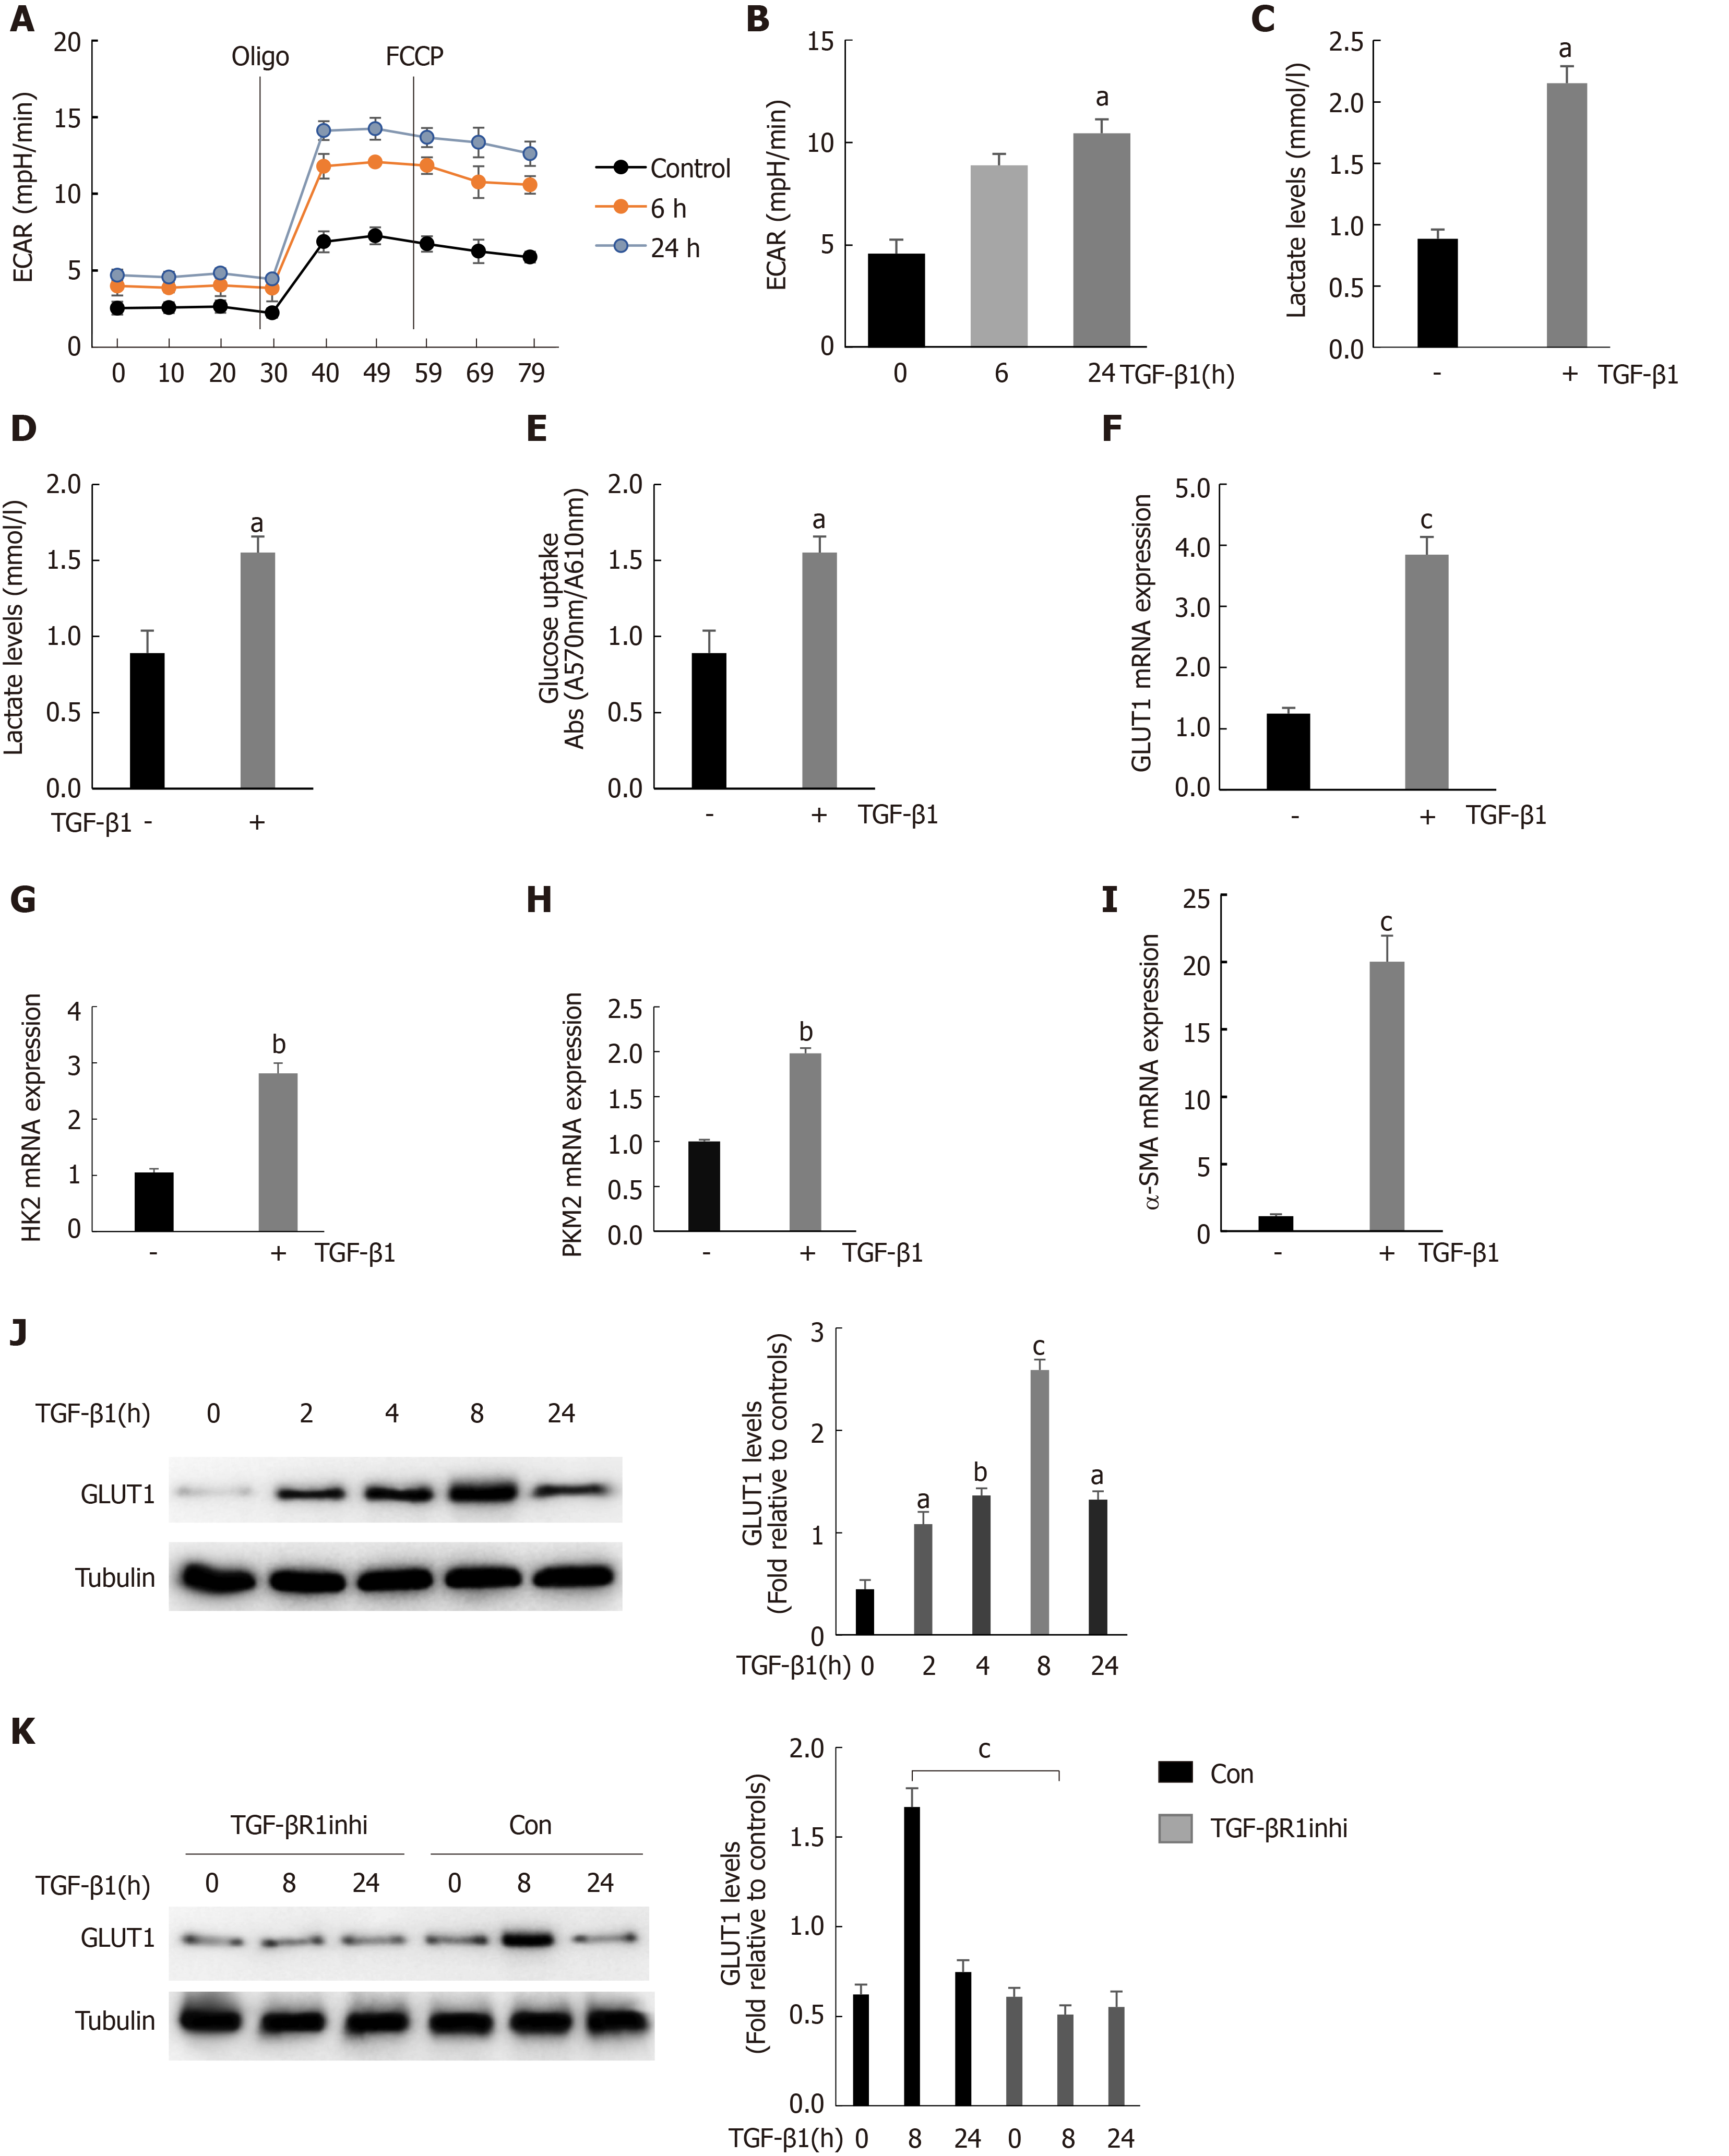
Figure 2 Stimulation of hepatic stellate cells with transforming growth factor-β1 induces glucose transporter 1 expression and promotes glycolysis.
A: Serum-starved (for 20 h) primary mouse hepatic stellate cells (HSCs) were seeded into Seahorse XF-24 cell culture microplates (5 × 10⁴ cells/well). The cells were first treated with transforming growth factor-β1 (TGF-β1) (3 ng/mL) for 0, 6 or 24 h, followed by sequential treatment with oligomycin (Oligo) and carbonyl cyanide 4-(trifluoromethoxy)phenylhydrazone (FCCP). The extracellular acidification rate (ECAR) was recorded in real time; B: The basic ECAR. n = 6; the mean ± SE; aP < 0.05 compared to the level before TGF-β1 treatment (0 h); unpaired t test; C and D: Mouse HSCs were treated with or without TGF-β1 (3 ng/mL) for 24 h. The cells were then lysed, and the lactic acid contents in the cell lysate (C) and the culture medium (D) were examined; E: Determination of glucose consumption in the culture medium; F-I: Mouse HSCs were treated with or without TGF-β1 (3 ng/mL) for 24 h. RNA was purified, and RT-PCR was performed to examine the expression levels of glucose transporter 1 (GLUT1) (F), HK-2 (G), PKM-2 (H) and α-SMA (I), n = 5, the mean ± SE; aP < 0.05, bP < 0.01 and cP < 0.001 compared with those at 0 h or those in the TGF-β1-untreated group; one-way analysis of variance (ANOVA); J: Western blot analysis of the expression levels of GLUT1 and tubulin at various time points after HSCs were treated with TGF-β1 (3 ng/mL); K: Examination of the changes in GLUT1 and tubulin levels after sequential treatment with a type 1 TGF-β receptor inhibitor (LY2109761, 2 μm) for 1 h and then with TGF-β1 (3 ng/mL) for 0, 8 or 24 h. All experiments shown in A-E and F-I were performed 2-3 times. Inhi: Inhibitor; Con: Control; FCCP: Carbonyl cyanide 4-(trifluoromethoxy)phenylhydrazone; ECAR: Extracellular acidification rate; GLUT1: Glucose transporter 1; TGF-β1: Transforming growth factor-β1.
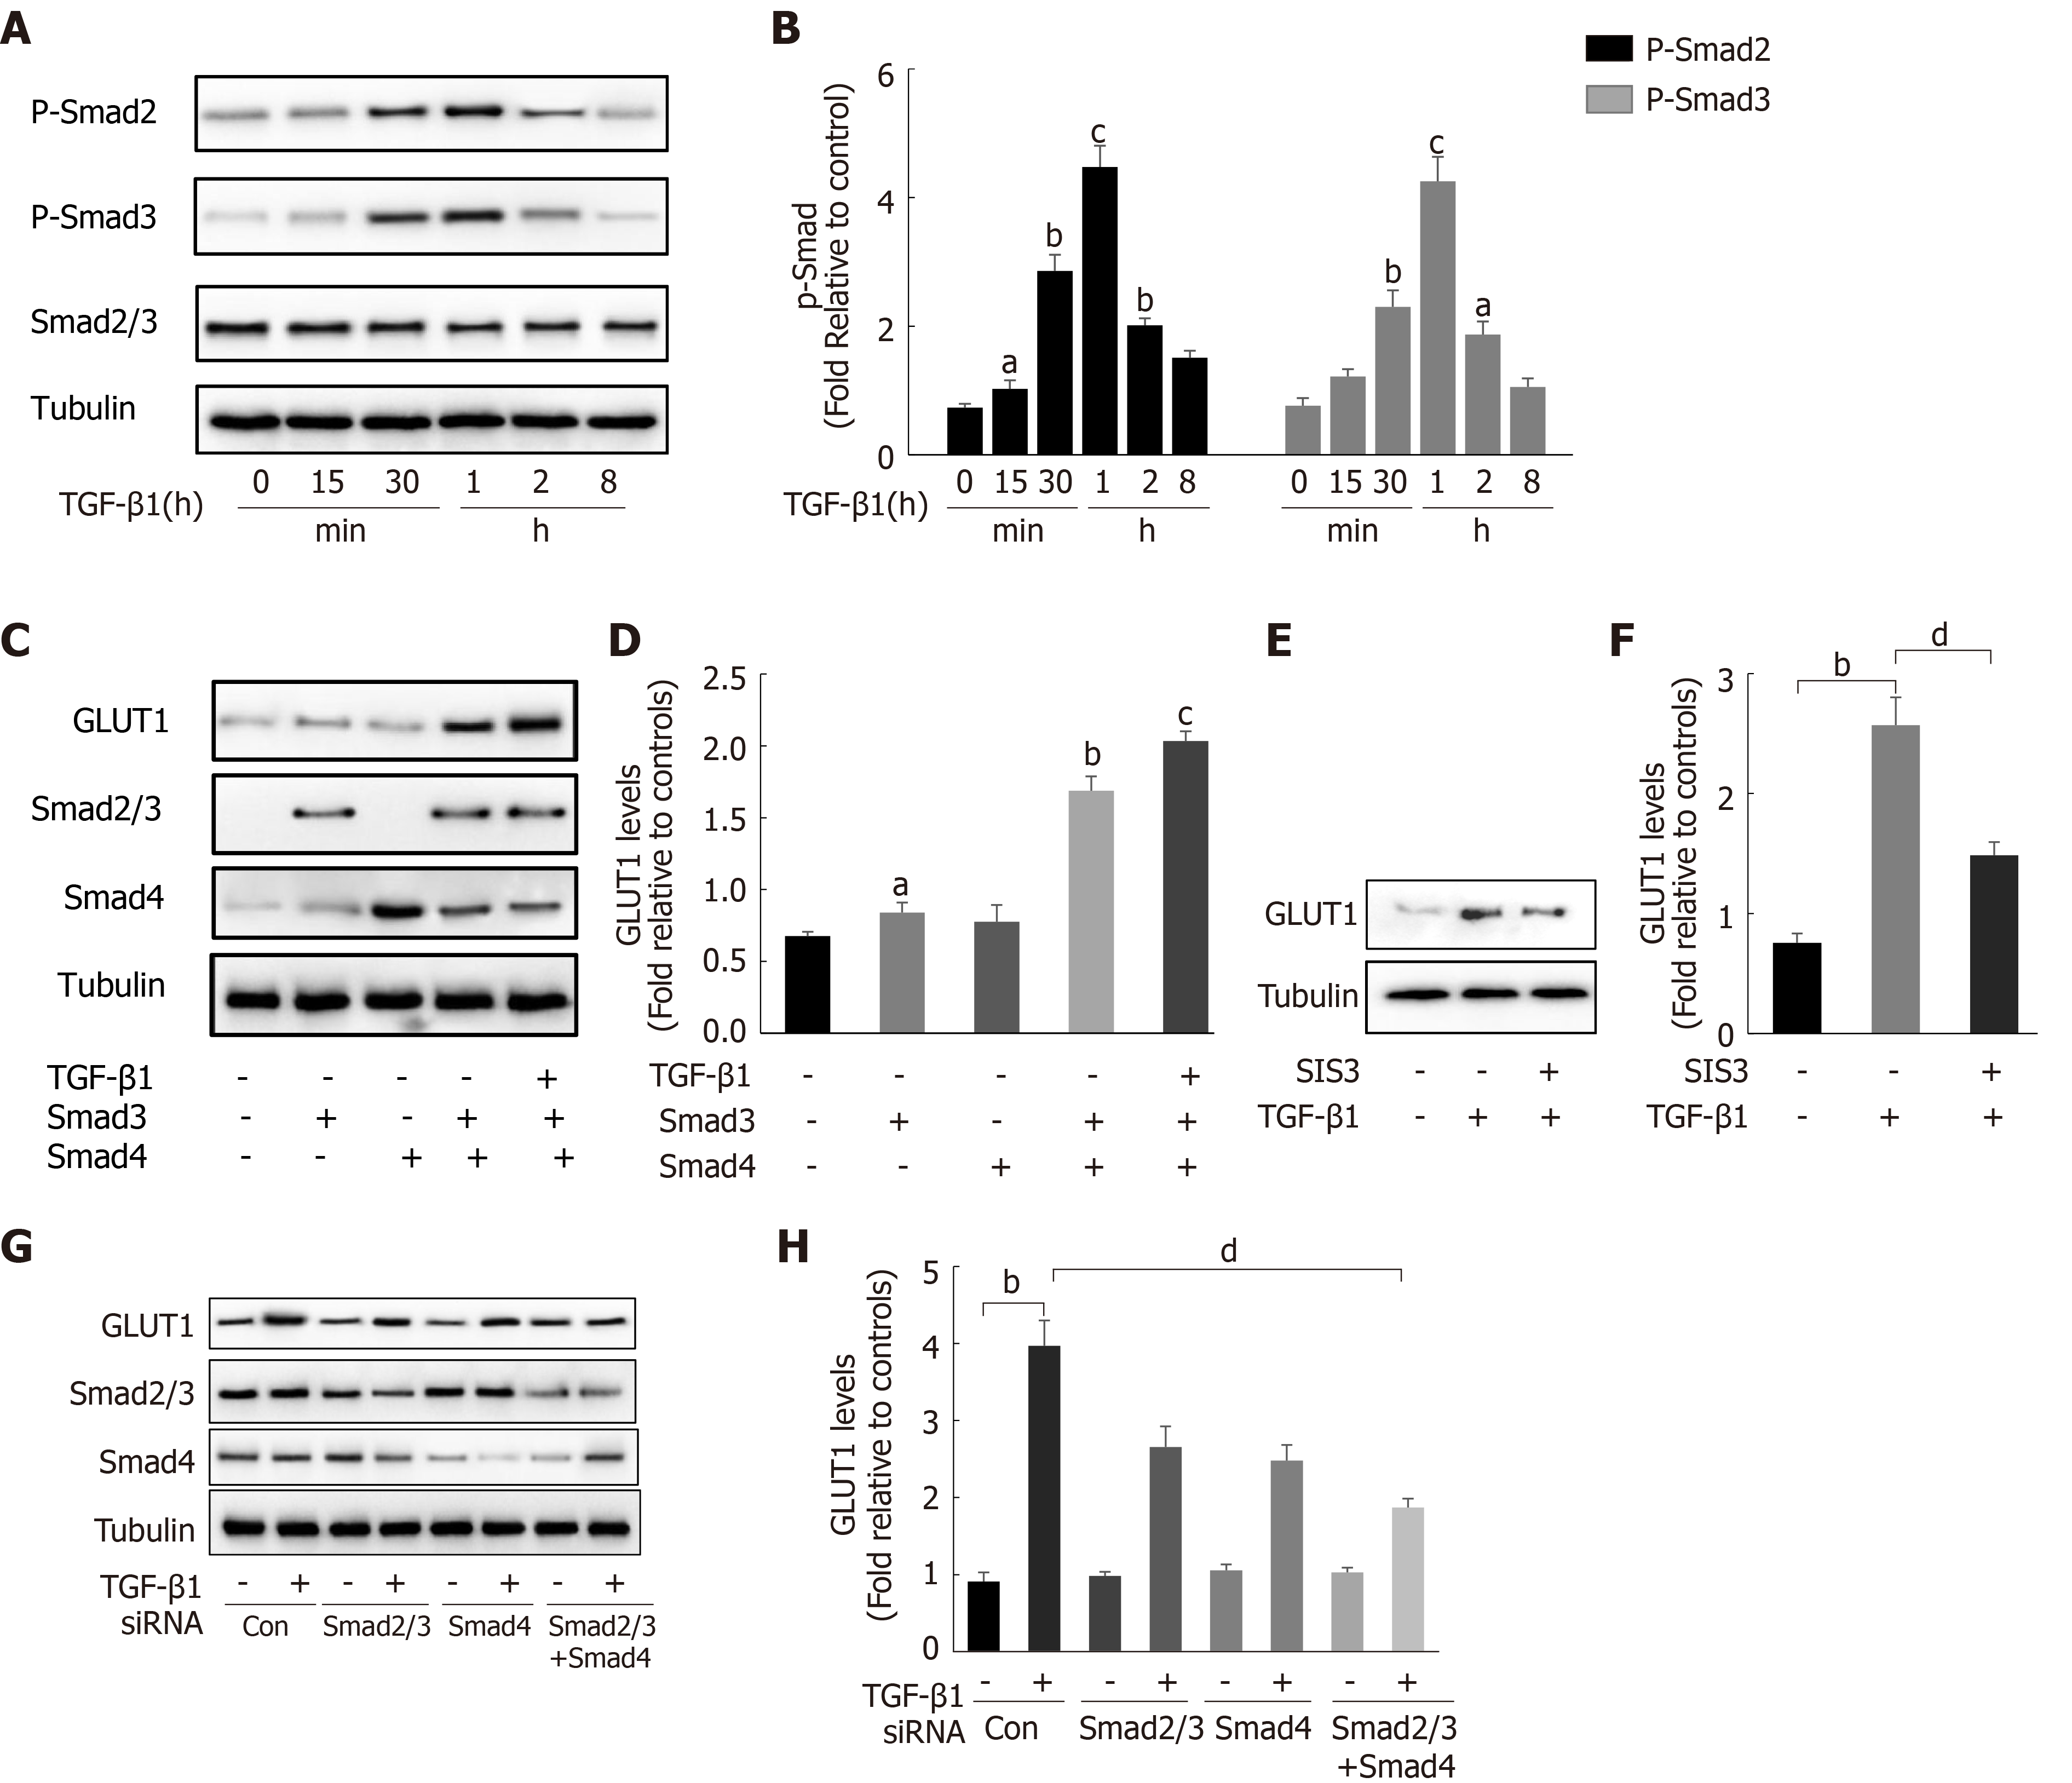
Figure 3 Transforming growth factor-β1 induces glucose transporter 1 expression through the Smad pathway.
A and B: Serum-starved (for 20 h) primary mouse hepatic stellate cells (HSCs) were treated with transforming growth factor-β1 (TGF-β1) (3 ng/mL) and examined at various time points. Western blot analysis using specific antibodies (A). Quantitative analysis of the levels of the p-Smad2 and p-Smad3 proteins in five independent experiments (B); C and D: After transiently transfecting HSCs with 2 μg of Smad3 and/or Smad4 expression plasmids, the cells were cultured in serum-free medium for 48 h and then treated with TGF-β1 (3 ng/mL) for 4 h. Green fluorescent protein (GFP) was used as a transfection control. Western blot analysis using specific antibodies (C). Quantitative analysis of glucose transporter 1 (GLUT1) protein expression in five independent experiments (D); E and F: HSCs were first pretreated with a Smad3 inhibitor (SIS3, 20 μm) for 1 h and then treated with TGF-β1 (3 ng/mL) for 4 h. Western blot analysis using specific antibodies (E). Quantitative analysis of the GLUT1 protein level in five independent experiments (F); G and H: Mouse primary HSCs were transfected with 20 μmol/L control small interfering RNAs (siRNAs) or siRNAs targeting Smad2/3 and Smad4. After transfection in serum-free medium for 48 h, the cells were treated with TGF-β1 (3 ng/mL) for 4 h. Western blot analysis using specific antibodies (G). Quantitative analysis of the GLUT1 protein level in five independent experiments (H) (the mean ± SE; aP < 0.05, bP < 0.01 and cP < 0.001 compared with that in the group of cells without TGF-β1; dP < 0.05 for the comparison of the groups treated with TGF-β1 and the groups treated with TGF-β1 and different additional reagents; Student’s t test). GLUT1: Glucose transporter 1; TGF-β1: Transforming growth factor-β1; Con: Control; siRNAs: Small interfering RNAs.
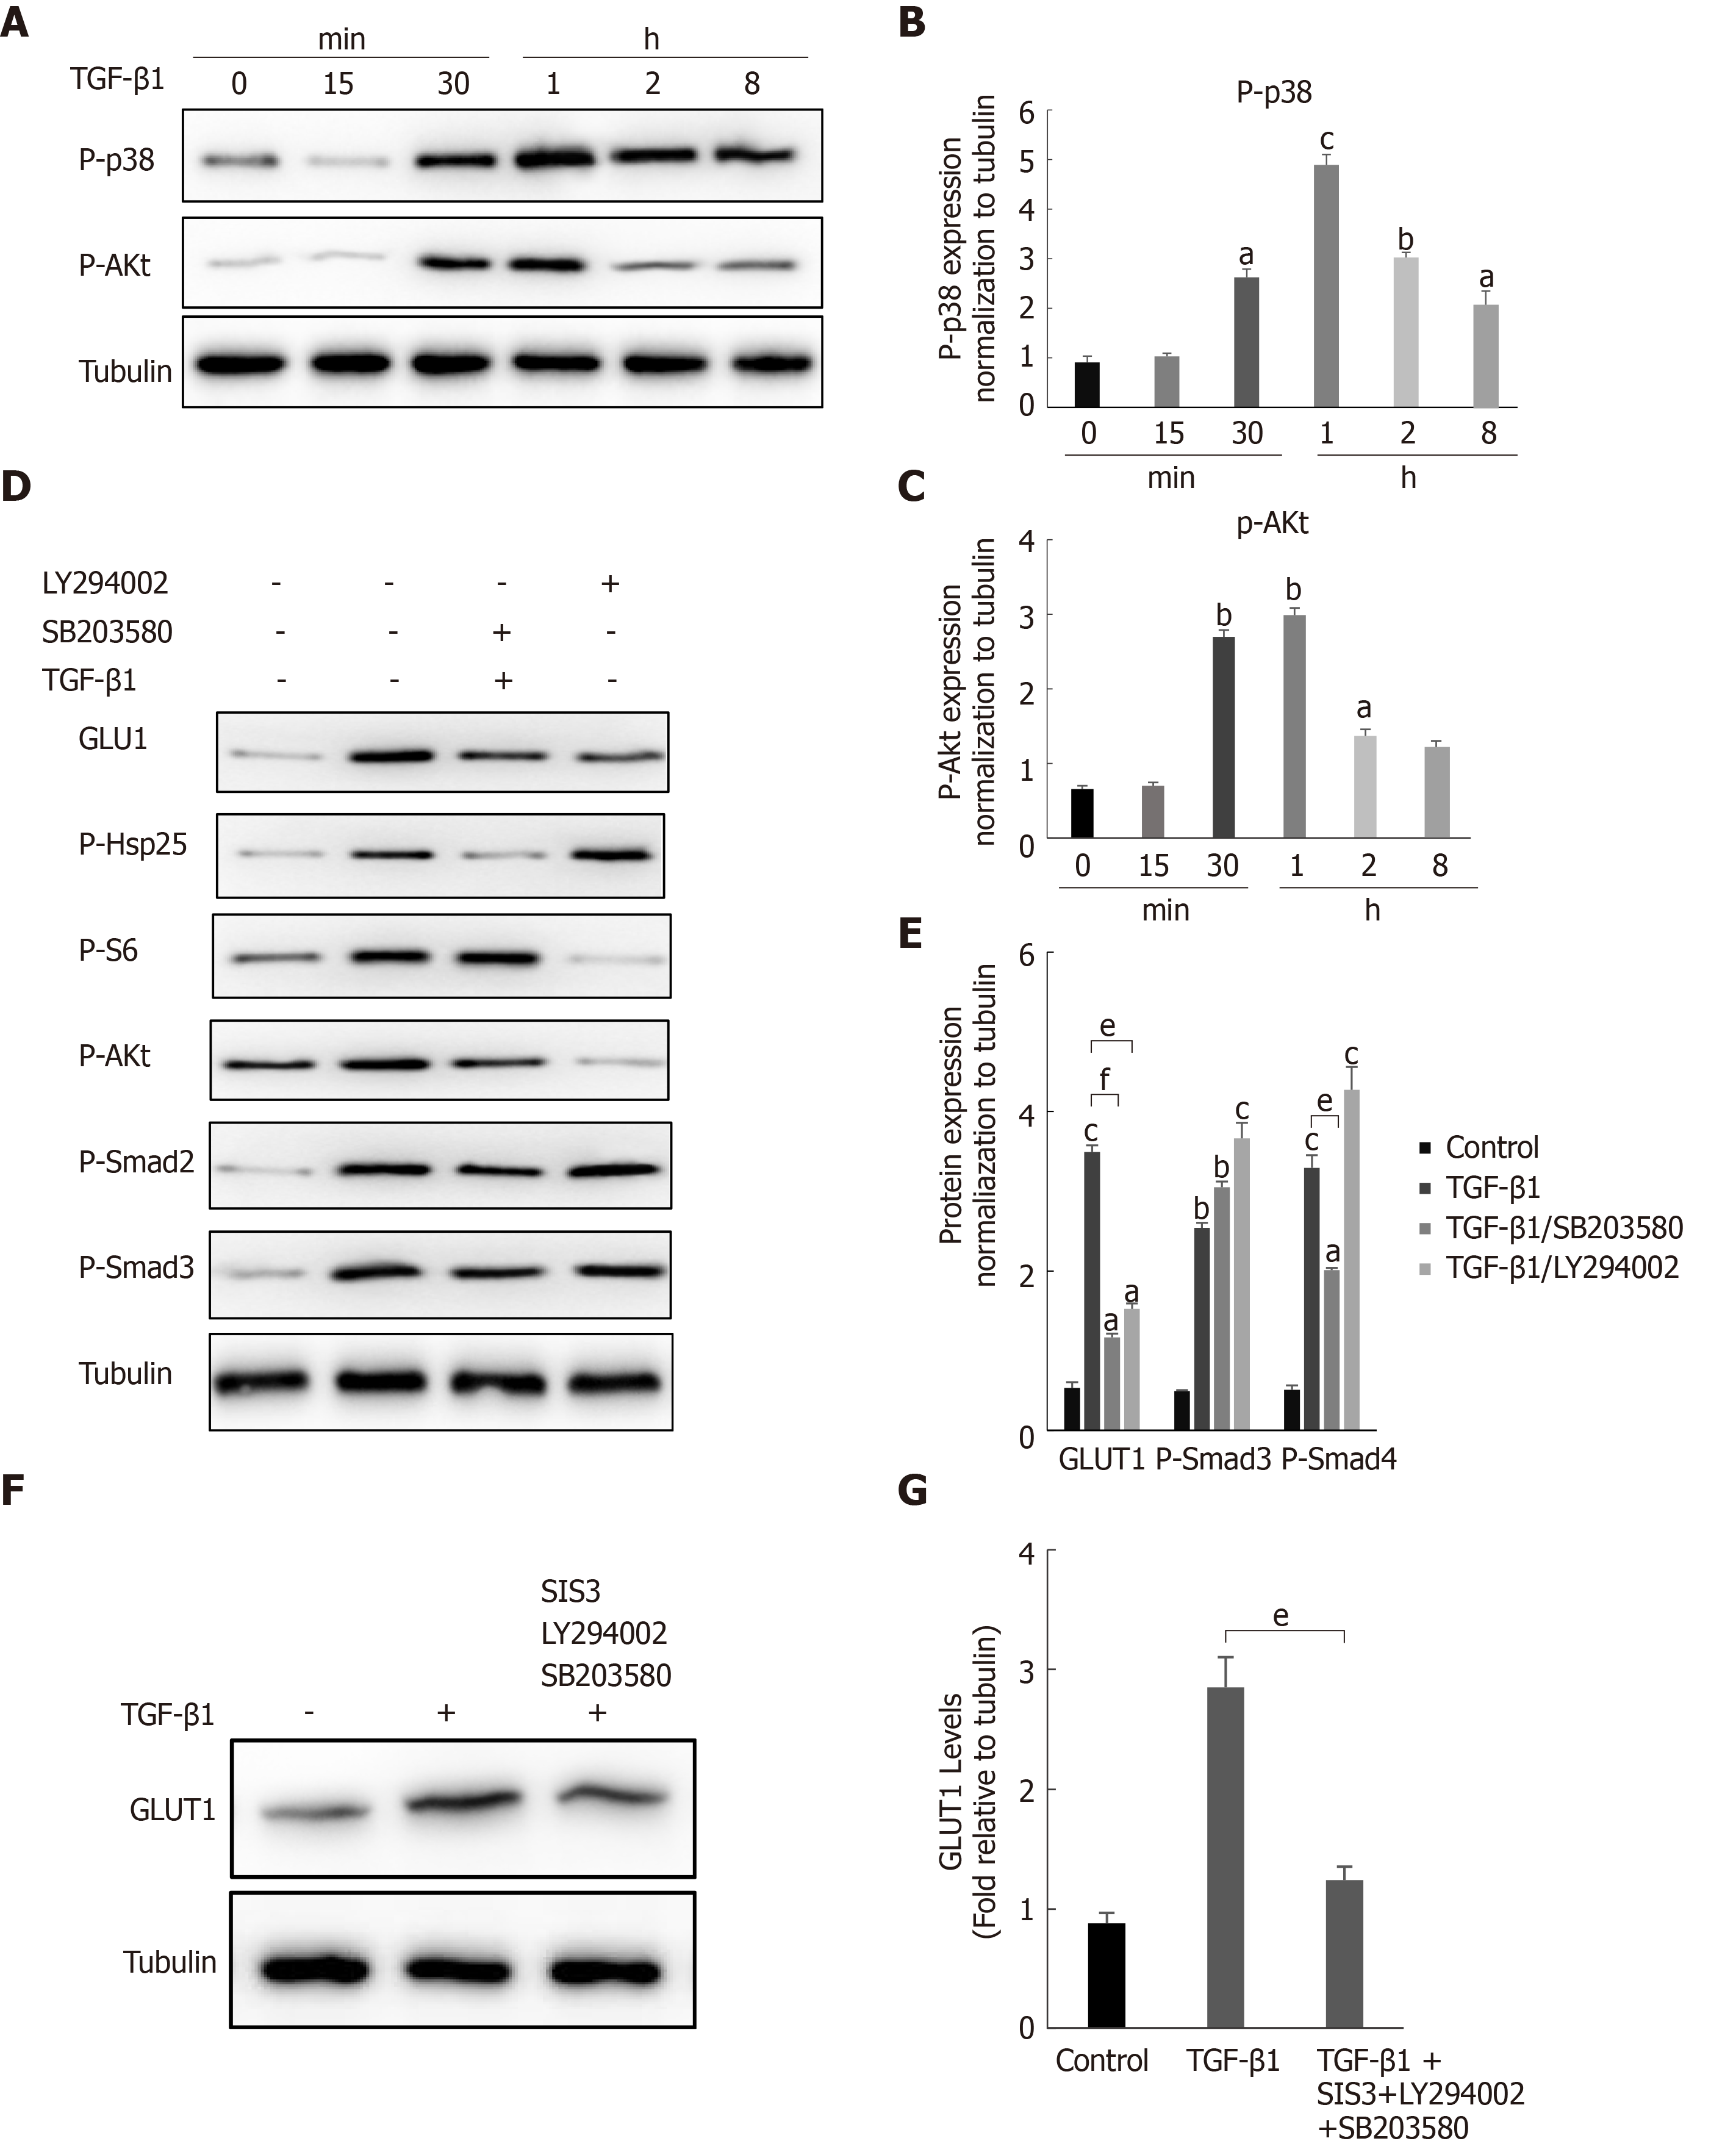
Figure 4 The noncanonical p38 MAPK and PI3K/AKT signaling pathways are also involved in transforming growth factor-β1-mediated glucose transporter 1 expression.
A-C: Serum-starved (for 20 h) primary mouse hepatic stellate cells (HSCs) were treated with transforming growth factor-β1 (TGF-β1) (3 ng/mL) and examined at different time points. Western blot analysis using specific antibodies (A). Five independent experiments were performed to quantitatively analyze the levels of phosphorylated p38 (B) MAPK and AKT (C); D and E: HSCs cultured in serum-free medium were pretreated with the p38 MAPK inhibitor SB203580 (10 μm) or the PI3K inhibitor LY294002 (10 μm) for 1 h and then treated with TGF-β1 (3 ng/mL) for 4 h. Western blot analysis using specific antibodies (D). Quantitative analysis of the levels of glucose transporter 1 (GLUT1) and phosphorylated Smad2 and Smad3 proteins (E); F and G: HSCs cultured in serum-free medium were pretreated with the p38 MAPK inhibitor SB203580 (10 μm), the PI3K inhibitor LY294002 (10 μm) and the Smad inhibitor SIS3 (20 μm) for 1 h and then treated with TGF-β1 (3 ng/mL) for 4 h. Western blot analysis using specific antibodies (F). Quantitative analysis of the GLUT1 protein level (G) (the mean ± SE; aP < 0.05, bP < 0.01 and cP < 0.001 compared with the TGF-β1-treated group or the TGF-β1-untreated group, dP < 0.05, eP < 0.01 and fP < 0.001 for the comparison of the group treated with TGF-β1 and the groups treated with TGF-β1 and the corresponding inhibitors; Student’s t test). GLUT1: Glucose transporter 1; TGF-β1: Transforming growth factor-β1.
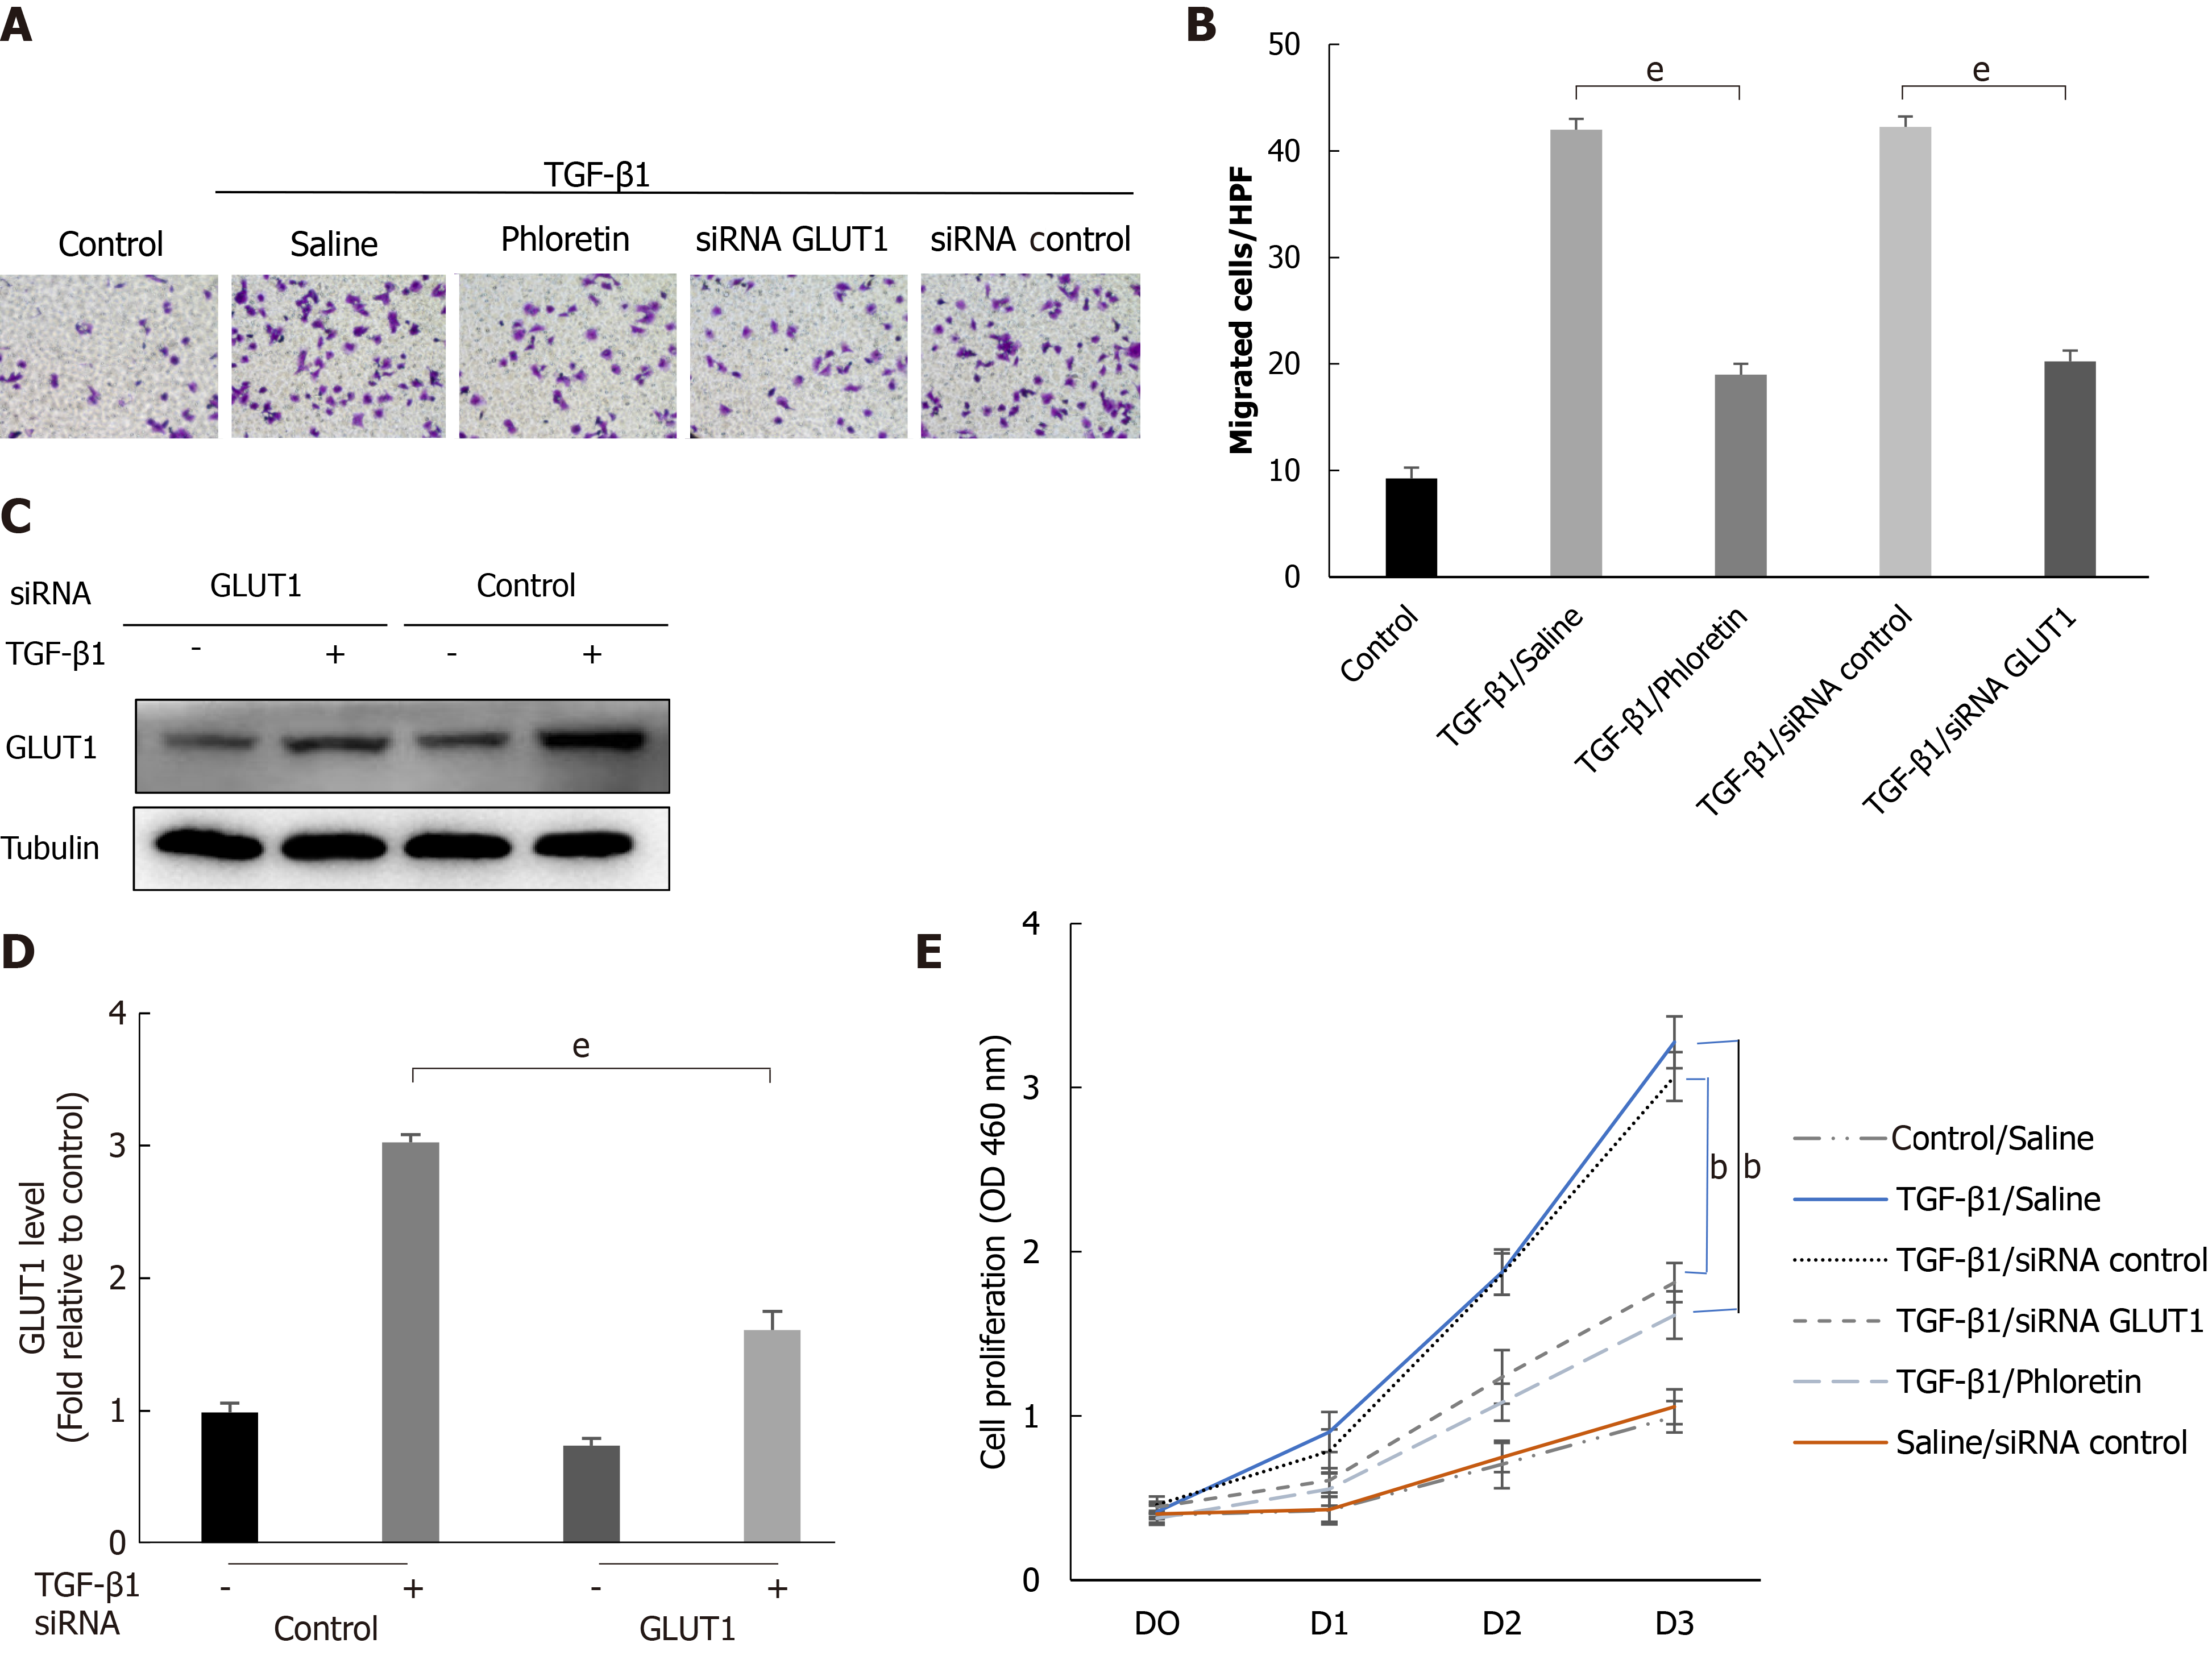
Figure 5 The effect of glucose transporter 1 on the growth and proliferation of hepatic stellate cell.
Mouse primary hepatic stellate cells (HSCs) were 1) pretreated with the glucose transporter 1 (GLUT1) inhibitor phloretin (50 μm) for 30 min and then treated with transforming growth factor-β1 (TGF-β1) (3 ng/mL) for 4 h or 2) transiently transfected with small interfering RNAs that inhibited GLUT1 expression, cultured in serum-free medium for 24 h and then treated with TGF-β1 (3 ng/mL) for 4 h. A: Cells were seeded in serum-free medium (4 × 10⁵ cells/well) in the upper chambers of a Transwell system. The lower chambers were filled with 5% glucose medium (700 μL per well). Changes in cell migration were observed. Representative images of crystal violet staining are shown; B: Quantitative data showing the number of migrating cells in each group; C: Western blot analysis using specific antibodies; D: Quantitative analysis of GLUT1 protein expression in three independent experiments; E: The effect of GLUT1 inhibition on the growth/proliferation of HSCs (mean ± SE; bP < 0.01 and cP < 0.001 compared with the group without TGF-β1; eP < 0.01 for the comparison of the TGF-β1-treated group with the groups subjected to TGF-β1 treatment and different interventions; Student’s t test). GLUT1: Glucose transporter 1; TGF-β1: Transforming growth factor-β1; siRNAs: Small interfering RNAs.
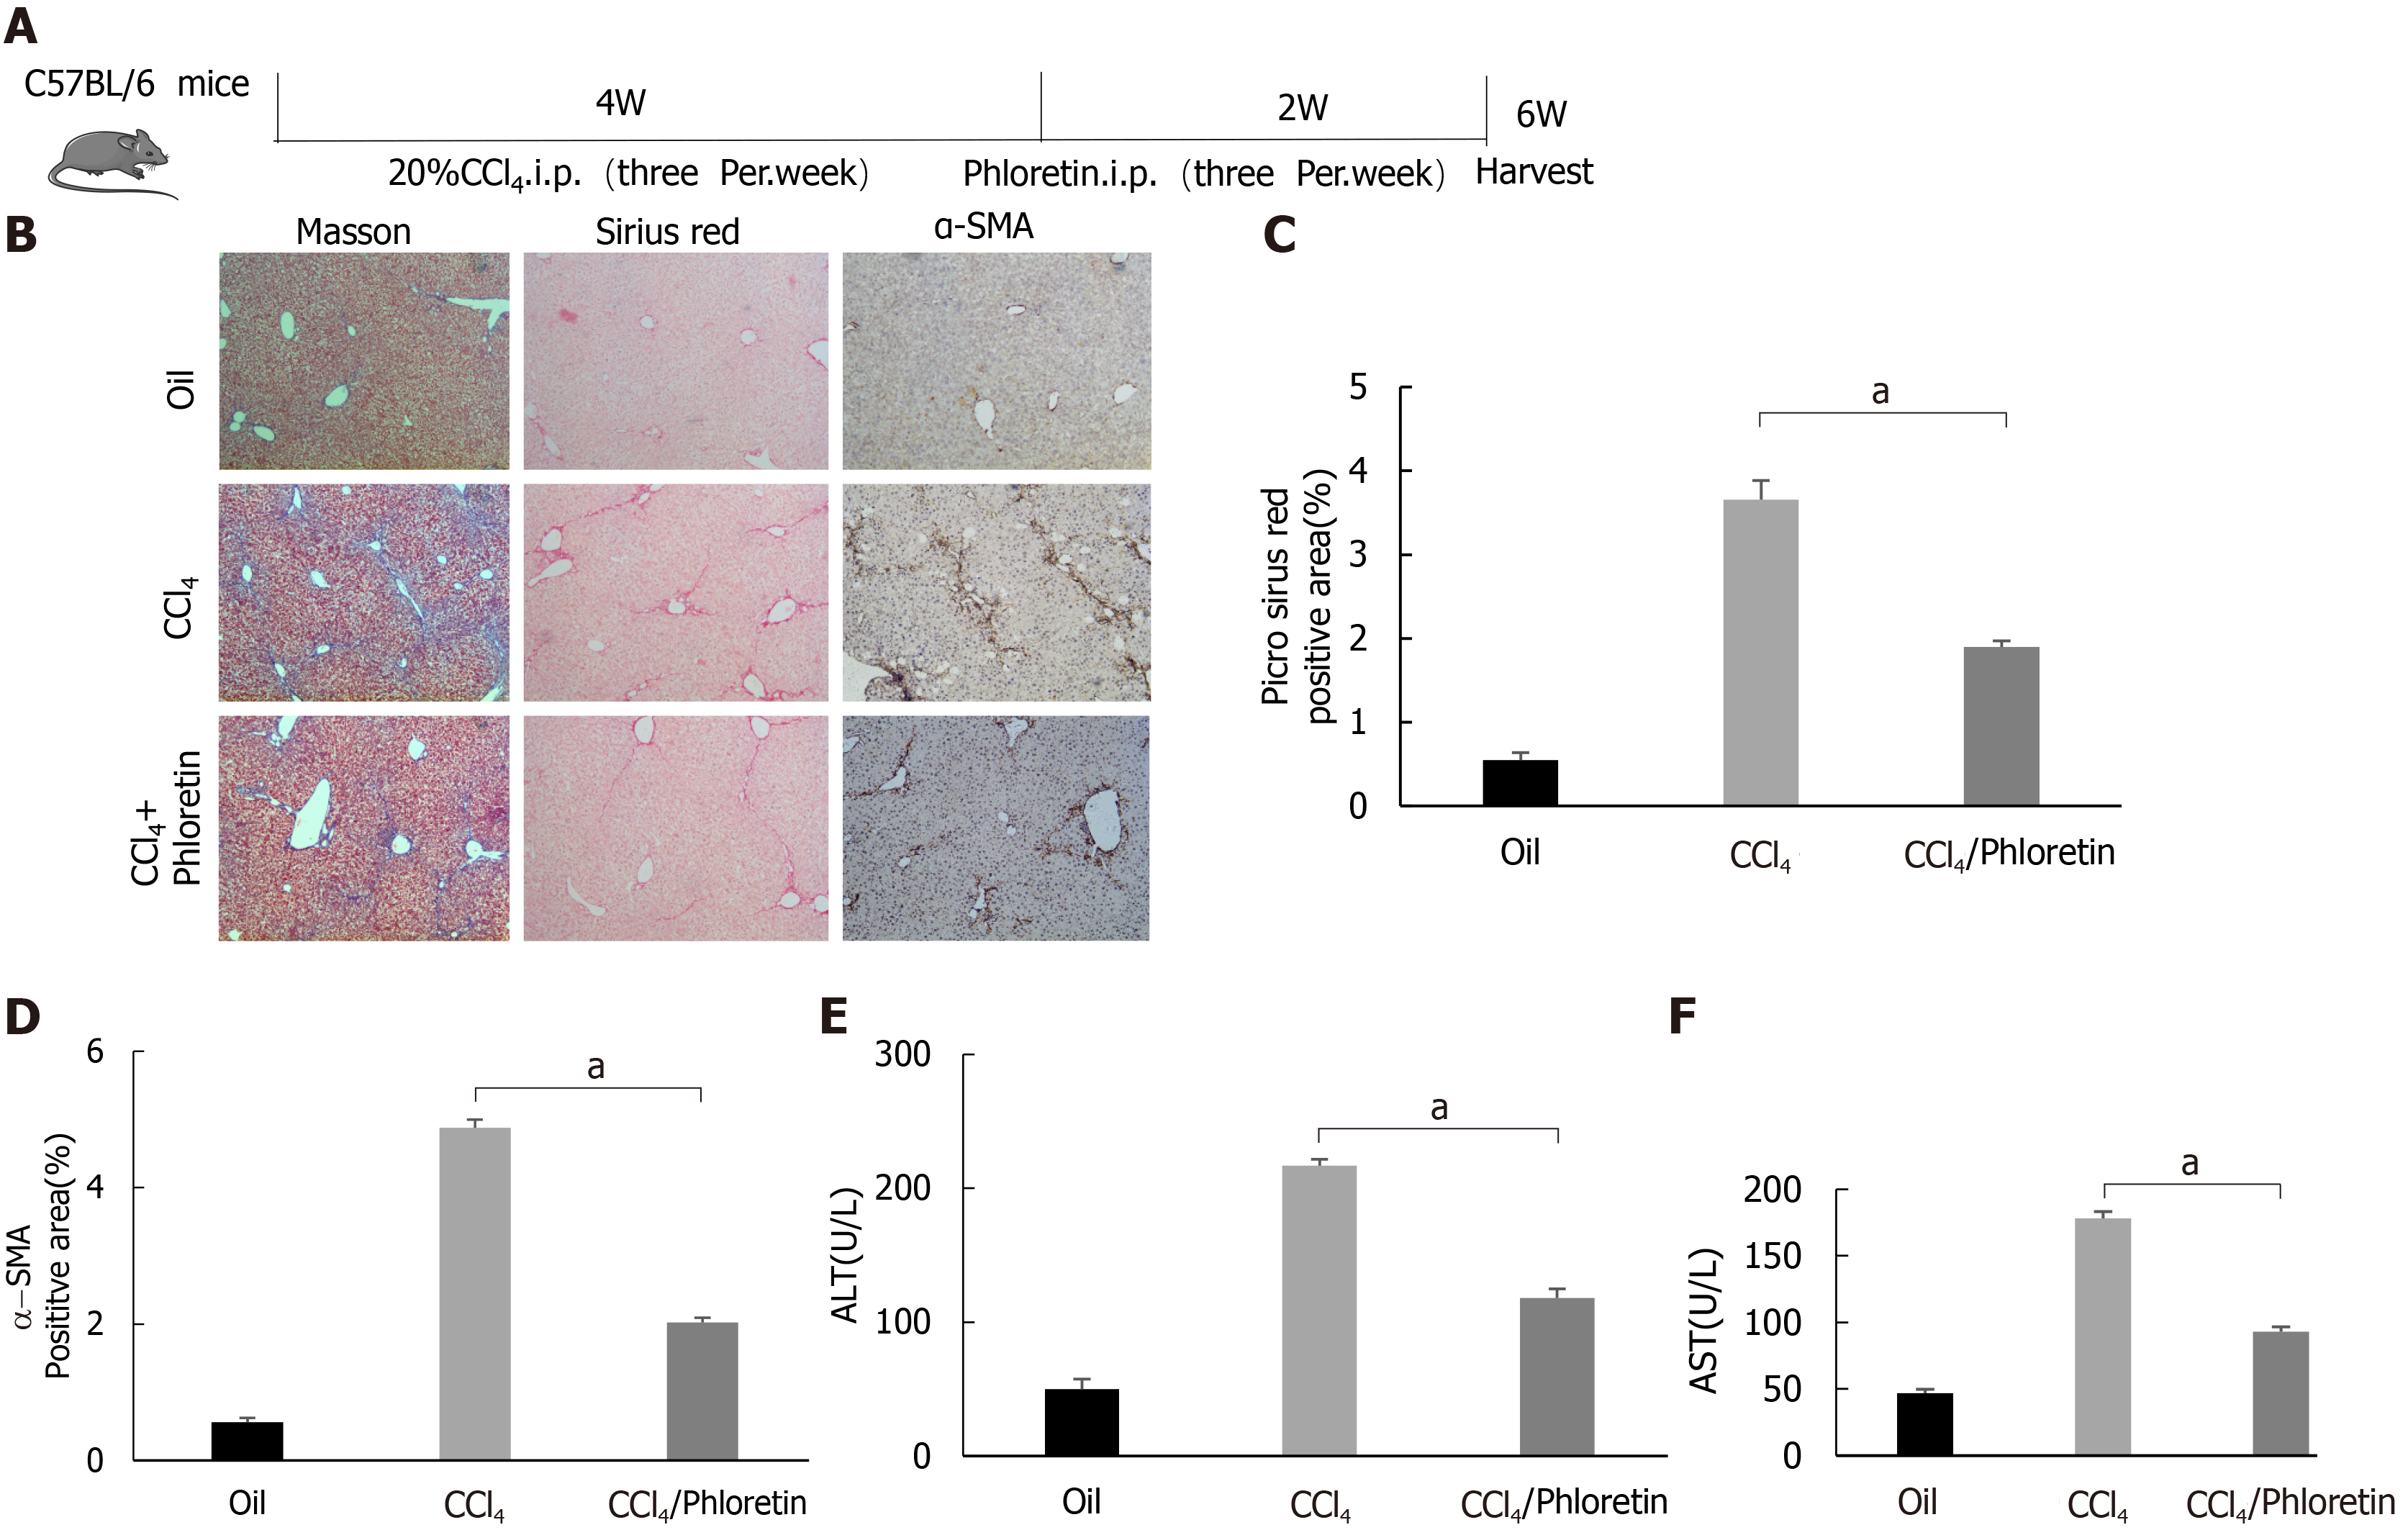
Figure 6 Glucose transporter 1 inhibition delays the development of liver fibrosis in a mouse model of liver fibrosis.
A: Schematic diagram of the experiment. C57BL/6 mice were injected intraperitoneally with CCl4 to induce liver fibrosis. The model was successfully established after 4 wk. Among the treatment groups, the CCl4 + phloretin group was intraperitoneally injected with phloretin (10 mg/kg) three times a week, and the CCl4 group was injected with normal saline as a control. The treatments were discontinued after 2 wk; B: Mouse livers were collected, and liver tissue sections were prepared. The sections were subjected to Masson’s trichrome staining, Sirius red staining and alpha-smooth muscle actin (α-SMA) immunohistochemical (IHC) staining (original magnification, × 10); C: The positive area ratio detected using Sirius red staining; D: The positive area ratio for α-SMA IHC staining; E and F: Serological analysis of ALT (E) and AST (F) levels (n = 5-7; the mean ± SE; scale bar, 100 μm; aP < 0.05 for the comparison between the CCl4 group and the CCl4 + phloretin group; Student’s t test). α-SMA: Alpha-smooth muscle actin.
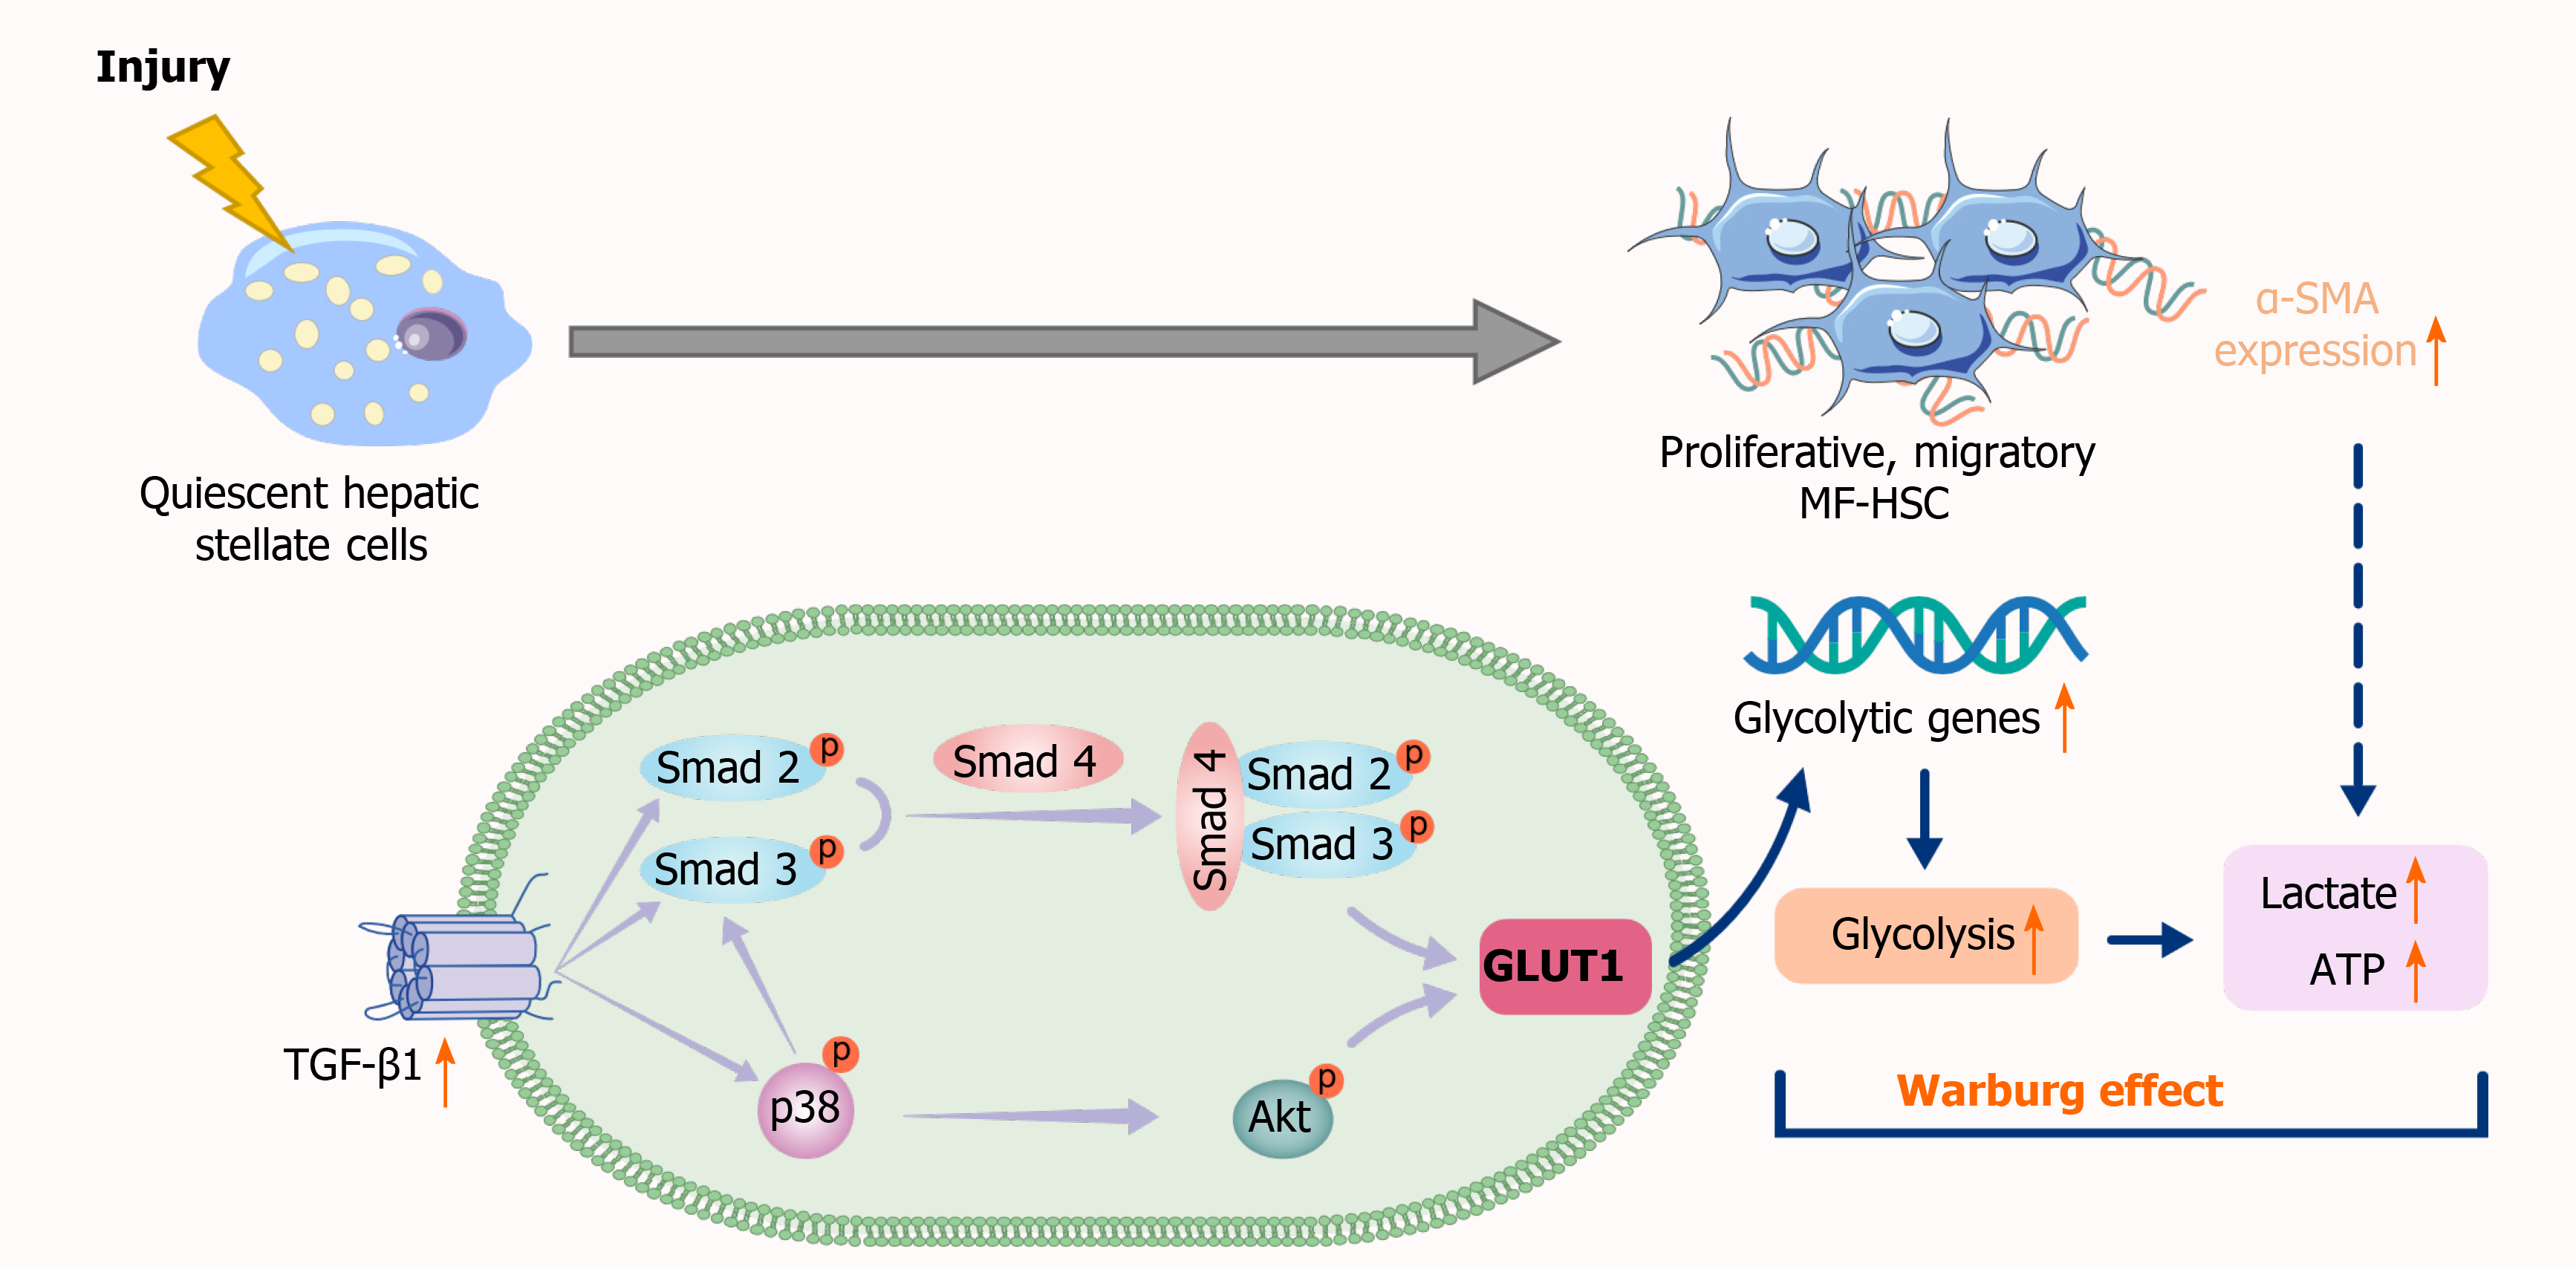
Figure 7 Schematic representation of the mechanisms implicated in canonical and noncanonical transforming growth factor-β pathways regulating glucose transporter 1 expression.
TGF-β1: Transforming growth factor-β1; GLUT1: Glucose transporter 1; MF-HSC: Myofibroblasts-hepatic stellate cells; α-SMA: Alpha-smooth muscle actin.
- Citation: Zhou MY, Cheng ML, Huang T, Hu RH, Zou GL, Li H, Zhang BF, Zhu JJ, Liu YM, Liu Y, Zhao XK. Transforming growth factor beta-1 upregulates glucose transporter 1 and glycolysis through canonical and noncanonical pathways in hepatic stellate cells. World J Gastroenterol 2021; 27(40): 6908-6926
- URL: https://www.wjgnet.com/1007-9327/full/v27/i40/6908.htm
- DOI: https://dx.doi.org/10.3748/wjg.v27.i40.6908


