Copyright
©The Author(s) 2021.
World J Gastroenterol. Sep 28, 2021; 27(36): 6093-6109
Published online Sep 28, 2021. doi: 10.3748/wjg.v27.i36.6093
Published online Sep 28, 2021. doi: 10.3748/wjg.v27.i36.6093
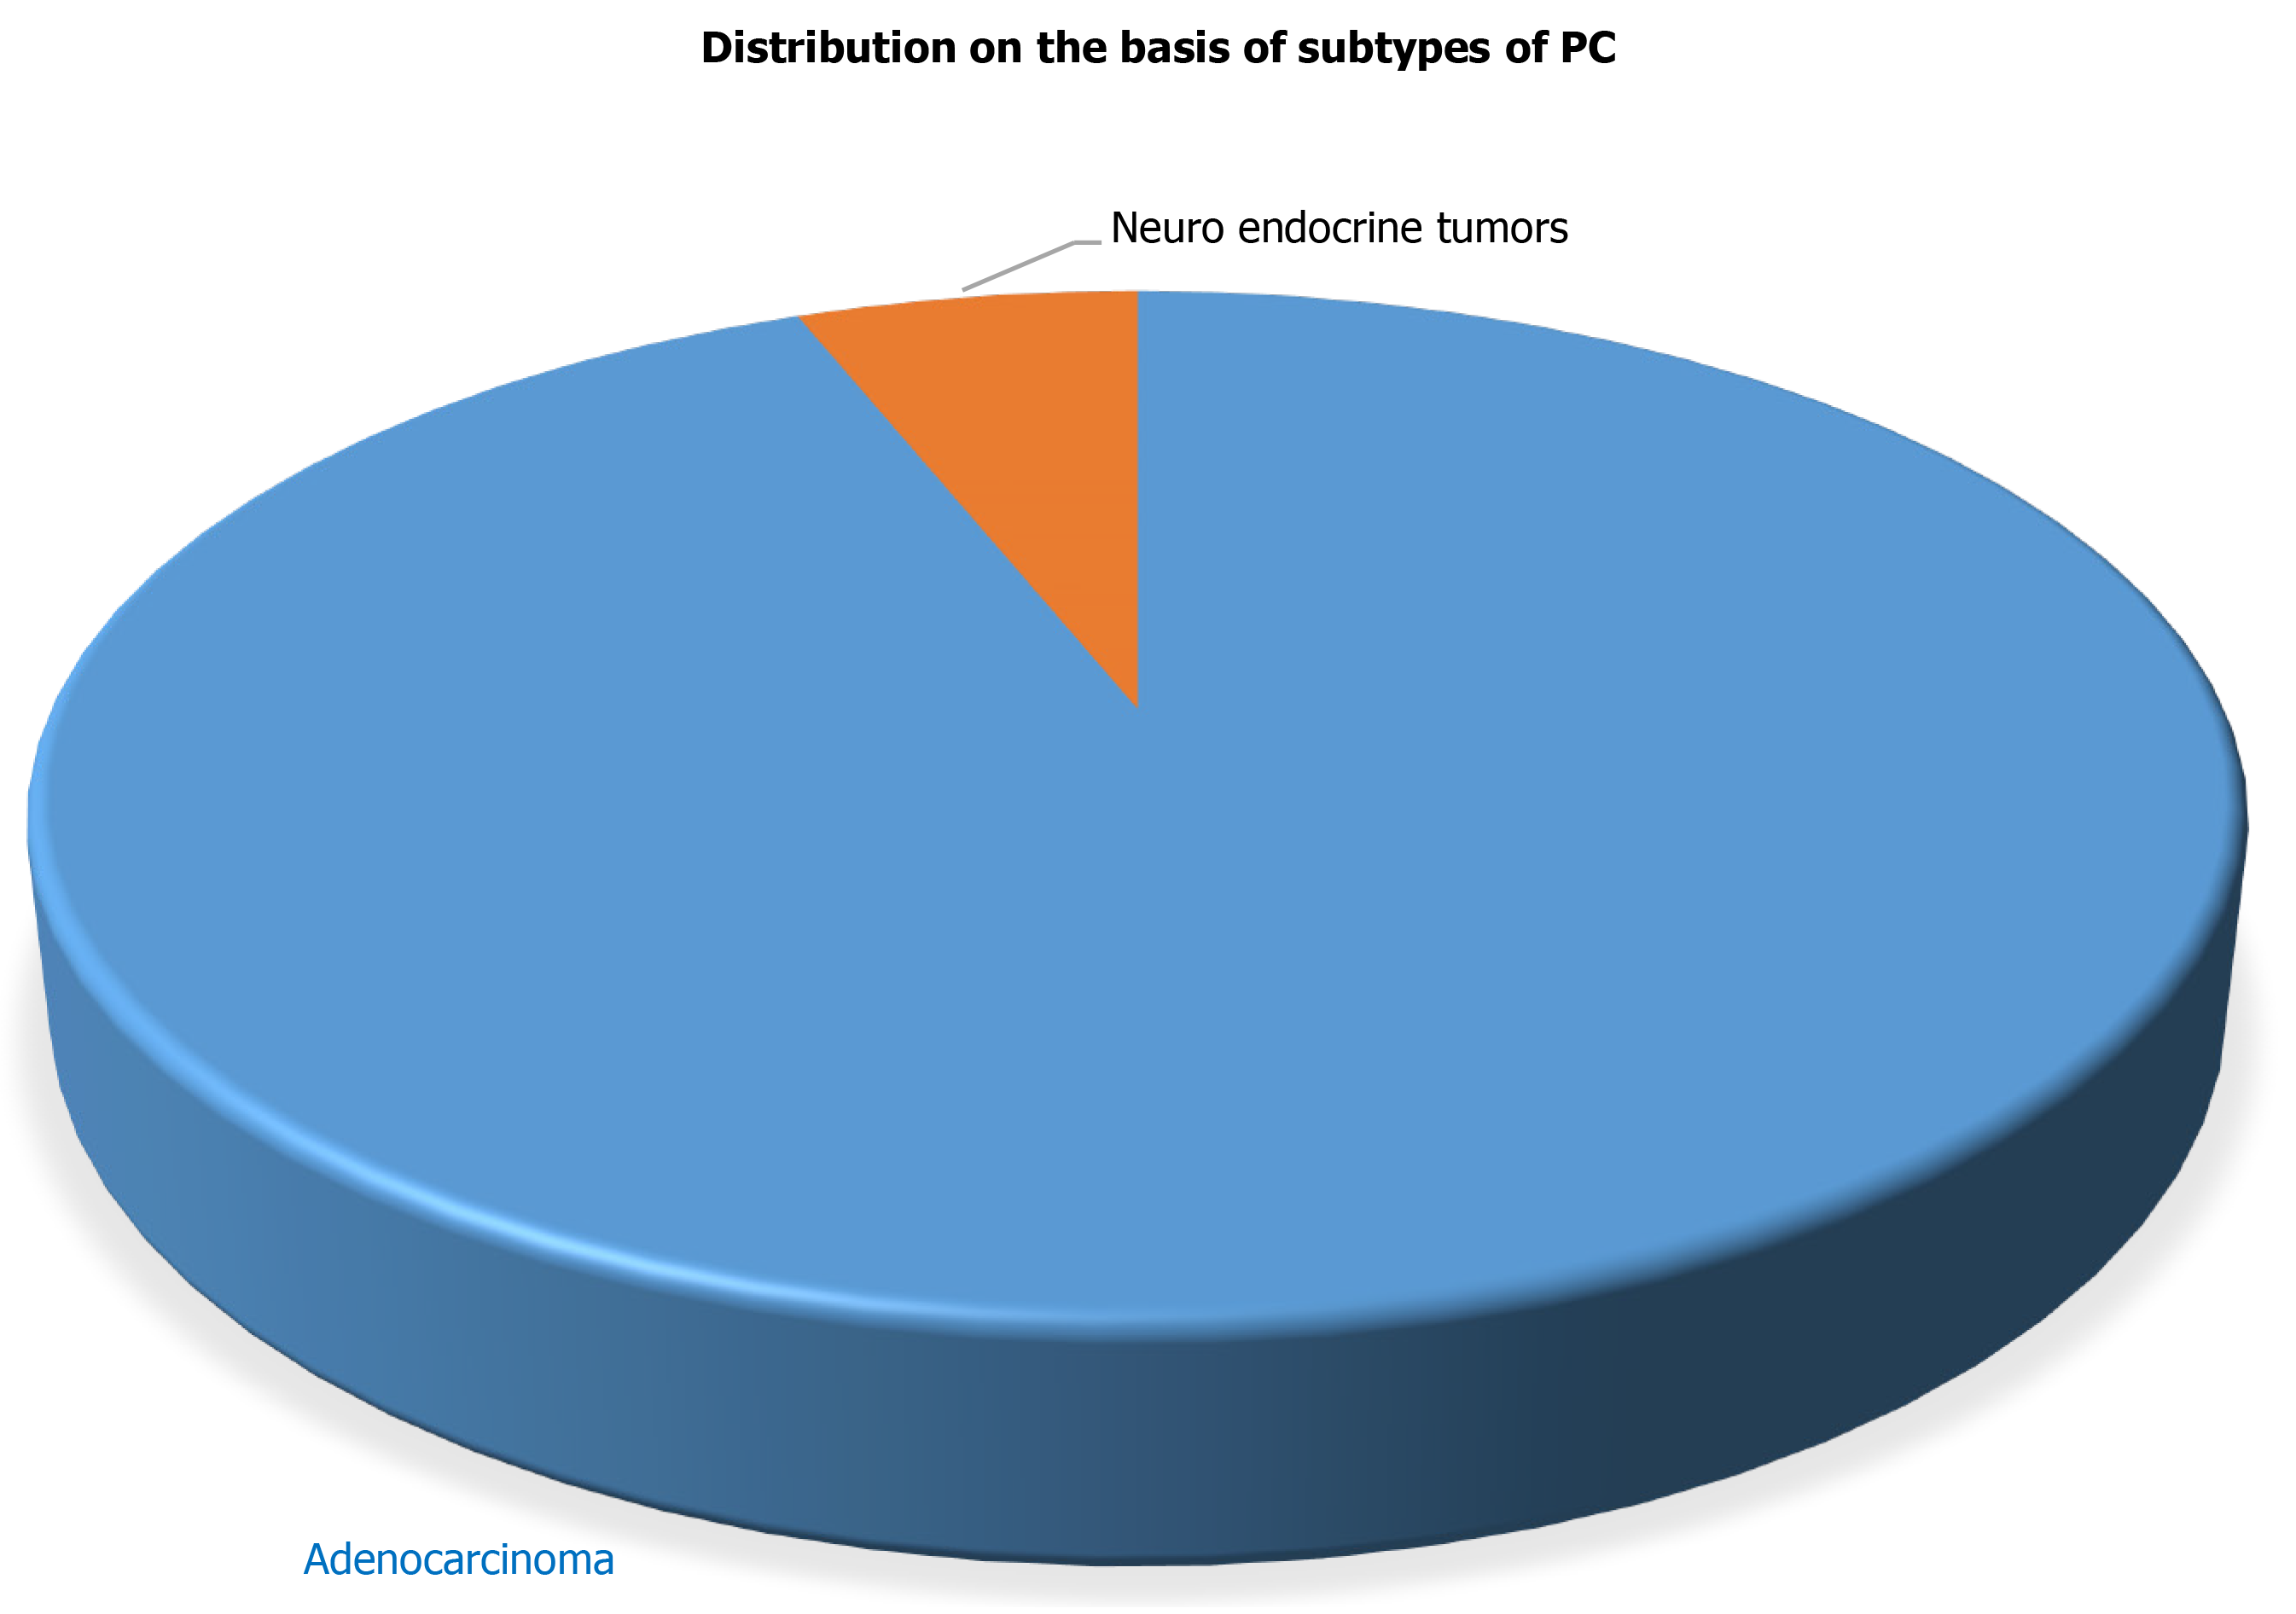
Figure 1 Distribution of samples (cases) based on subtypes of pancreatic cancer.
PC: Pancreatic cancer.
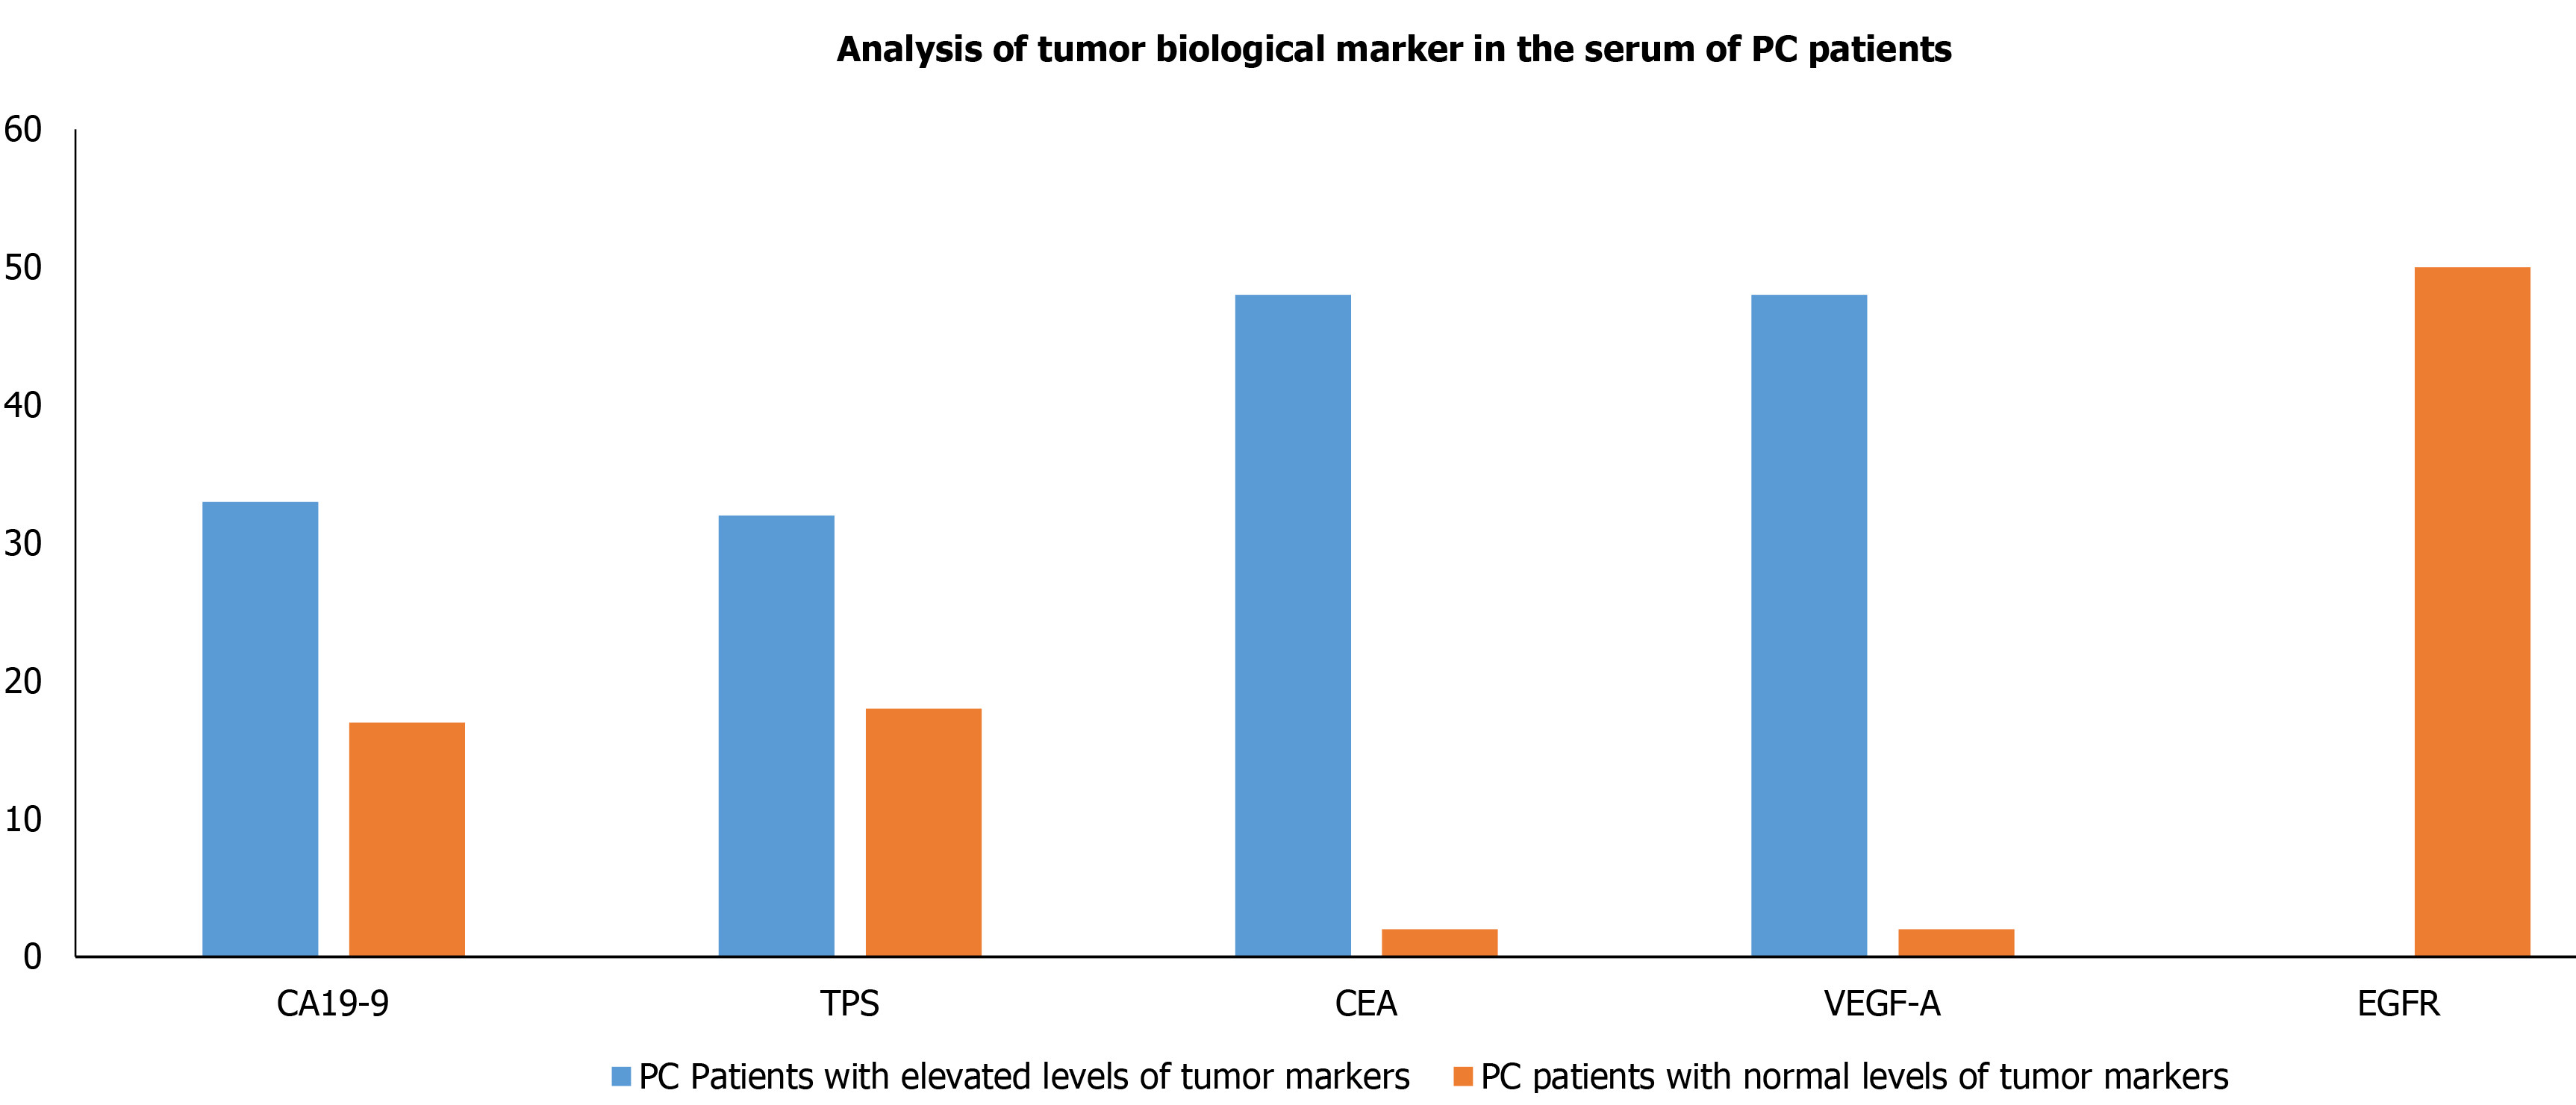
Figure 2 Analysis of tumor biological marker (carbohydrate antigen 19-9, tissue polypeptide specific antigen, carcinoembryonic antigen, vascular endothelial growth factor-A, and epidermal growth factor receptor) in the serum of pancreatic cancer patients.
PC: Pancreatic cancer; CA19-9: Carbohydrate antigen 19-9; TPS: Tissue polypeptide specific antigen; CEA: Carcinoembryonic antigen; VEGF-A: Vascular endothelial growth factor-A; EGFR: Epidermal growth factor receptor.
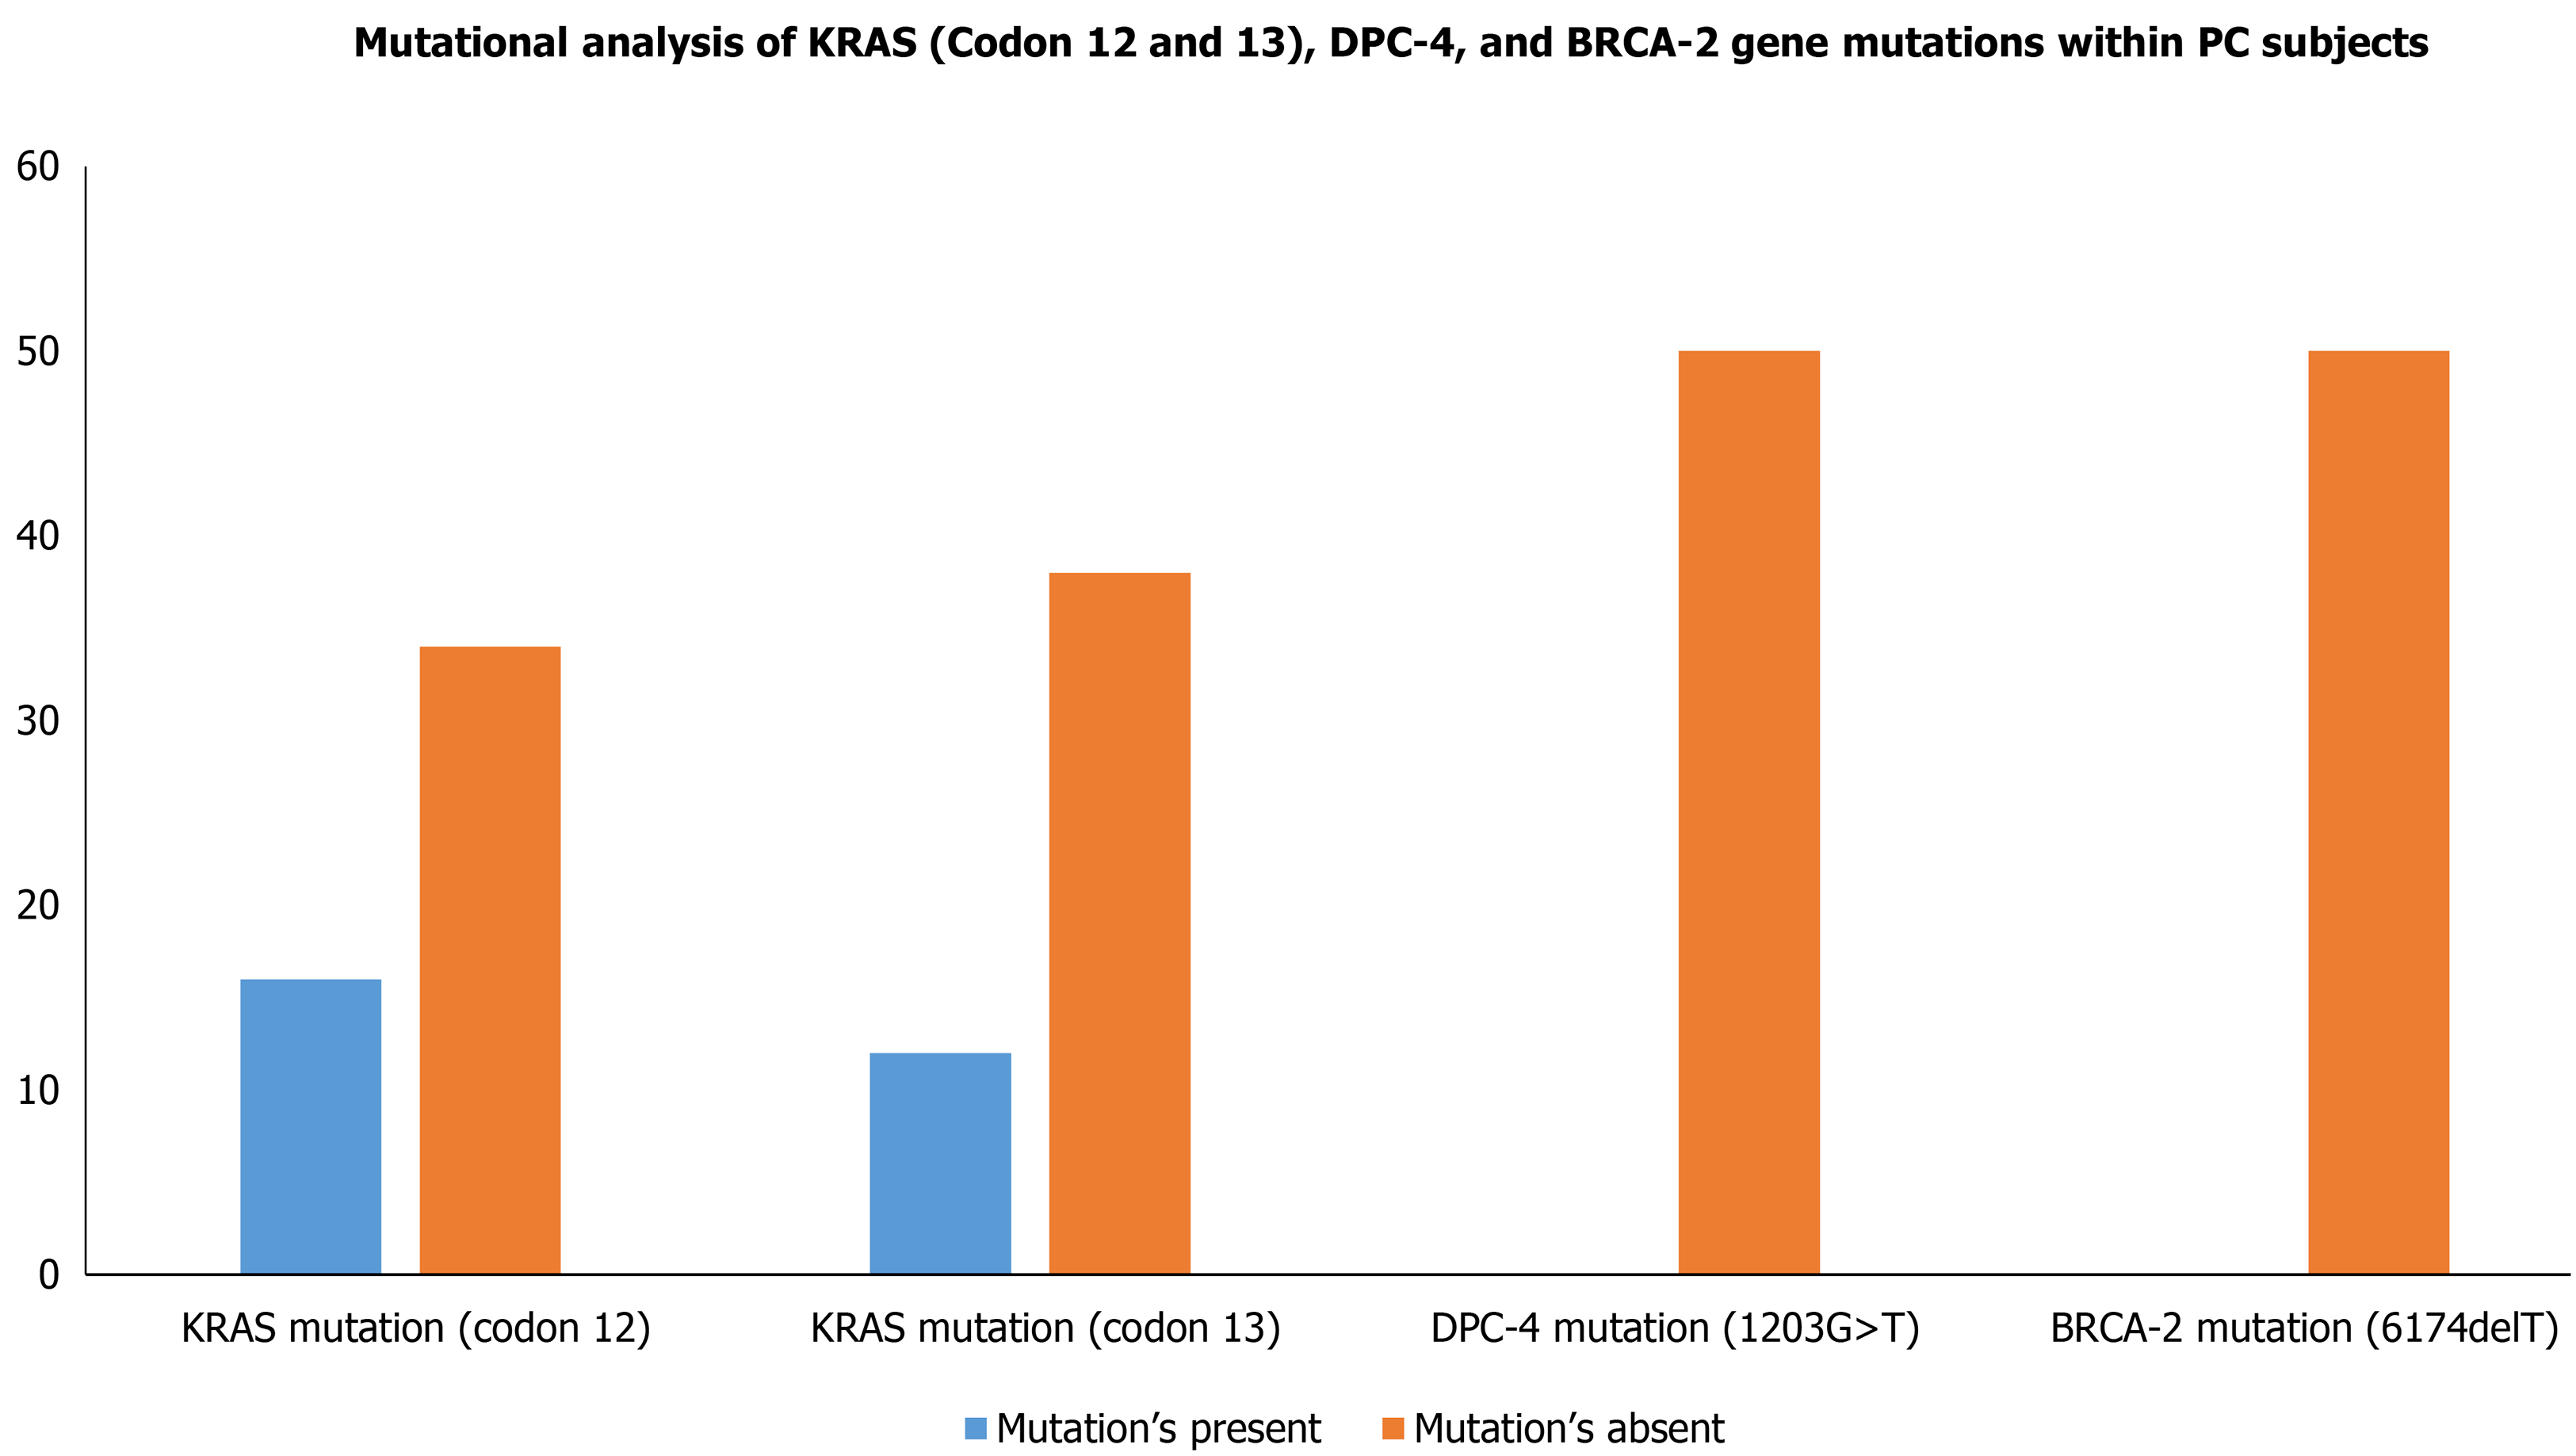
Figure 3 Mutational analysis of KRAS (Codon 12 and 13), DPC-4, and BRCA-2 gene mutations within pancreatic cancer cases.
KRAS: Kirsten rat sarcoma; DPC-4: Deleted in pancreatic cancer-4; BRCA-2: Breast cancer type 2.
Figure 4 Representative agarose gel picture of polymerase chain reaction amplification (A) and restriction fragment length polymorphism using BstN1 (B) for KRAS codon 12.
The arrow represents the 157 bp amplicon and M denotes the DNA marker (50 bp). Lane M represents a DNA marker (50 bp). Lanes 2, 4, 7, 8, and 10 represent the mutant band (undigested) of 157 bp. Lane 1, 3, 6, and 9 represent the wild band (digested) of 128 bp. U represents the undigested band used as mutant control.
Figure 5 Representative gel picture of polymerase chain reaction amplification (A) and restriction fragment length polymorphism using BglI (B) for K-RAS codon 13.
The arrow represents the 157 bp amplicon and M denotes the DNA marker (100 bp). Lane M represents a DNA marker (100 bp). Lanes 2, 3, 6, 7, 8, 9, 10, and 11 represent the mutant band (undigested) of 157 bp. Lanes 1, 4, 5, and 8 represent a wild band (digested) of 125 bp.
Figure 6 Representative gel picture of polymerase chain reaction amplification and restriction fragment length polymorphism using MnlI of DPC-4.
The arrow represents the 184bp amplicon and M denotes the DNA marker (100 bp). Lane M represents a DNA marker (50 bp). 117 bp and 67 bp represent the wild bands (digested). U represents the mutant control band of 184 bp (undigested).
Figure 7 Representative agarose gel picture of AS-polymerase chain reaction amplification (A) and gel picture representing polyacrylamide gel electrophoresis (20% gel) (B) of BRCA-2.
All the lanes show 151 bp amplicon which is the wild band and M denotes the DNA marker (100 bp). M is the marker lane (25 bp). Here also, the only wild band (151 bp) is observed in all the lanes.
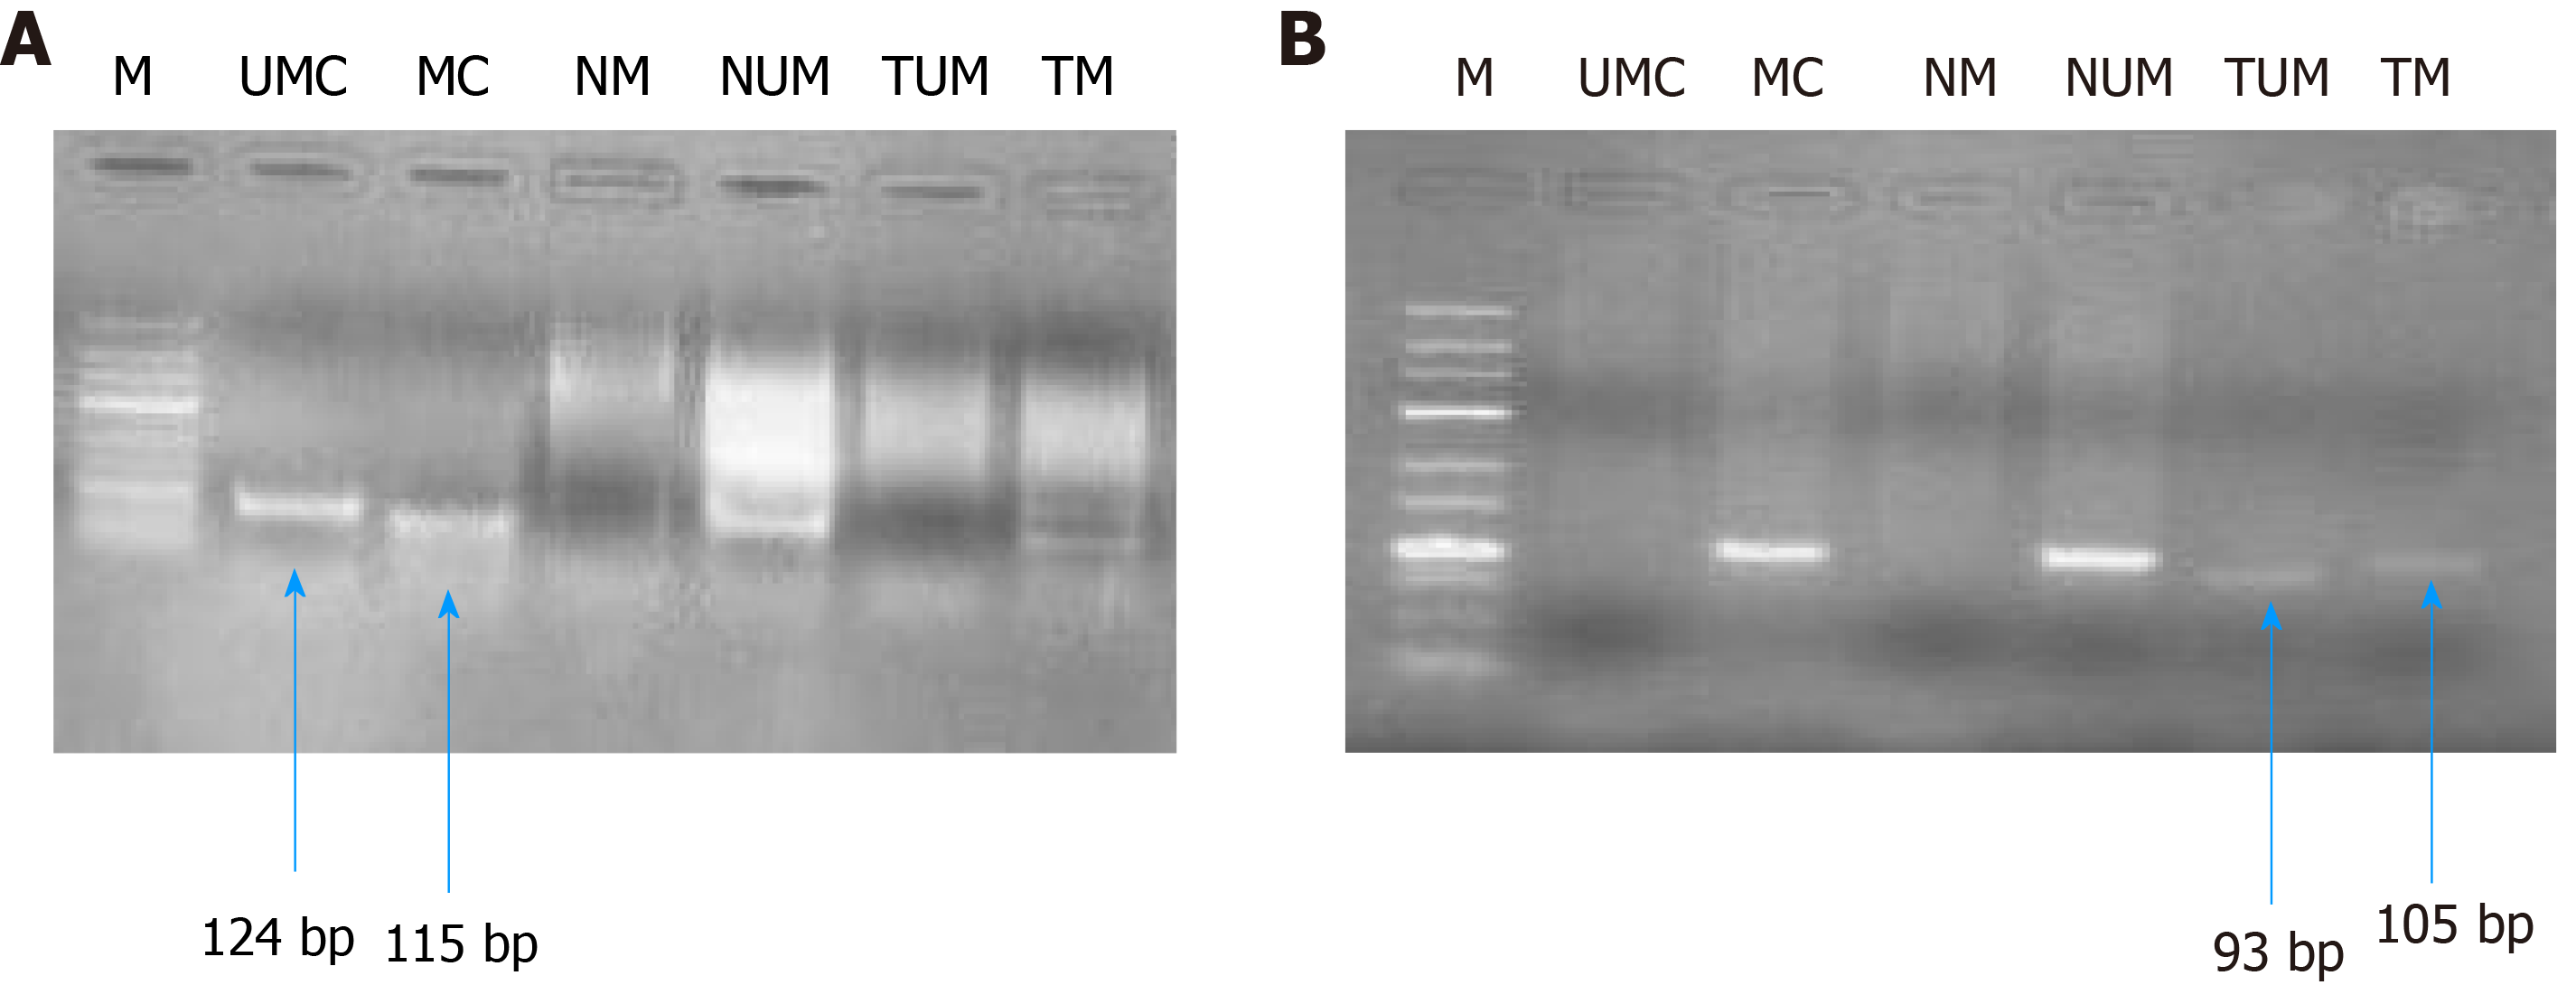
Figure 8 Gel picture representing MS-polymerase chain reaction for hMLH1 (A, 100 bp) and RASSF1A (B, 25 bp).
M represents DNA marker; UMC represents unmethylated control; MC represents methylated control; NM represents normal methylated; NUM represents normal unmethylated; TUM represents tumor unmethylated; TM represents tumor methylation.
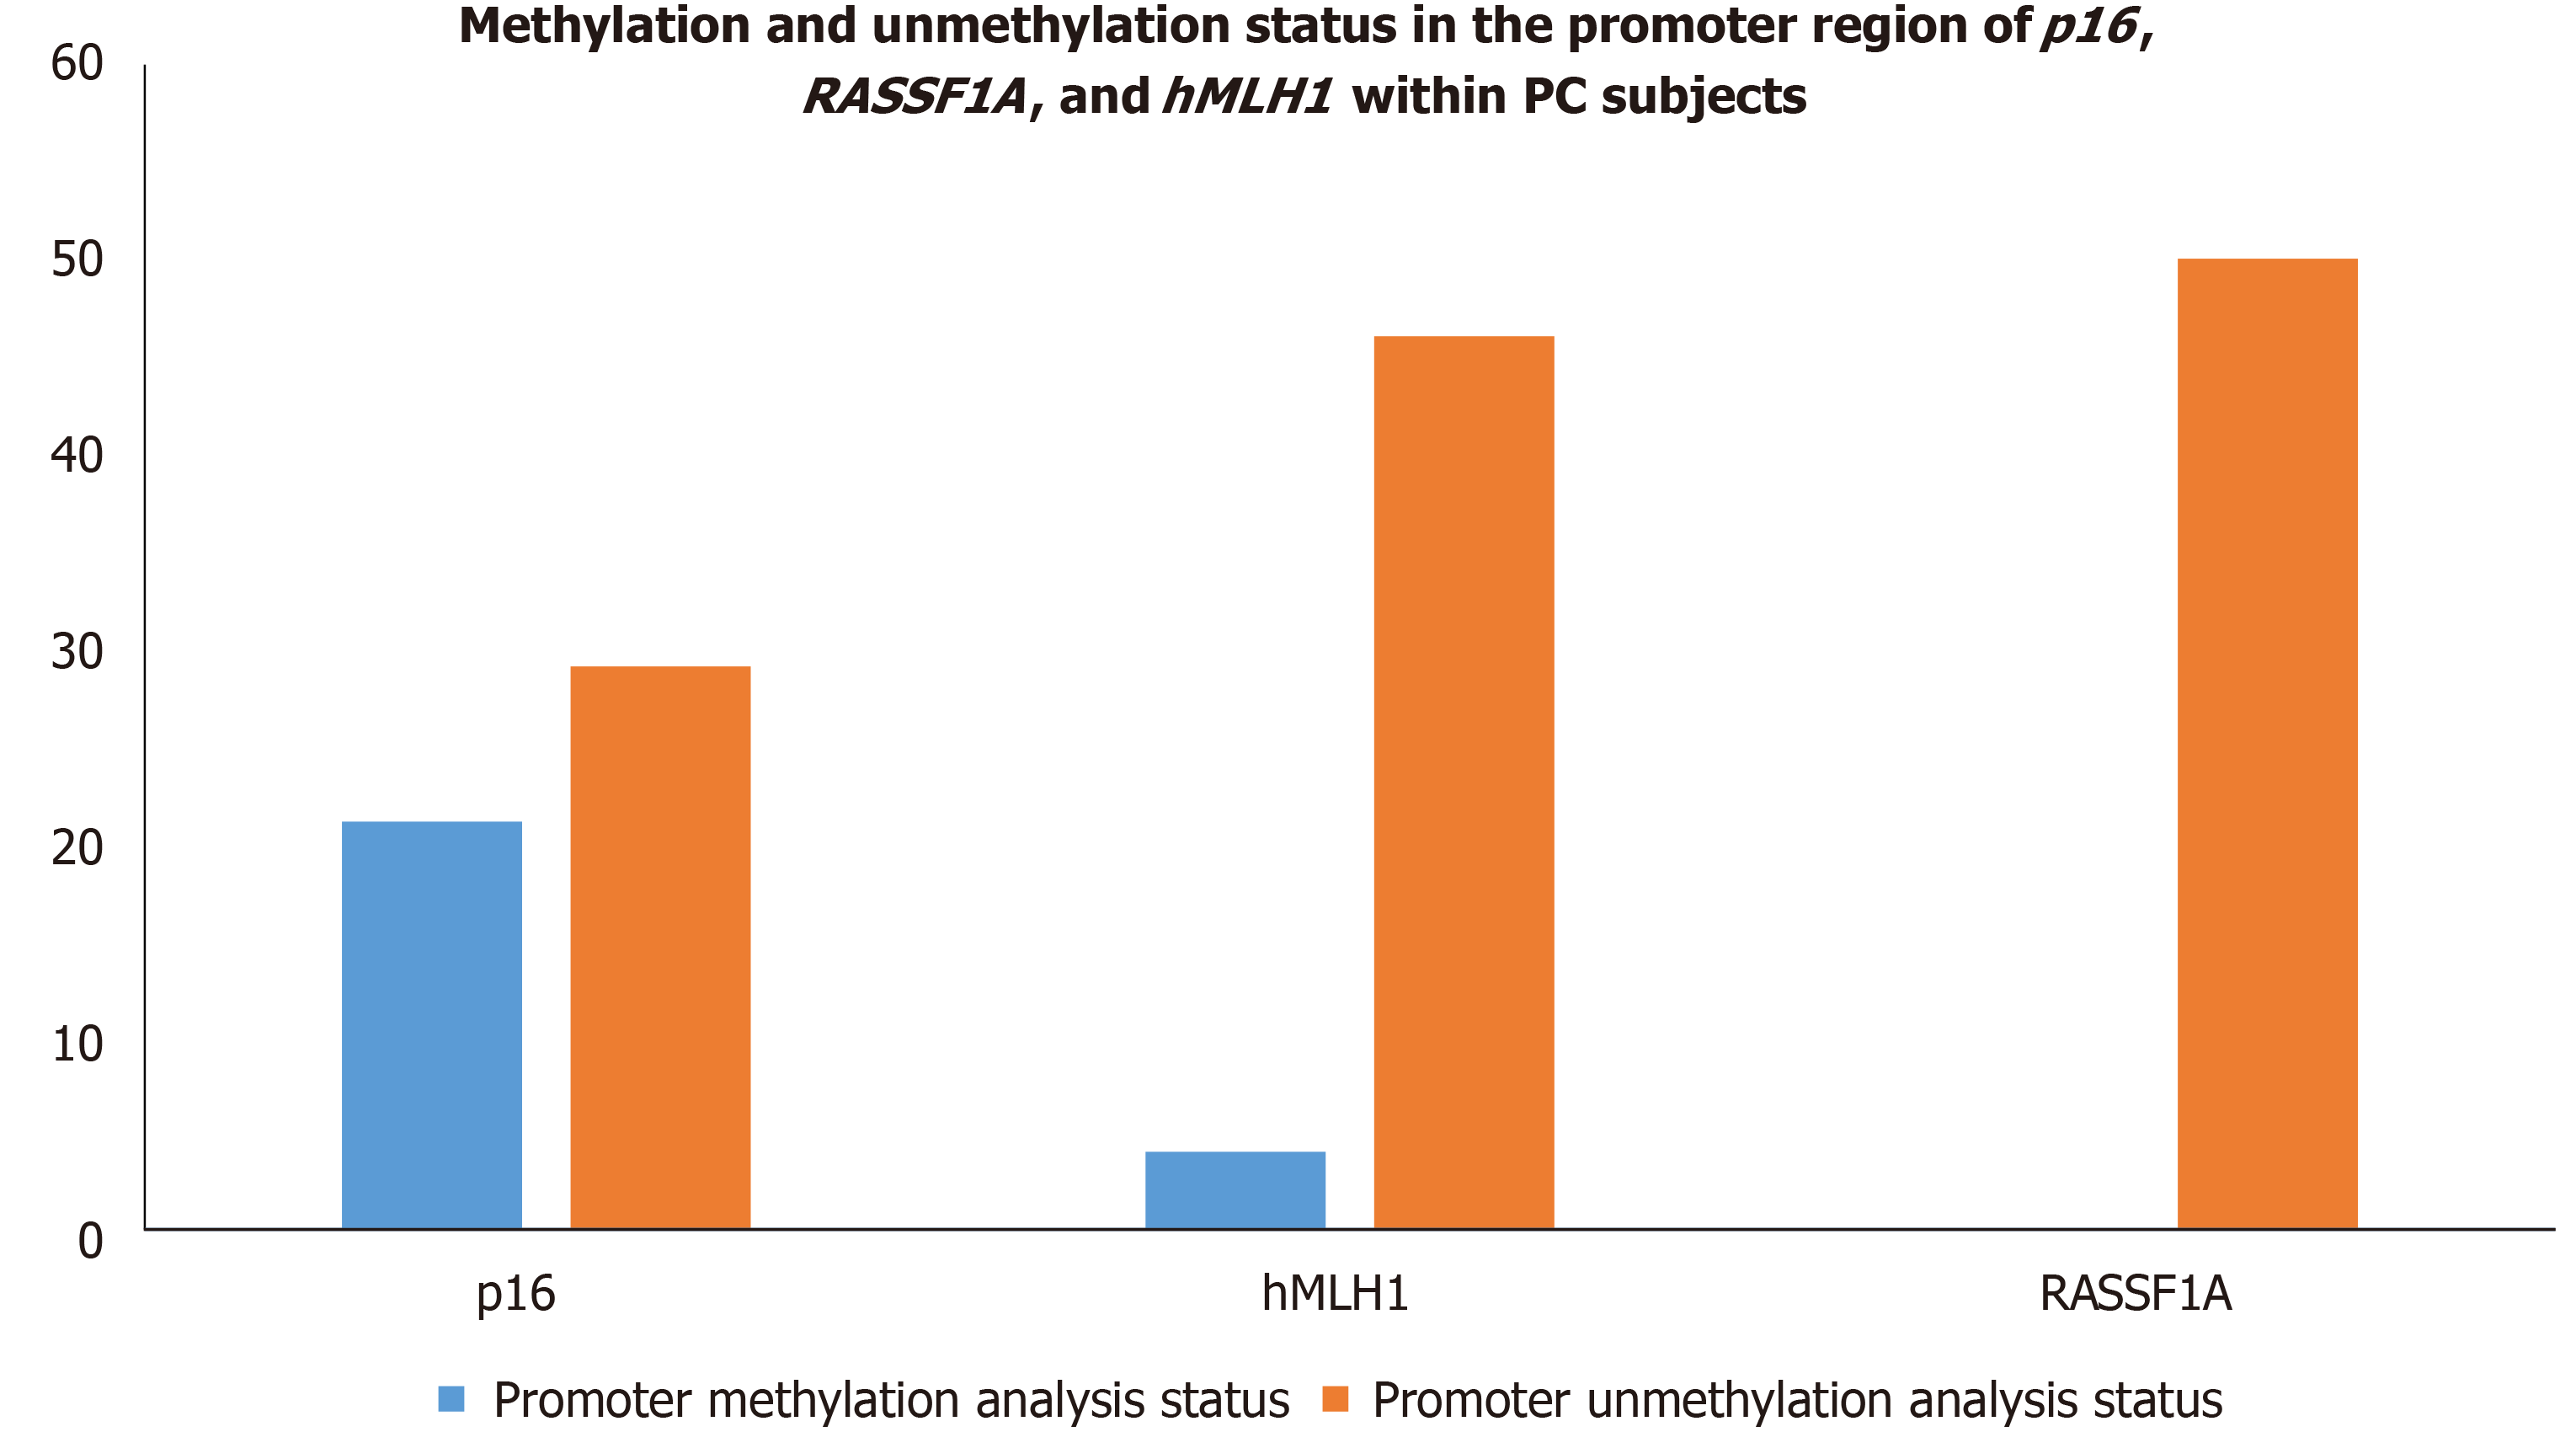
Figure 9 Methylation and unmethylation status in the promoter region of p16,RASSF1A, and hMLH1 within pancreatic cancer subjects.
PC: Pancreatic cancer.
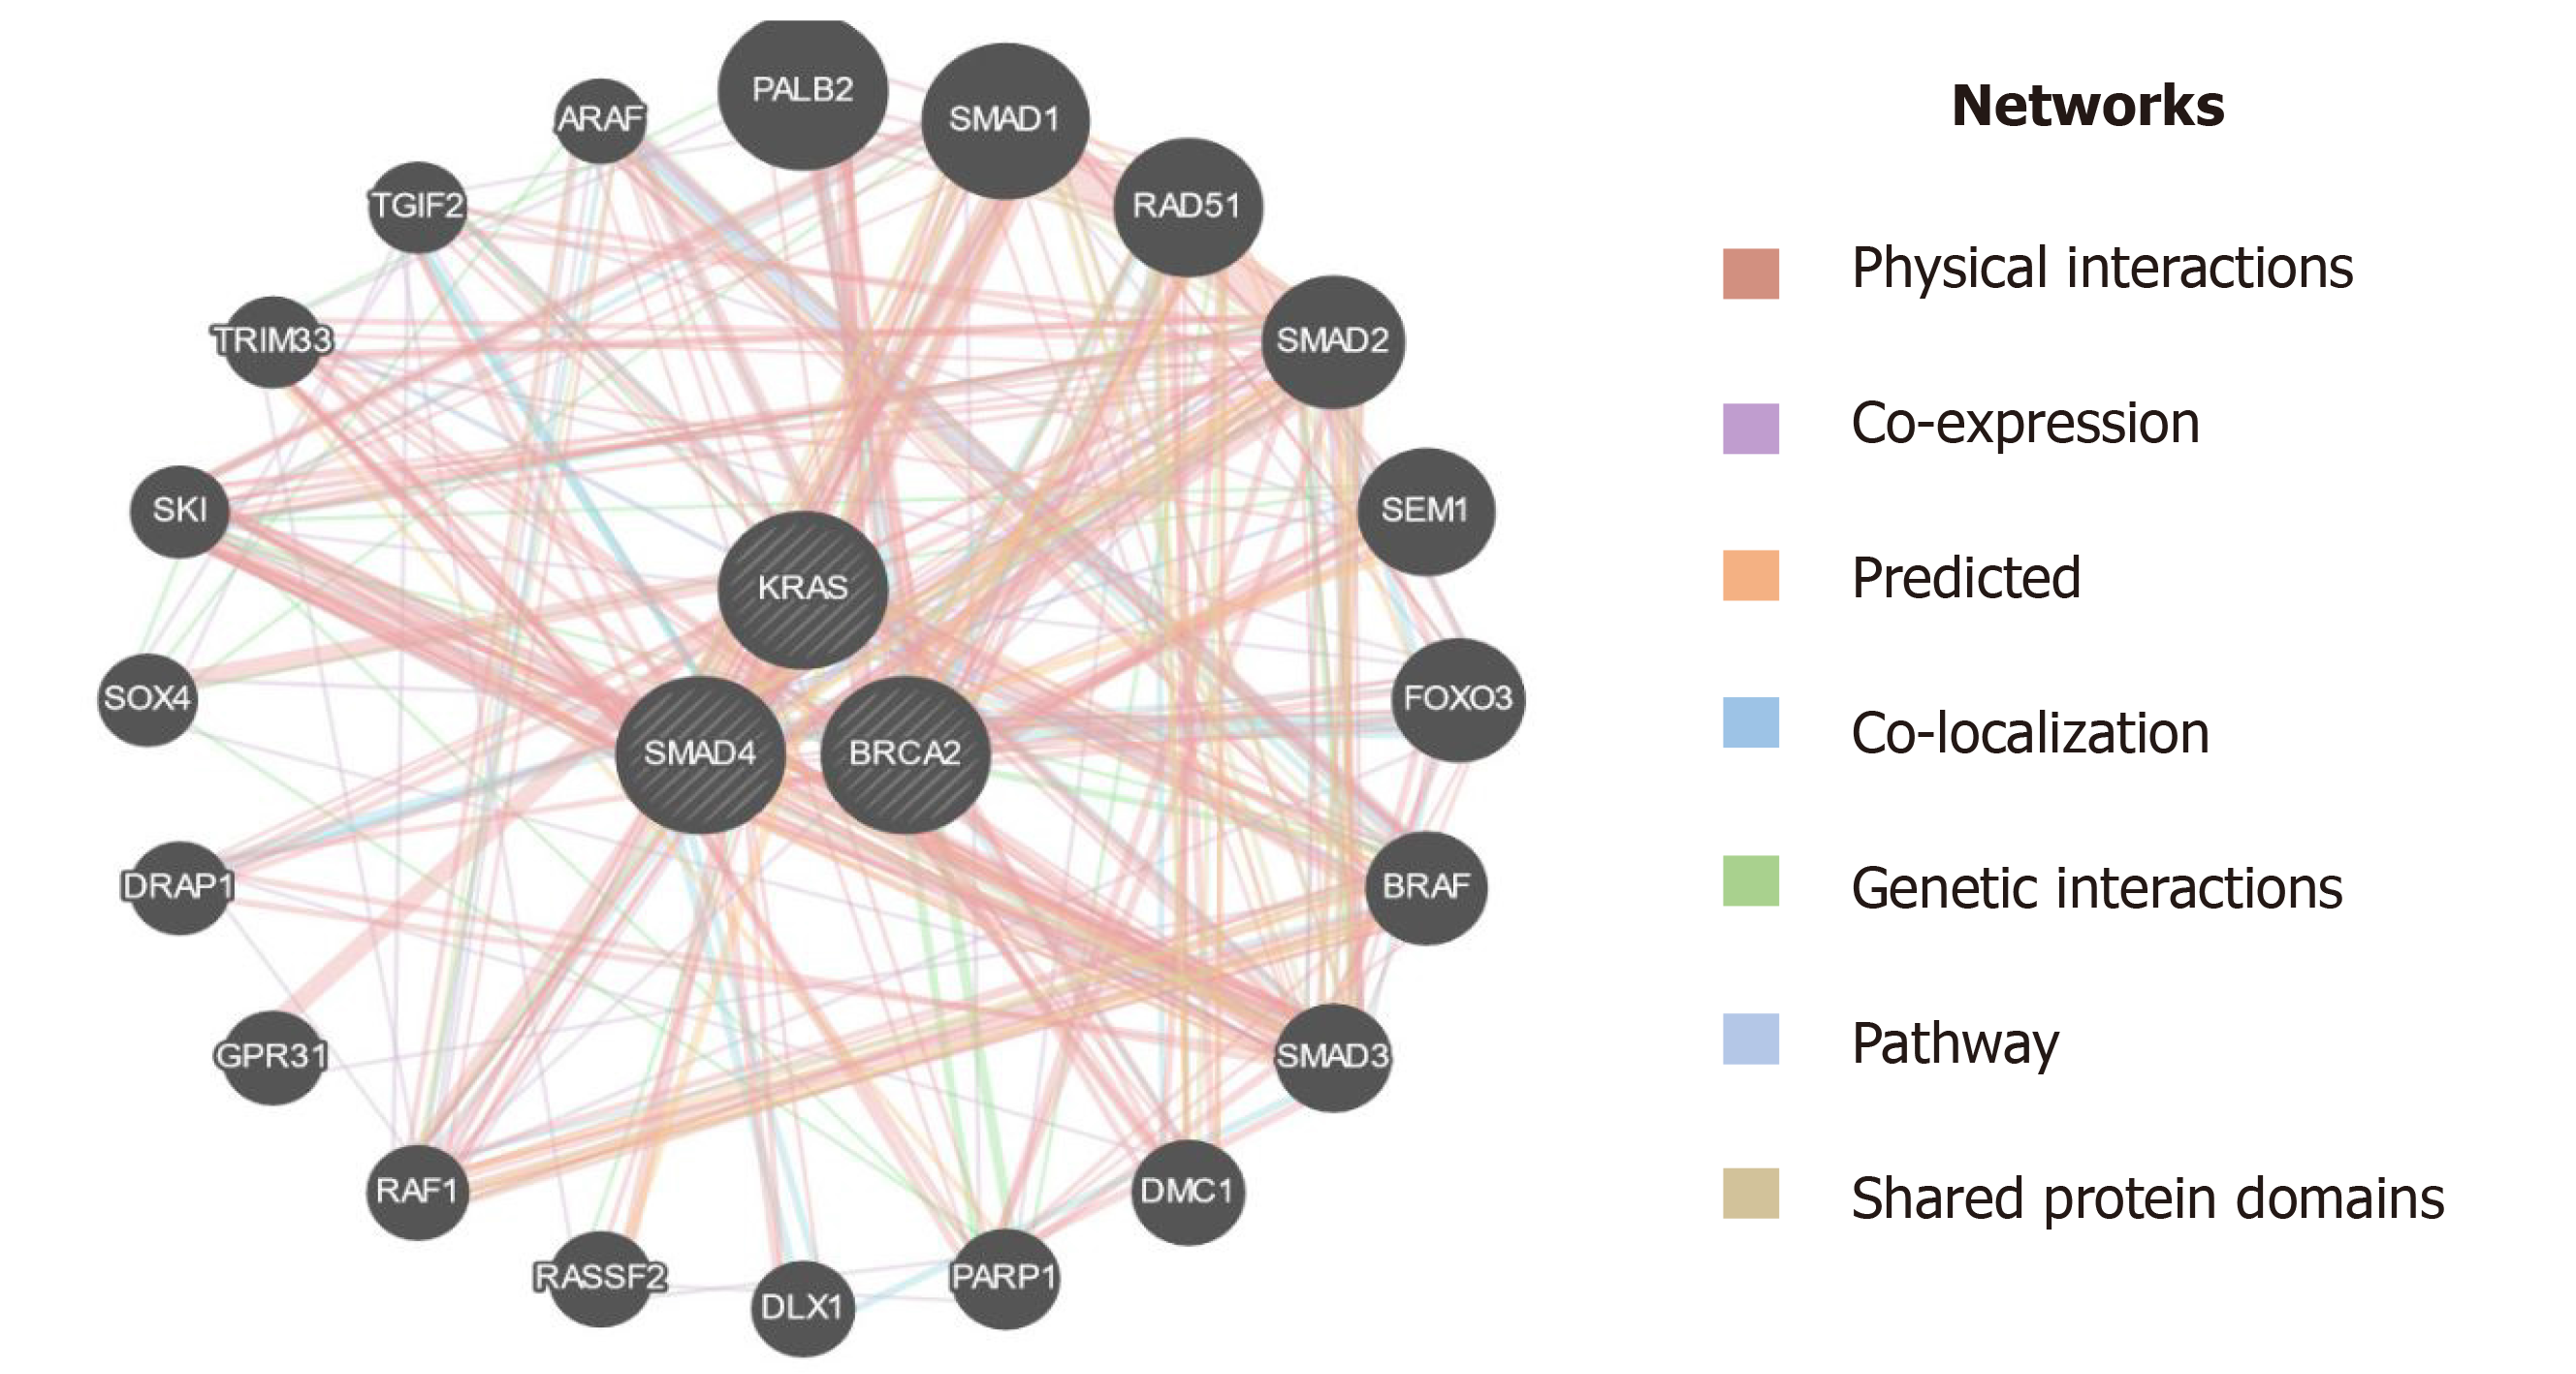
Figure 10 Interaction of KRAS, SMAD4 (DPC4), and BRCA2 with other genes based on various parameters.
KRAS: Kirsten rat sarcoma; DPC-4: Deleted in pancreatic cancer-4; BRCA-2: Breast cancer type 2.
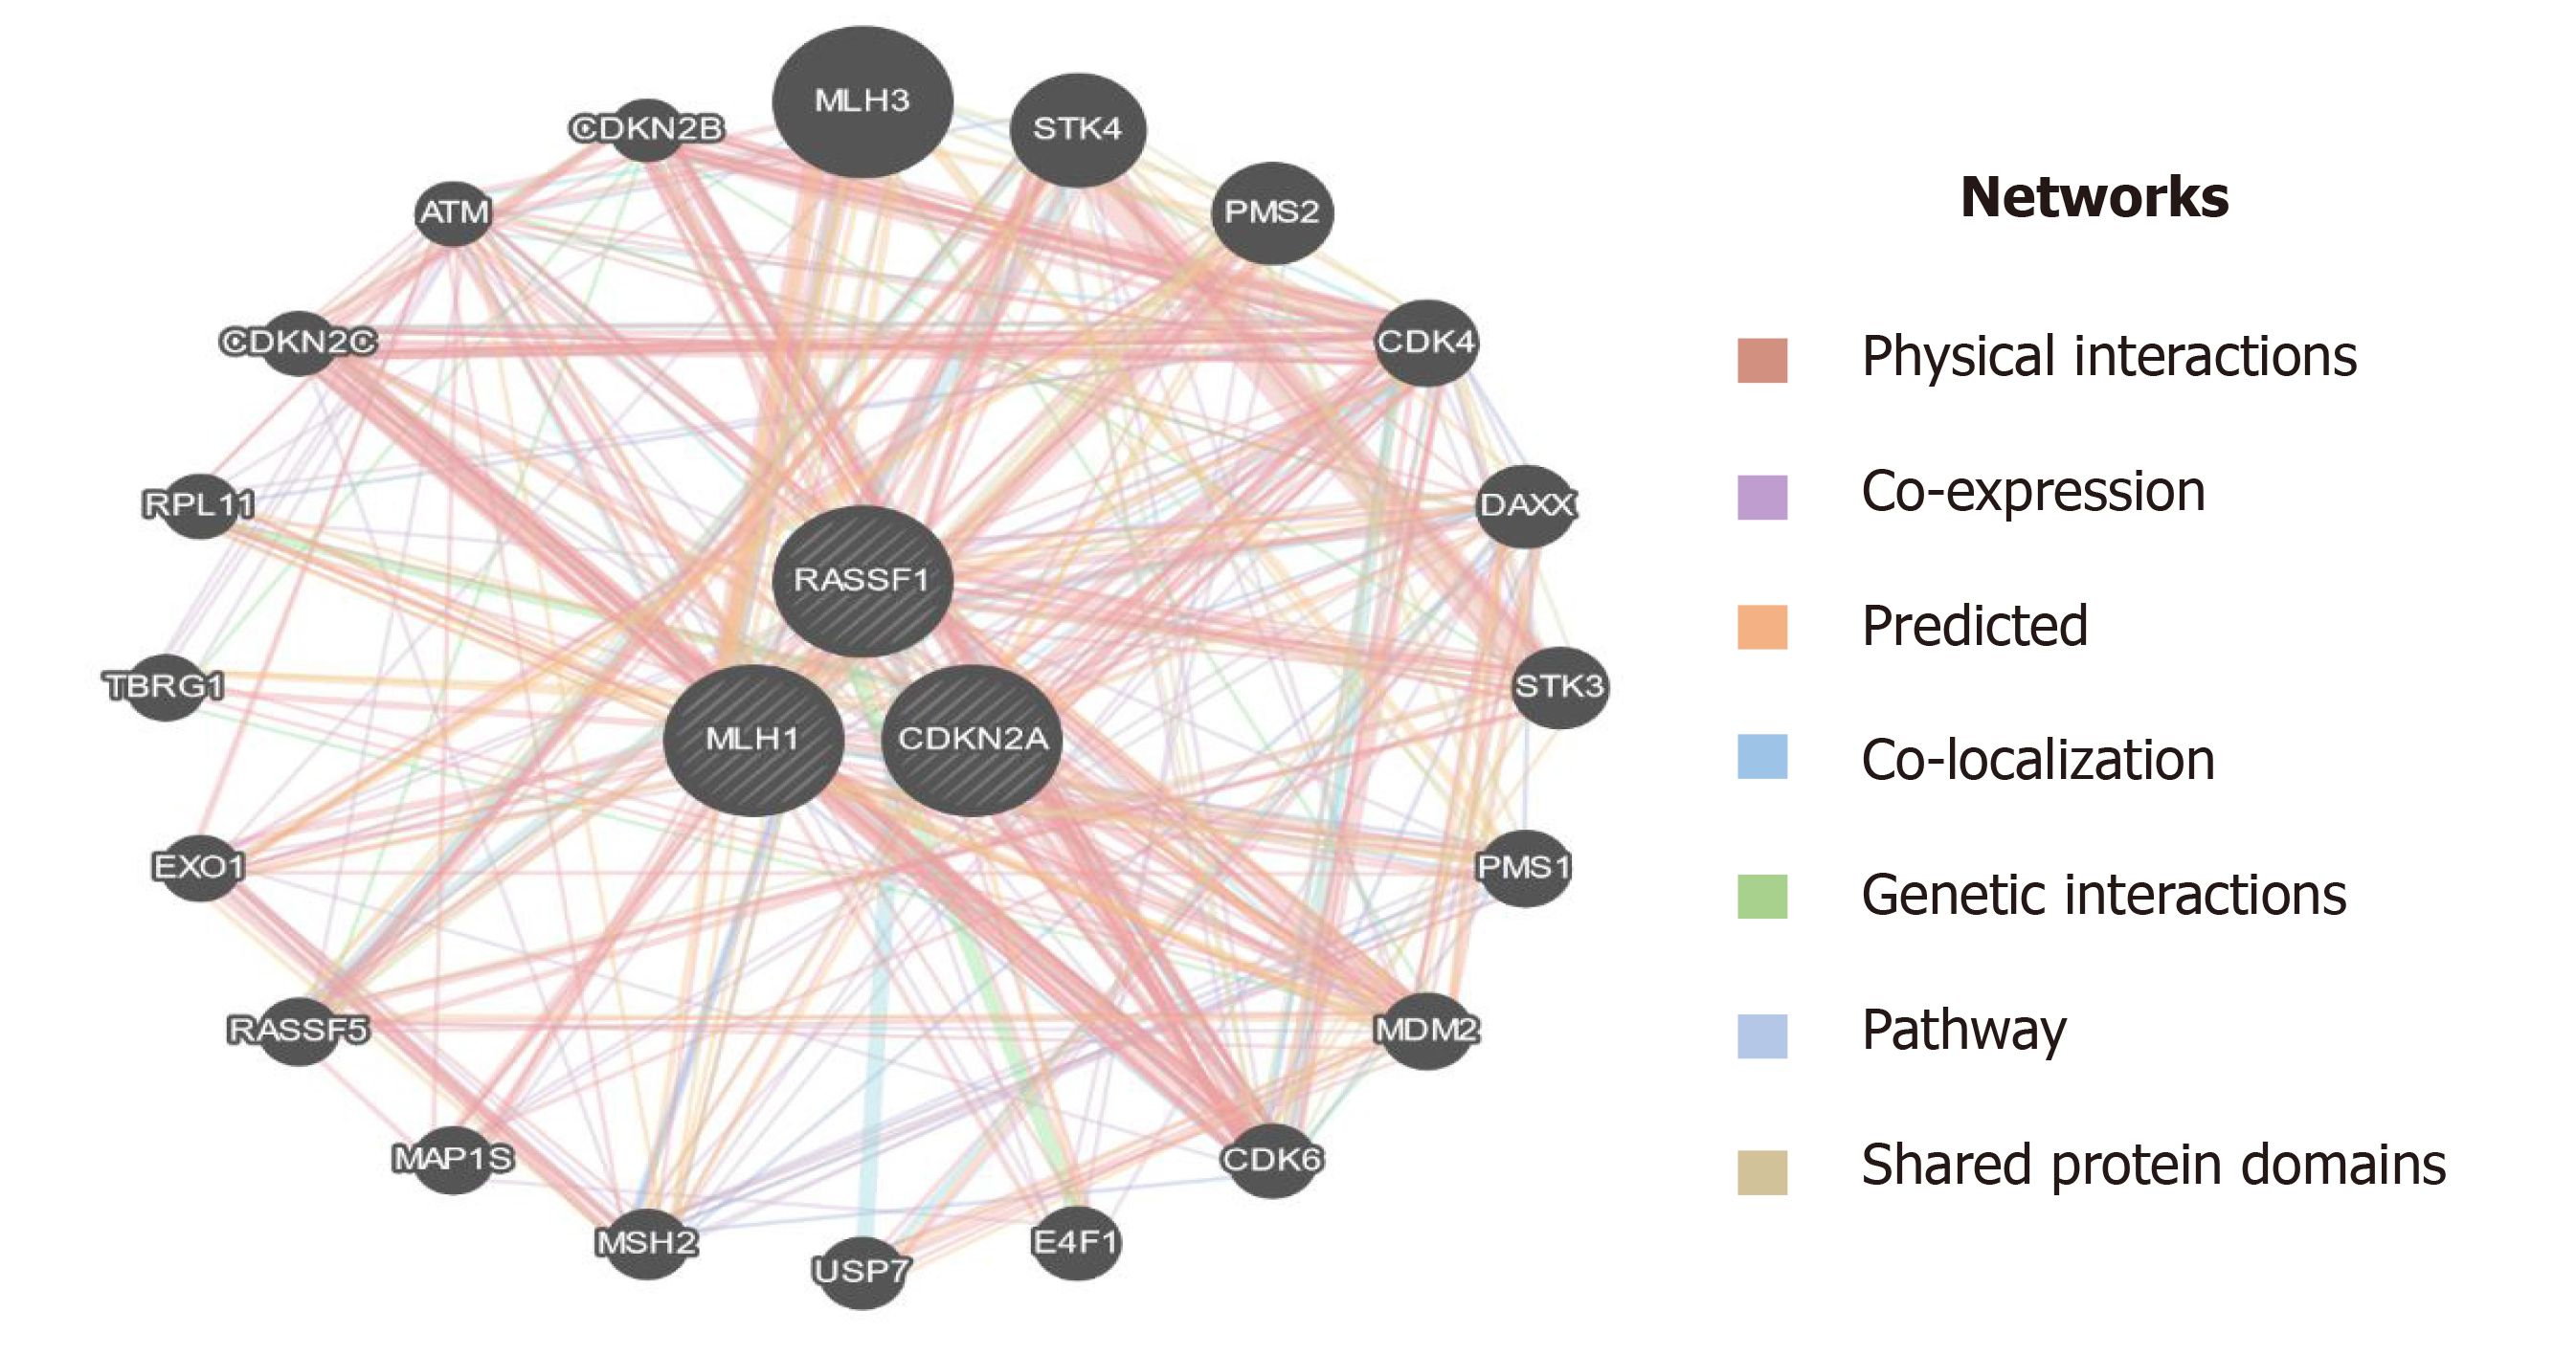
Figure 11 Interaction of MLH1, RASSF1, and CDKN2A (p16) with other important genes which have a role in the progression of pancreatic cancer.
- Citation: Rah B, Banday MA, Bhat GR, Shah OJ, Jeelani H, Kawoosa F, Yousuf T, Afroze D. Evaluation of biomarkers, genetic mutations, and epigenetic modifications in early diagnosis of pancreatic cancer. World J Gastroenterol 2021; 27(36): 6093-6109
- URL: https://www.wjgnet.com/1007-9327/full/v27/i36/6093.htm
- DOI: https://dx.doi.org/10.3748/wjg.v27.i36.6093


