Copyright
©The Author(s) 2021.
World J Gastroenterol. Jul 28, 2021; 27(28): 4722-4737
Published online Jul 28, 2021. doi: 10.3748/wjg.v27.i28.4722
Published online Jul 28, 2021. doi: 10.3748/wjg.v27.i28.4722
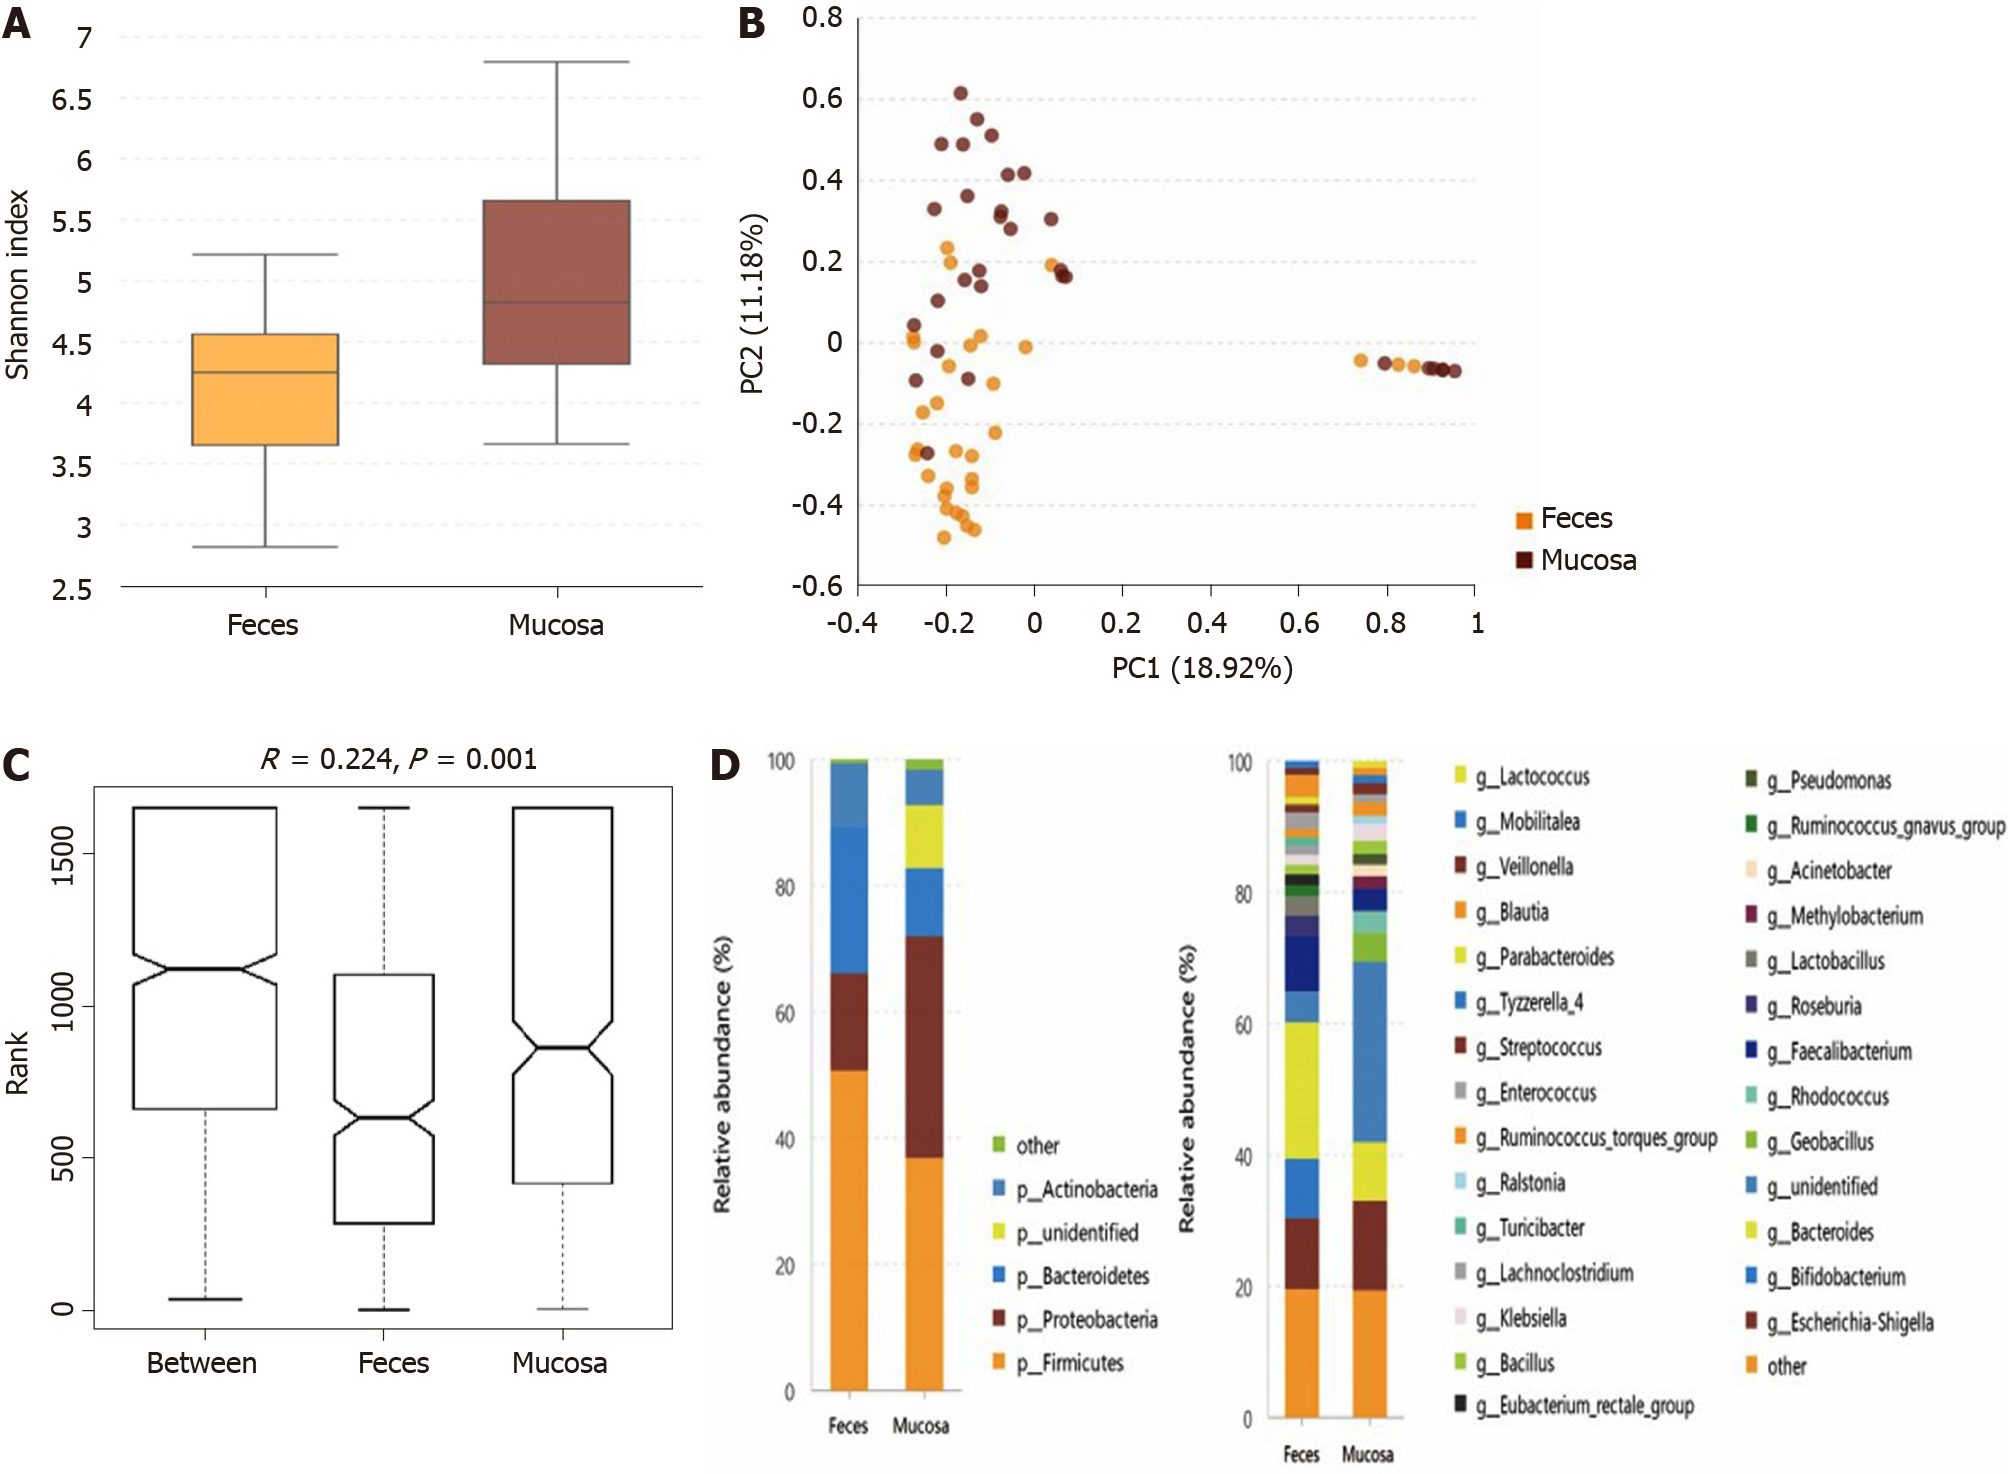
Figure 1 tatistical analysis of the sequencing results of the bacteria microbiota in stool and mucosa samples from patients with ulcerative colitis.
A: The α-diversity of microbiota evaluated by Shannon index. The ordinate shows the Shannon index, and the abscissa shows the sample types. Compared with mucosa samples (Shannon index, 5.04 ± 1.14), the α-diversity of microbiota in fecal samples (Shannon index, 4.08 ± 0.89) was significantly lower (P = 0.001); B: Principal component analysis. The flora structure of mucosa samples and that of stool samples showed an obvious difference (with a PC1 of 18.92% and a PC2 of 11.18%, as showed in the abscissa and ordinate axis separately); C: The analysis of similarities. The intergroup difference (marked as Between) was greater than within group differences (marked as Feces and Mucosa for the two groups) and the result was significant (P = 0.001); D: The relative abundance of the bacteria at the phylum (the left bar graph) and genus (the right bar graph) levels. The ordinate shows the relative abundance (%), and the abscissa axis shows the sample types where the microbiota was sequenced from. At the phylum level, the relative abundance of mucosal Proteobacteria and the unidentified phyla was higher than fecal ones, while the relative abundance of Bacteroidetes and Firmicutes was lower in the mucosa samples. At the genus level, 16 kinds of bacteria genera differed significantly between mucosa and stool samples.
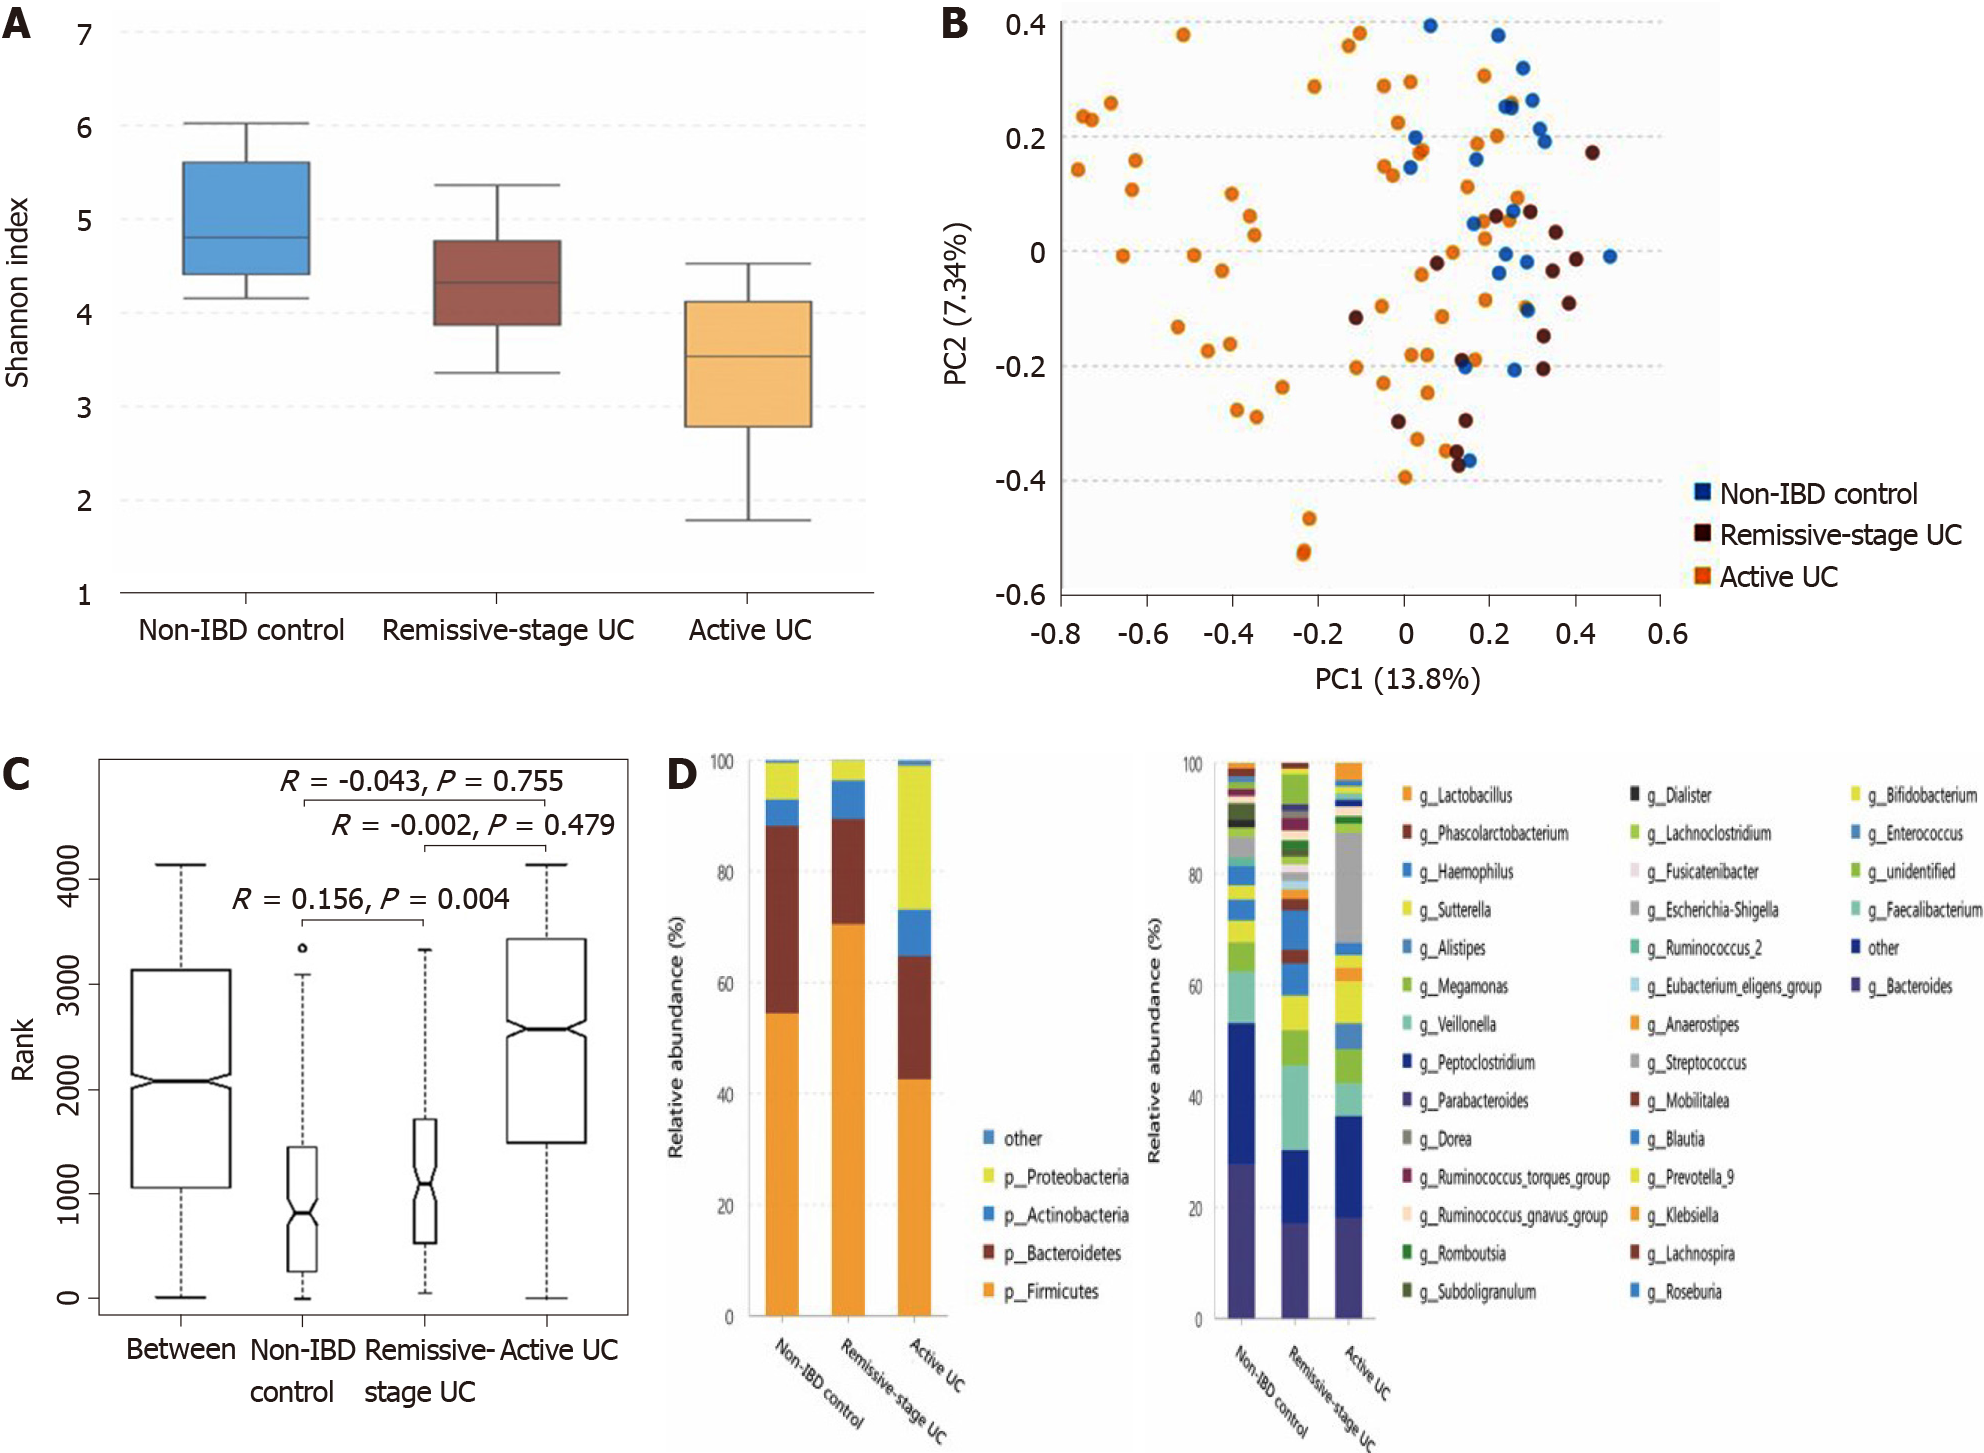
Figure 2 Statistical analysis of the sequencing results of the bacteria microbiota in stool samples from patients with ulcerative colitis and non-inflammatory bowel disease controls.
A: The α-diversity of microbiota evaluated by Shannon index. The ordinate shows the Shannon index, and the abscissa shows the groups. Compared with non-inflammatory bowel disease (IBD) controls (Shannon index, 4.71 ± 0.64), the α-diversity of intestinal microbiota evaluated by Shannon index significantly decreased in the ulcerative colitis (UC) in remission (Shannon index, 4.11 ± 0.74; P = 0.013), as well as in the active patients with UC (Shannon index, 3.20 ± 1.04; P = 0.000). The α-diversity of active UC was also significantly lower than that of UC in remission (P = 0.002); B: Principal component analysis. The flora structure of non-IBD controls and UC in remission group showed an obvious difference (with a PC1 of 13.8% and a PC2 of 7.34%, as showed in the abscissa and ordinate axis separately); C: The analysis of similarities. The intergroup difference between non-IBD controls and UC in remission group was greater than within group differences, and the result was significant (P = 0.004); D: The relative abundance of the bacteria at the phylum (the left bar graph) and genus (the right bar graph) levels. The ordinate shows the relative abundance (%), and the abscissa axis shows the sample types where the microbiota was sequenced from. At the phylum level, the abundance of Proteobacteria significantly increased in active UC but decreased in UC in remission, while that of Firmicutes showed the opposite pattern. The abundance of Bacteroidetes significantly decreased in both active UC and UC in remission groups. At the genus level, compared with non-IBD controls, the relative abundance of Alistipes, Bacteroides, Dialister, and Escherichia-Shigella in UC in remission significantly decreased, while that of Lachnospira increased. The relative abundance of Escherichia-Shigella, Enterococcus, and Peptoclostridium was significantly higher in active UC group than in the non-IBD group, while that of Alistipes, Subdoligranulum, Roseburia, Ruminococcus 2, and Ruminococcus torques group was significantly lower in active patients with UC. When comparing active UC and UC in remission, the relative abundance of Escherichia-Shigella, Enterococcus, Haemophilus, and Klebsiella was higher in the former, while that of Lachnospira, Faecalibacterium, Roseburia, and Blautia was higher in the latter. IBD: Inflammatory bowel disease; UC: Ulcerative colitis.
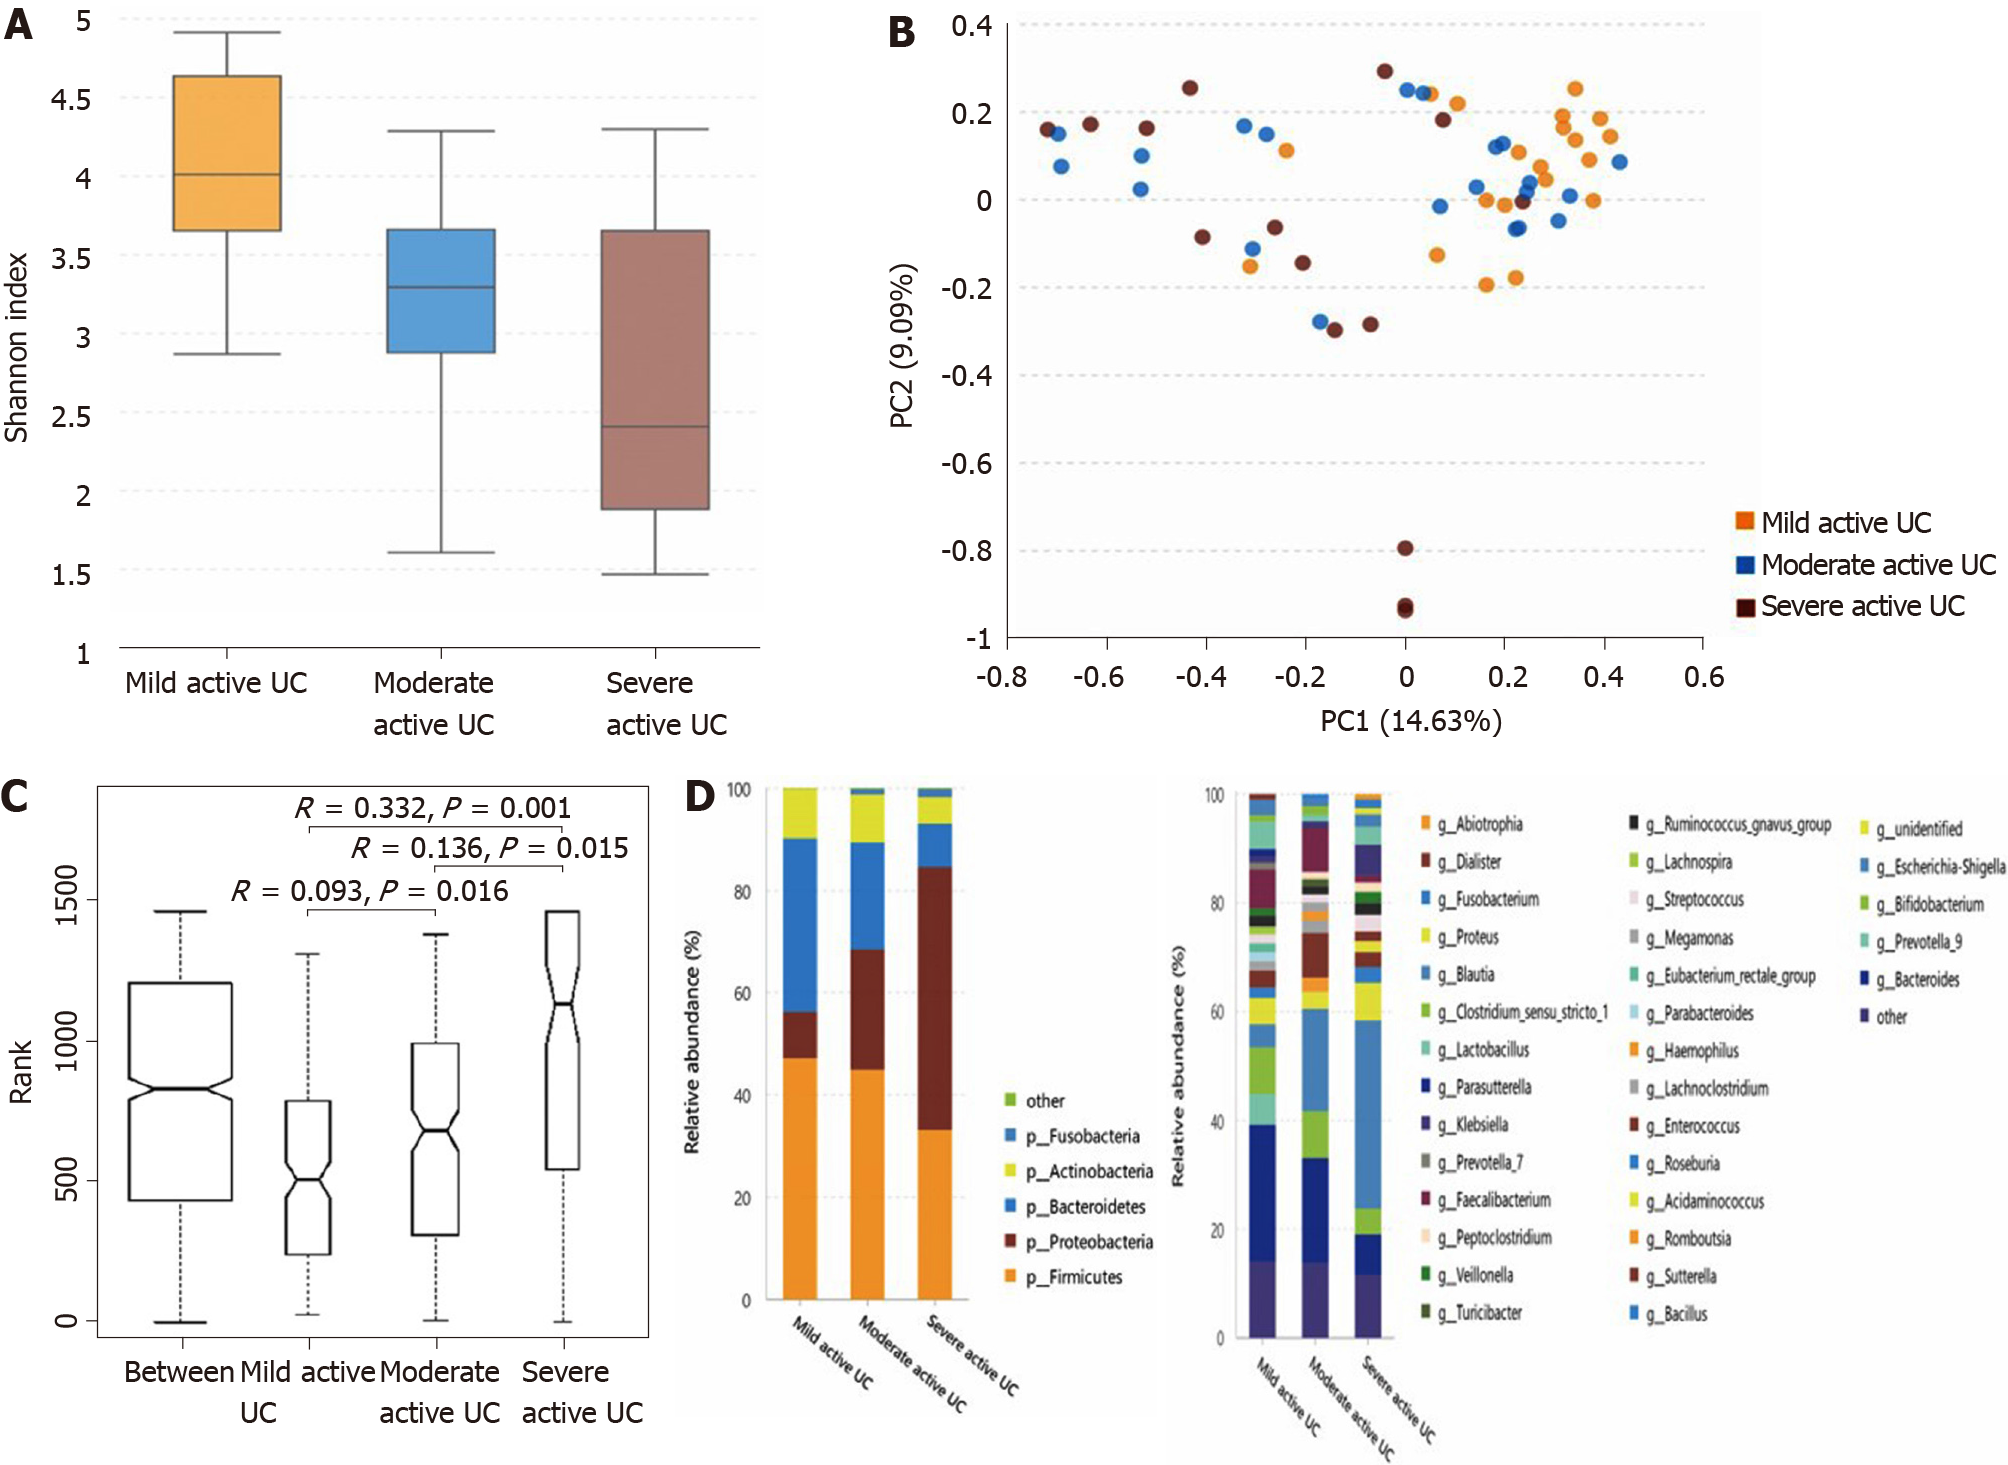
Figure 3 Statistical analysis of the sequencing results of the bacteria microbiota in stool samples from mild, moderate, and severe active ulcerative colitis groups.
A: The α-diversity of microbiota evaluated by Shannon index. The ordinate shows the Shannon index, and the abscissa shows the groups. The α-diversity of the intestinal microbiota gradually decreased along with increasing inflammation degree (the Shannon index of mild, moderate, and severe active ulcerative colitis (UC) was 3.74 ± 0.84, 3.08 ± 0.95, and 2.66 ± 1.14, respectively), and the difference between the mild and moderate groups (P = 0.025), and between the mild and severe groups (P = 0.003) was significant, although that between it was not significantly between the moderate and severe groups (P = 0.235); B: Principal component analysis. The flora structure of mild, moderate, and severe active UC groups showed an obvious difference (with a PC1 of 14.63% and a PC2 of 9.09%, as showed in the abscissa and ordinate axis separately); C: The analysis of similarities. The intergroup differences between any two of these groups were significant (P = 0.016 between the mild and the moderate stage group, P = 0.015 between the moderate and the severe stage group, and P = 0.001 between the mild and the severe stage group); D: The relative abundance of the bacteria at the phylum (the left bar graph) and genus (the right bar graph) levels. The ordinate shows the relative abundance (%), and the abscissa axis shows the sample types where the microbiota was sequenced from. At the phylum level, the abundance of Proteobacteria showed a significant trend of increase with a deteriorating disease condition, and that of Bacteroidetes gradually decreased, though only the difference between mild and severe subgroups was obvious. At the genus level, some bacteria genera that differed significantly between non-inflammatory bowel disease (IBD) controls and active patients with UC displayed a consistent changing pattern when the disease condition was getting worse, including a further increase of Escherichia-Shigella in moderate-severe active UC and an obvious reduction of Faecalibacterium, Roseburia, and Bacteroides in severe active UC. The relative abundance of Eubacterium rectale group gradually decreased when the inflammation worsened though this genus did not differ significantly between non-IBD controls and patients with UC. Decreased Blautia in moderate active UC and reduced Parasutterella and Lachnospira in severe active UC compared with the mild group were also observed. UC: Ulcerative colitis.
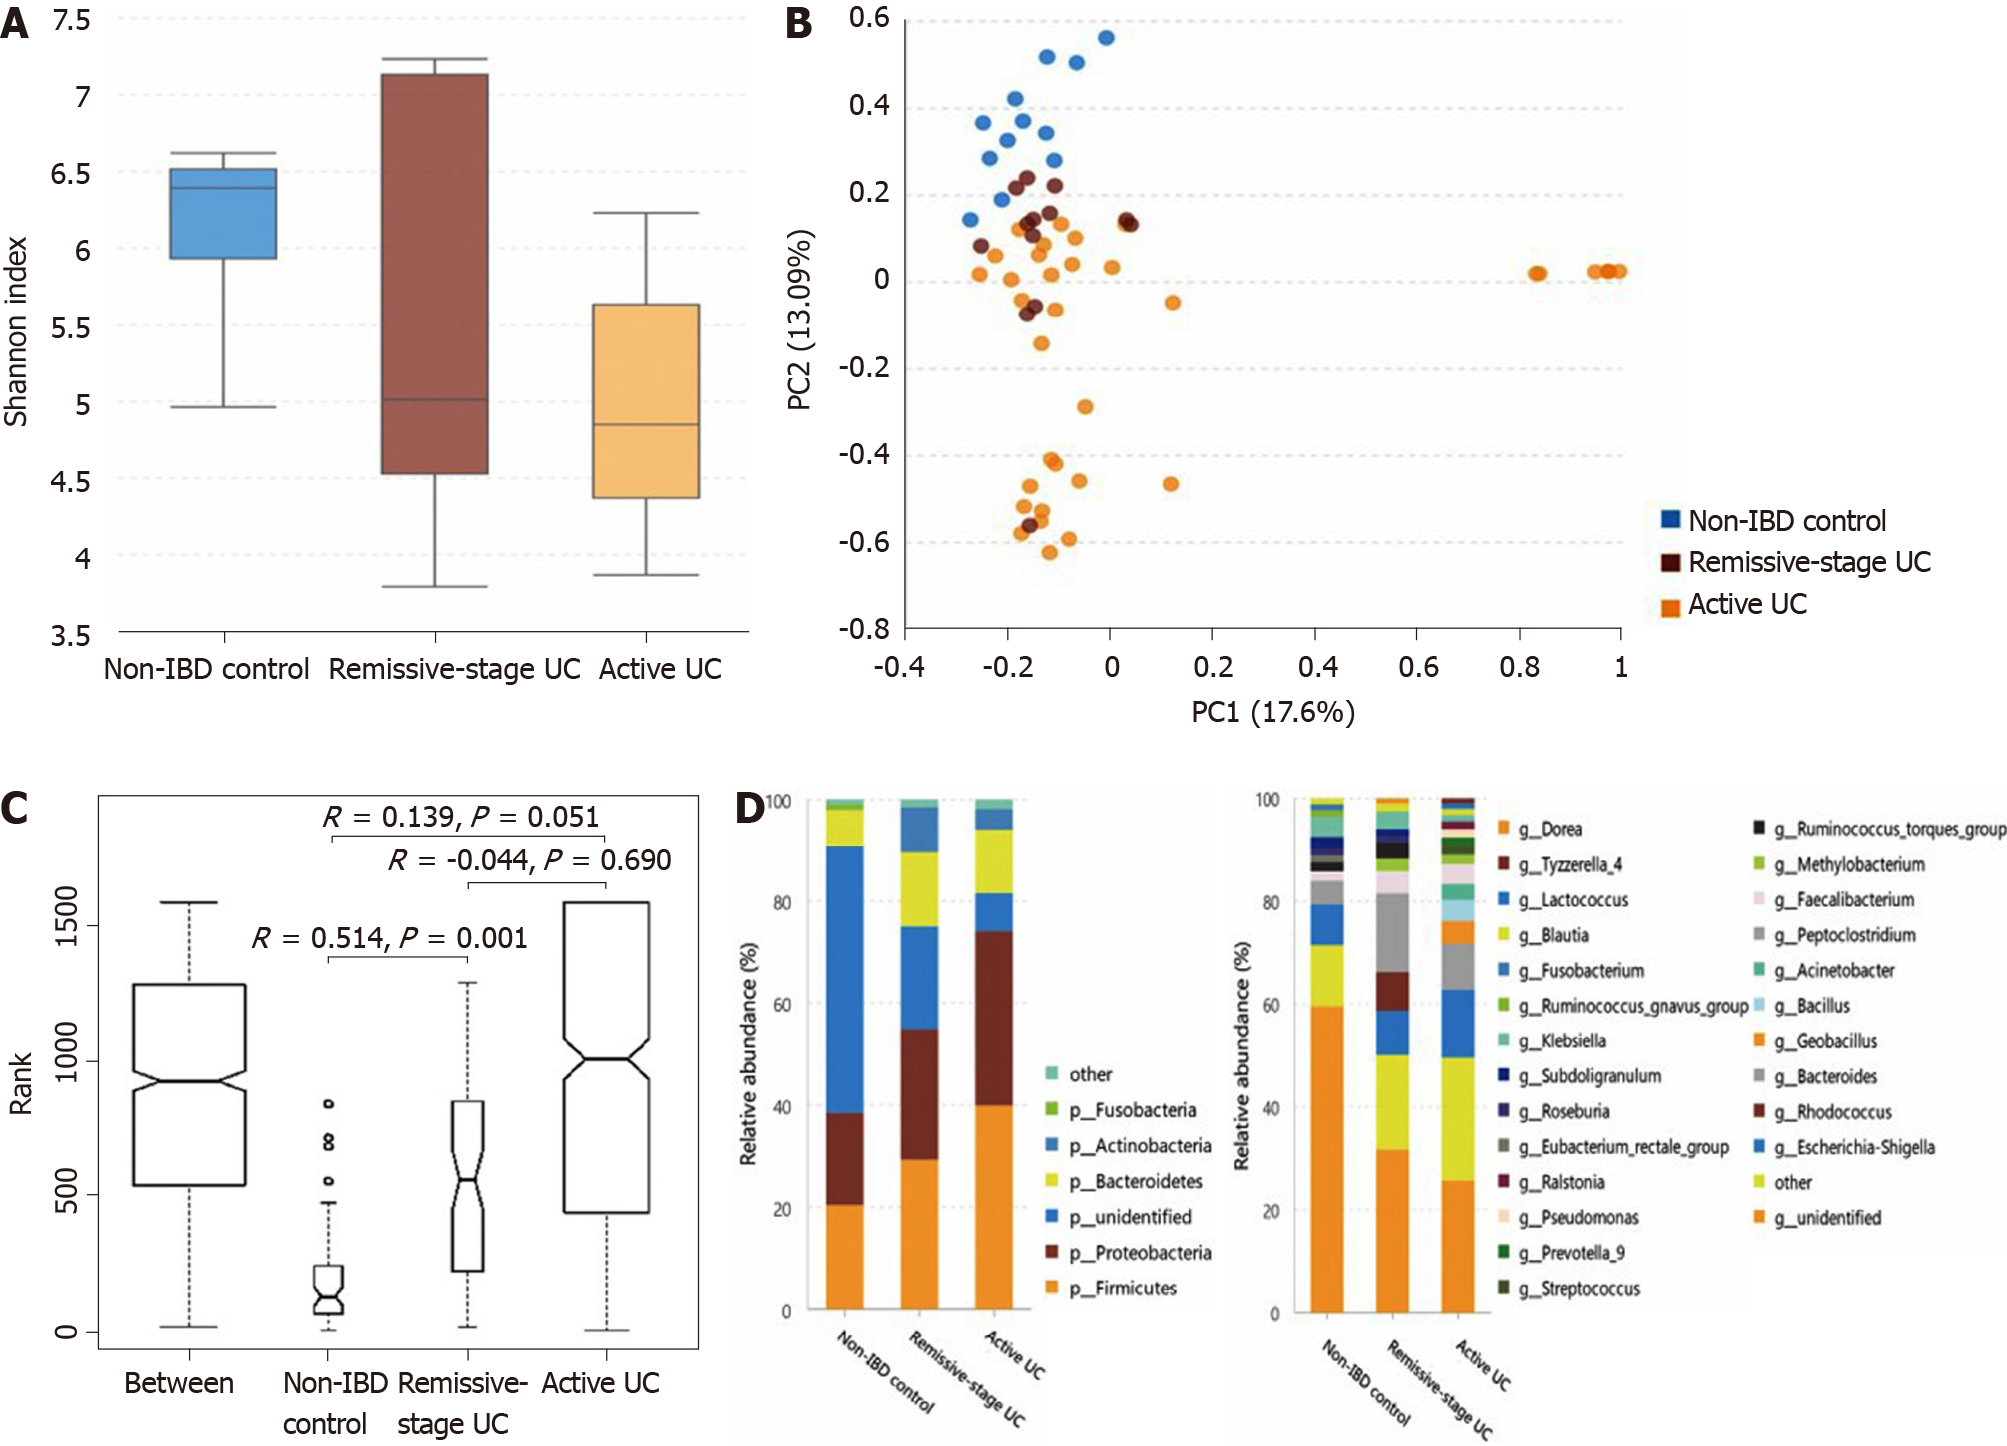
Figure 4 Statistical analysis of the sequencing results of the bacteria microbiota in mucosa samples from patients with ulcerative colitis and non-inflammatory bowel disease controls.
A: The α-diversity of microbiota evaluated by Shannon index. The ordinate shows the Shannon index, and the abscissa shows the groups. The α-diversity of mucosal microbiota in non-inflammatory bowel disease (IBD) controls (Shannon index, 6.12 ± 0.70) was similar to that in ulcerative colitis (UC) in remission (Shannon index, 5.63 ± 1.53; P = 0.682) but significantly higher than that of the active UC group (4.99 ± 1.02; P = 0.001). And the α-diversity of UC in remission and active UC showed little difference (P = 0.453); B: Principal component analysis. The flora structure of non-IBD controls was different from that of either UC group (with a PC1 of 17.6% and a PC2 of 13.09%, as showed in the abscissa and ordinate axis separately); C: The analysis of similarities. The intergroup difference between controls and UC in remission was significant (P = 0.001); D: The relative abundance of the bacteria at the phylum (the left bar graph) and genus (the right bar graph) levels. The ordinate shows the relative abundance (%), and the abscissa axis shows the sample types where the microbiota was sequenced from. At the phylum level, compared with non-IBD controls, the relative abundance of Firmicutes and Proteobacteria significantly increased in active UC, and that of Actinobacteria was significantly higher in both the active UC and UC in remission groups. The relative abundance of unidentified bacterial phyla obviously decreased in UC in remission and further decreased in active UC. At the genus level, the relative abundance of Geobacillus, Lactococcus, Pseudomonas, Methylobacterium, Acinetobacter, Streptococcus, Bacillus, and Ralstonia increased in active UC compared with non-IBD controls, while that of Ruminococcus torques group and unidentified bacteria genera decreased. When comparing the non-IBD controls and UC in remission, the relative abundance of Eubacterium rectale group and unidentified genera was lower in the latter while that of Methylobacterium, Rhodococcus, Peptoclostridium, and Faecalibacterium was higher. The difference between active UC and UC in remission was also obvious and more Geobacillus, Lactococcus, Pseudomonas, Streptococcus, Bacillus, Ralstonia, and Prevotella group 9 were observed in active patients with UC. IBD: Inflammatory bowel disease; UC: Ulcerative colitis.
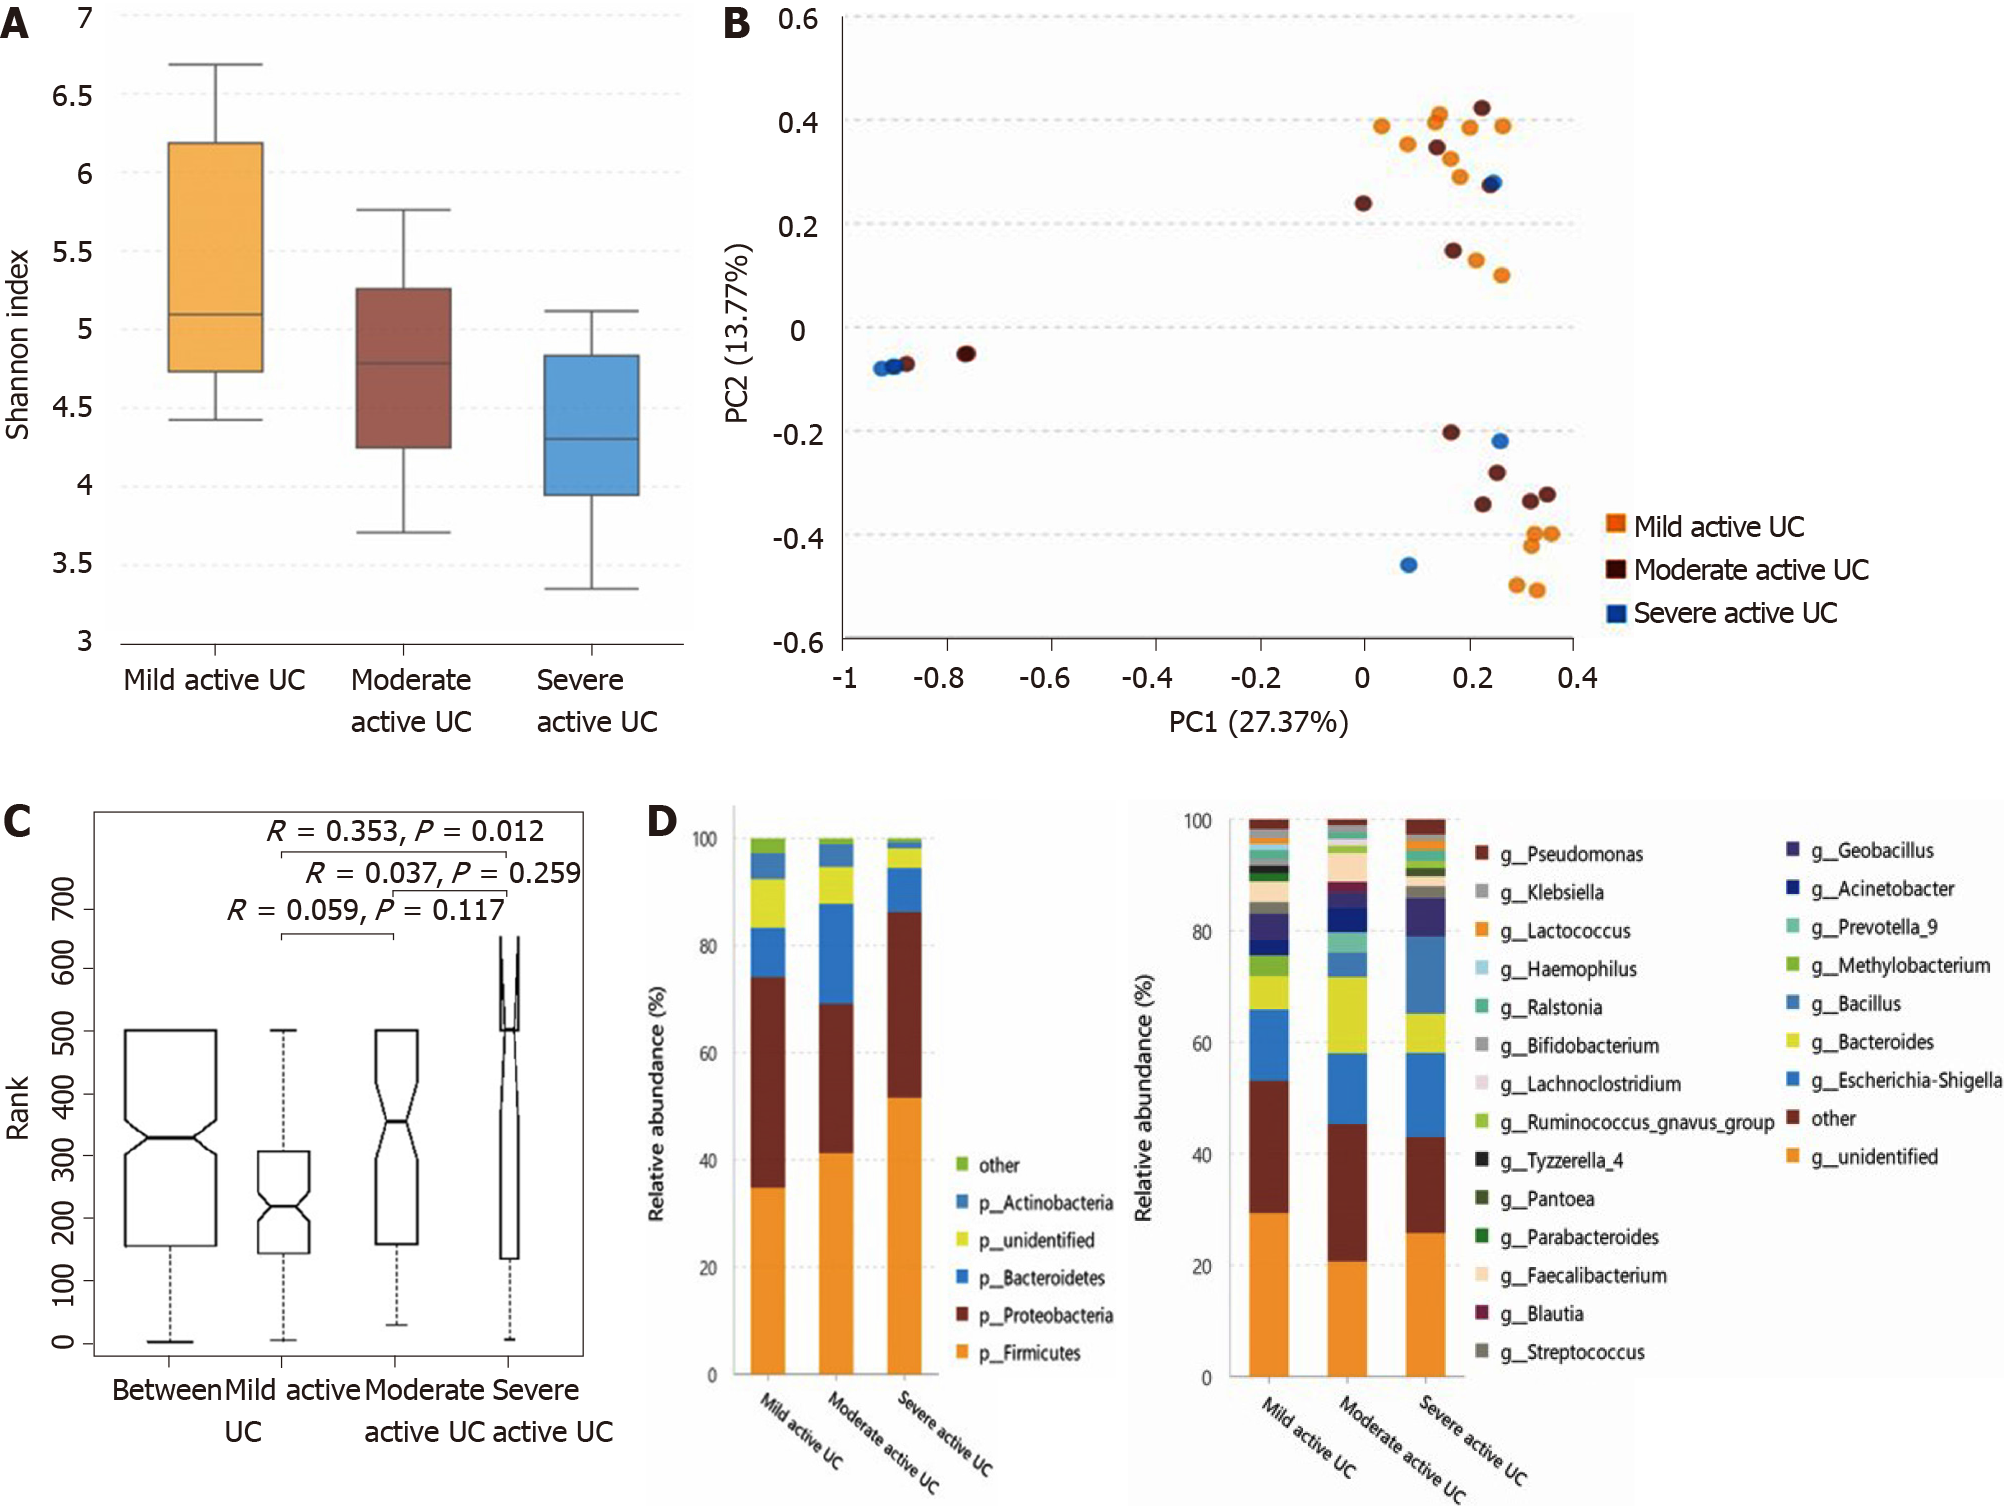
Figure 5 Statistical analysis of the sequencing results of the bacteria microbiota in mucosa samples from mild, moderate, and severe active ulcerative colitis groups.
A: The α-diversity of microbiota evaluated by Shannon index. The ordinate shows the Shannon index, and the abscissa shows the groups. The α-diversity of mucosal bacteria in severe active ulcerative colitis (UC) (Shannon index, 3.67 ± 1.25) was significantly lower than that of mild active UC (Shannon index, 5.40 ± 1.01; P = 0.017). Little difference was observed between the mild and moderate groups (Shannon index 4.80 ± 0.90; P = 0.100), neither between the moderate and severe ones (P = 0.251); B: Principal component analysis. The flora structure of mild and severe subgroups showed a significant difference (with a PC1 of 27.37% and a PC2 of 13.77%, as showed in the abscissa and ordinate axis separately); C: The analysis of similarities. The intergroup difference between mild and severe groups was significant (P = 0.012); D: The relative abundance of the bacteria at the phylum (the left bar graph) and genus (the right bar graph) levels. The ordinate shows the relative abundance (%), and the abscissa axis shows the sample types where the microbiota was sequenced from. At the phylum level, the relative abundance of Actinobacteria of severe active UC was significantly lower than that of mild/moderate UC, and fewer unidentified bacteria phyla were observed in severe UC than in mild UC. At the genus level, the relative abundance of Methylobacterium in mild UC was significantly higher than that in moderate/severe UC, and Blautia significantly decreased in severe UC compared with the other two groups. UC: Ulcerative colitis.
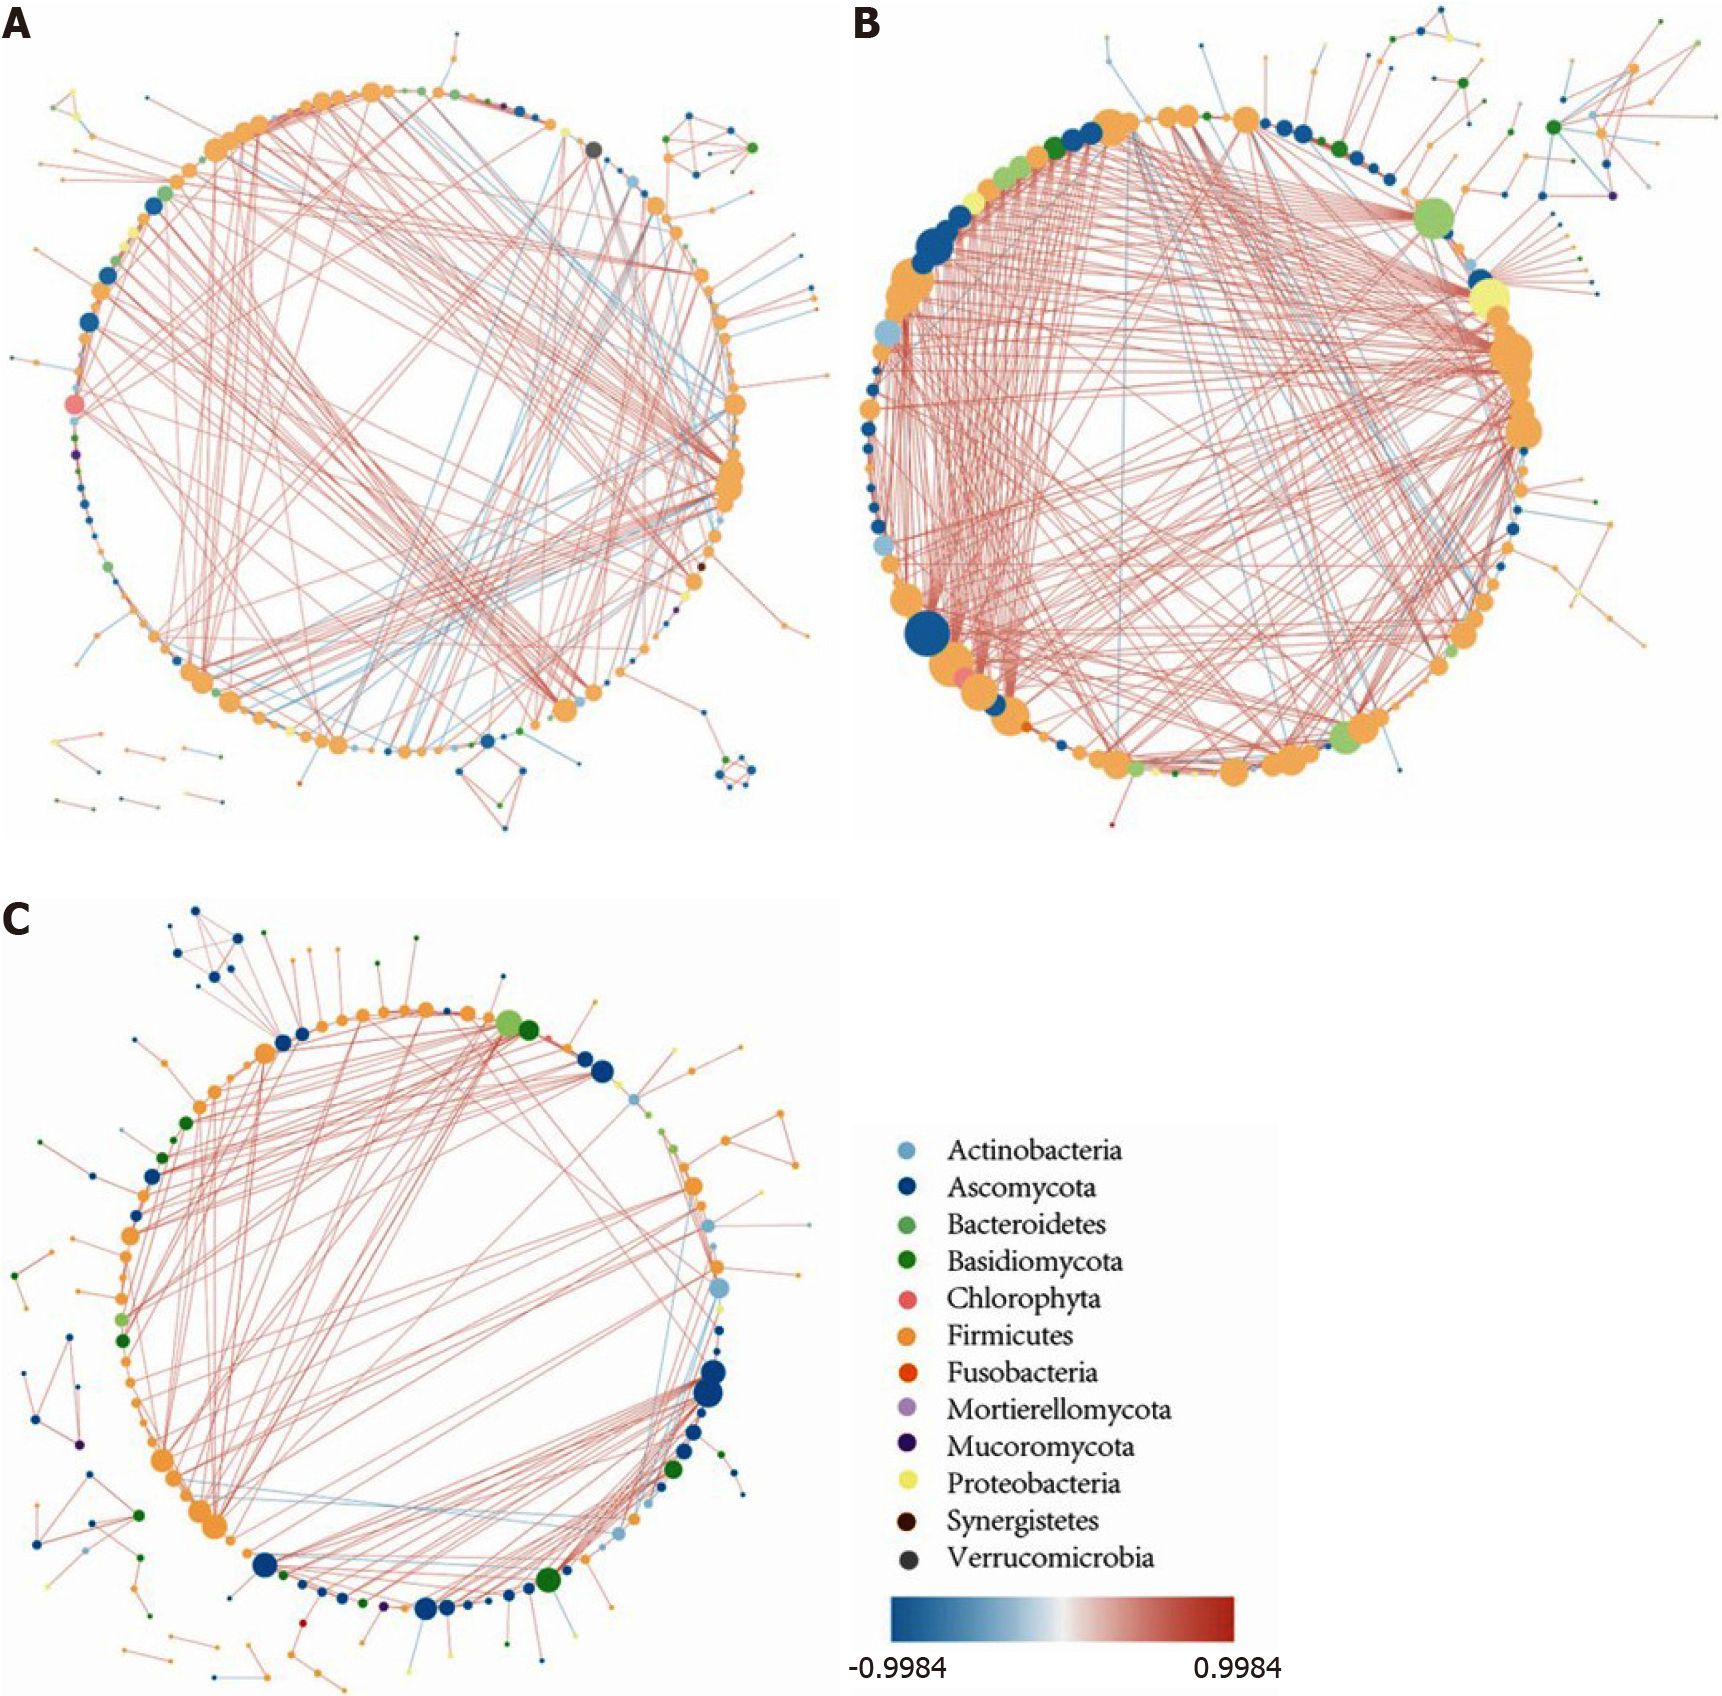
Figure 6 The intestinal microbiota correlation network.
A: The intestinal microbiota correlation network of non-inflammatory bowel disease controls; B: The intestinal microbiota correlation network of ulcerative colitis (UC) in remission; C: The intestinal microbiota correlation network of active UC. The network was constructed based on Spearman correlation coefficient analysis and the software Cytoscape v3.7.0., and only the significant correlations are shown (P < 0.05). Each node represents one microbial genus and its color represents the phylum that it belongs to. The size of the node is equal to the number of correlated pairs that it evolves. The depth of color of the line connecting two nodes reveals the strength of the association. The red color indicates positive correlations and the blue color indicates negative correlations. Compared with controls, the number of significant correlations increased in UC in remission but decreased in active UC. The most obvious change occurred in the number of bacteria-fungi correlations, while the number of fungi-fungi correlations was insignificant among the three groups.
- Citation: He XX, Li YH, Yan PG, Meng XC, Chen CY, Li KM, Li JN. Relationship between clinical features and intestinal microbiota in Chinese patients with ulcerative colitis. World J Gastroenterol 2021; 27(28): 4722-4737
- URL: https://www.wjgnet.com/1007-9327/full/v27/i28/4722.htm
- DOI: https://dx.doi.org/10.3748/wjg.v27.i28.4722


