Copyright
©The Author(s) 2021.
World J Gastroenterol. Apr 14, 2021; 27(14): 1419-1434
Published online Apr 14, 2021. doi: 10.3748/wjg.v27.i14.1419
Published online Apr 14, 2021. doi: 10.3748/wjg.v27.i14.1419
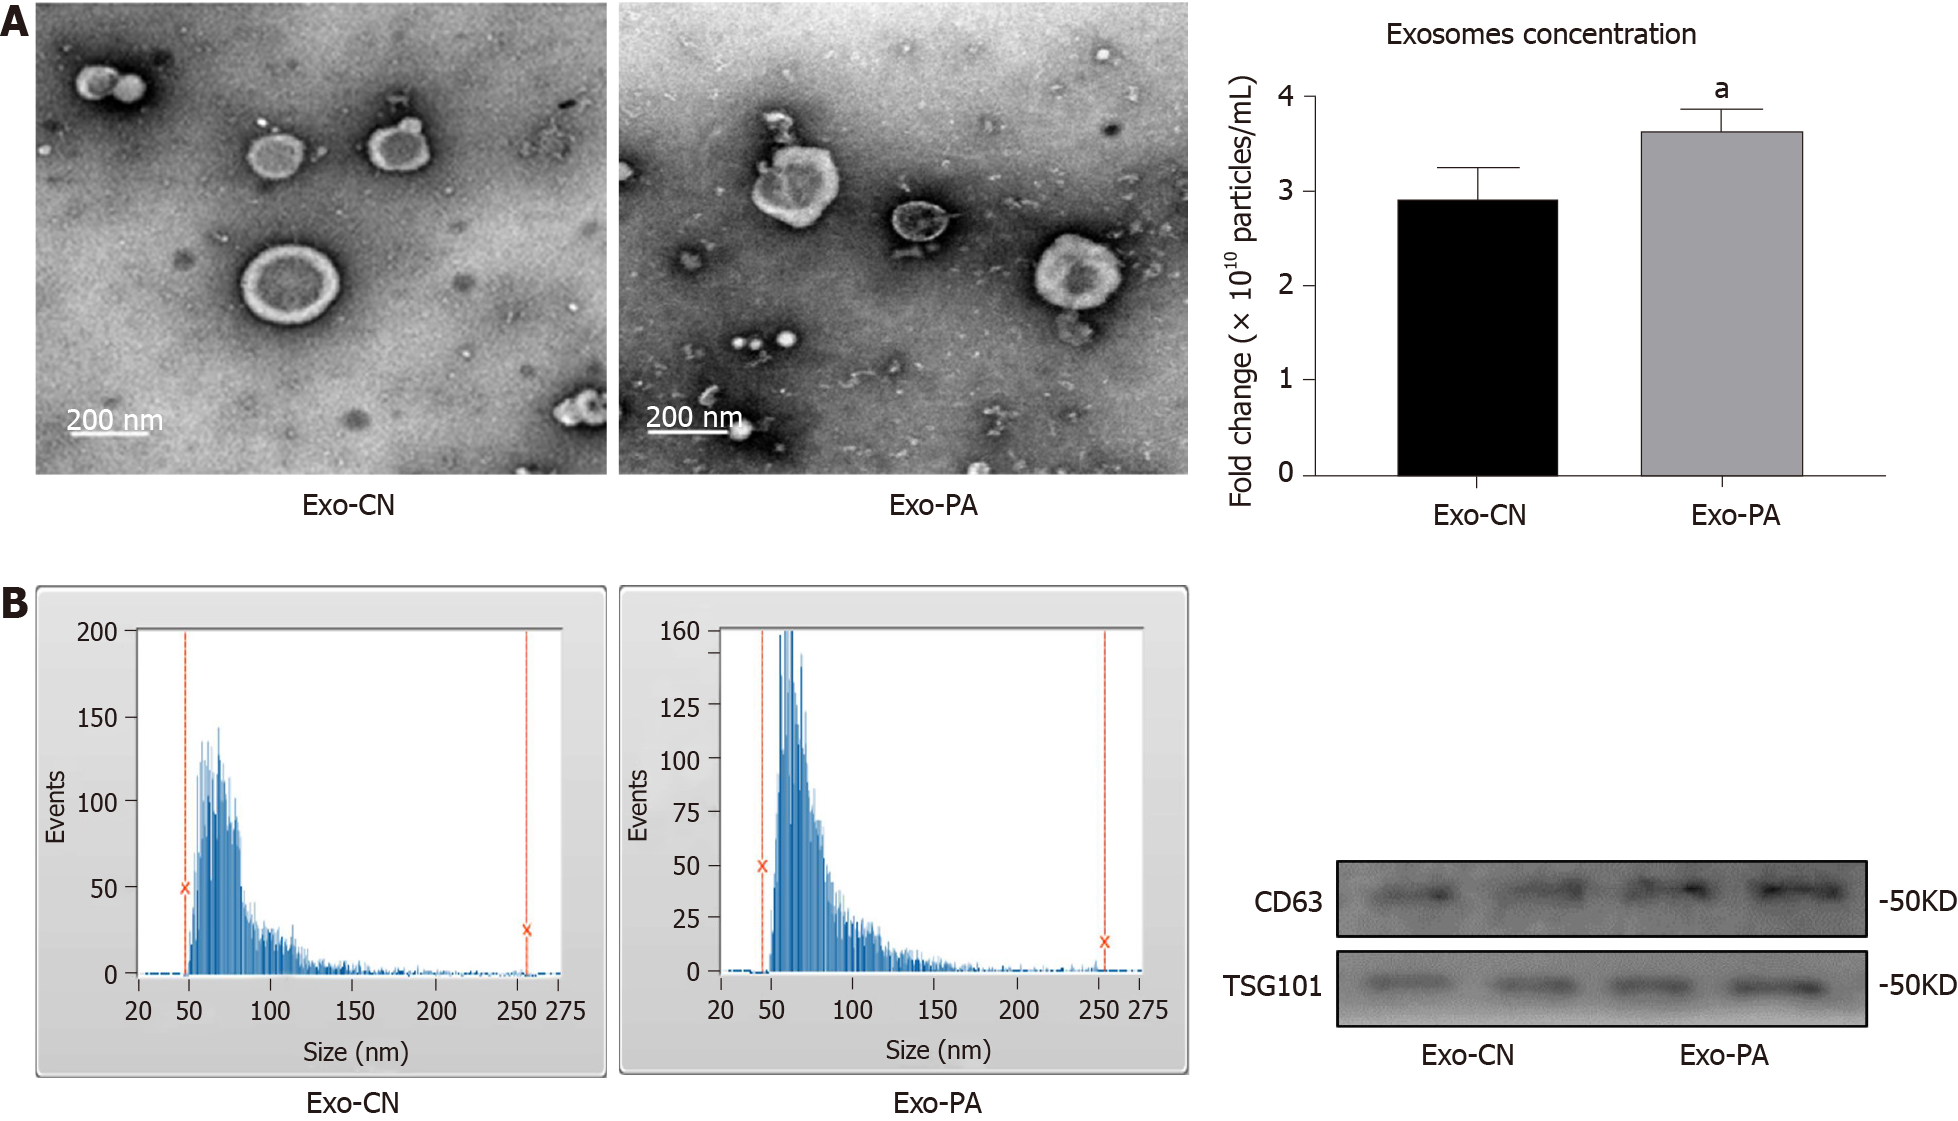
Figure 1 Identification of exosomes derived from primary hepatocytes.
A: Exosomes derived from primary hepatocytes (Exo-PHC) were visualized by electronic microscopy (× 30000); B: Nanoparticle tracking analysis for Exo-PHC; C: The concentration of Exo-PHC was measured. Exosomes derived from vehicle control (Exo-CN) treated PHC: 2.92 ± 0.32 × 10¹⁰ particles/mL vs exosomes derived from palmitic acid (Exo-PA) treated PHC: 3.62 ± 0.22 × 10¹⁰ particles/mL; D: Exosomal markers CD63 and TSG101 were detected by western blot in Exo-PHC. Statistical significance, aP < 0.05.
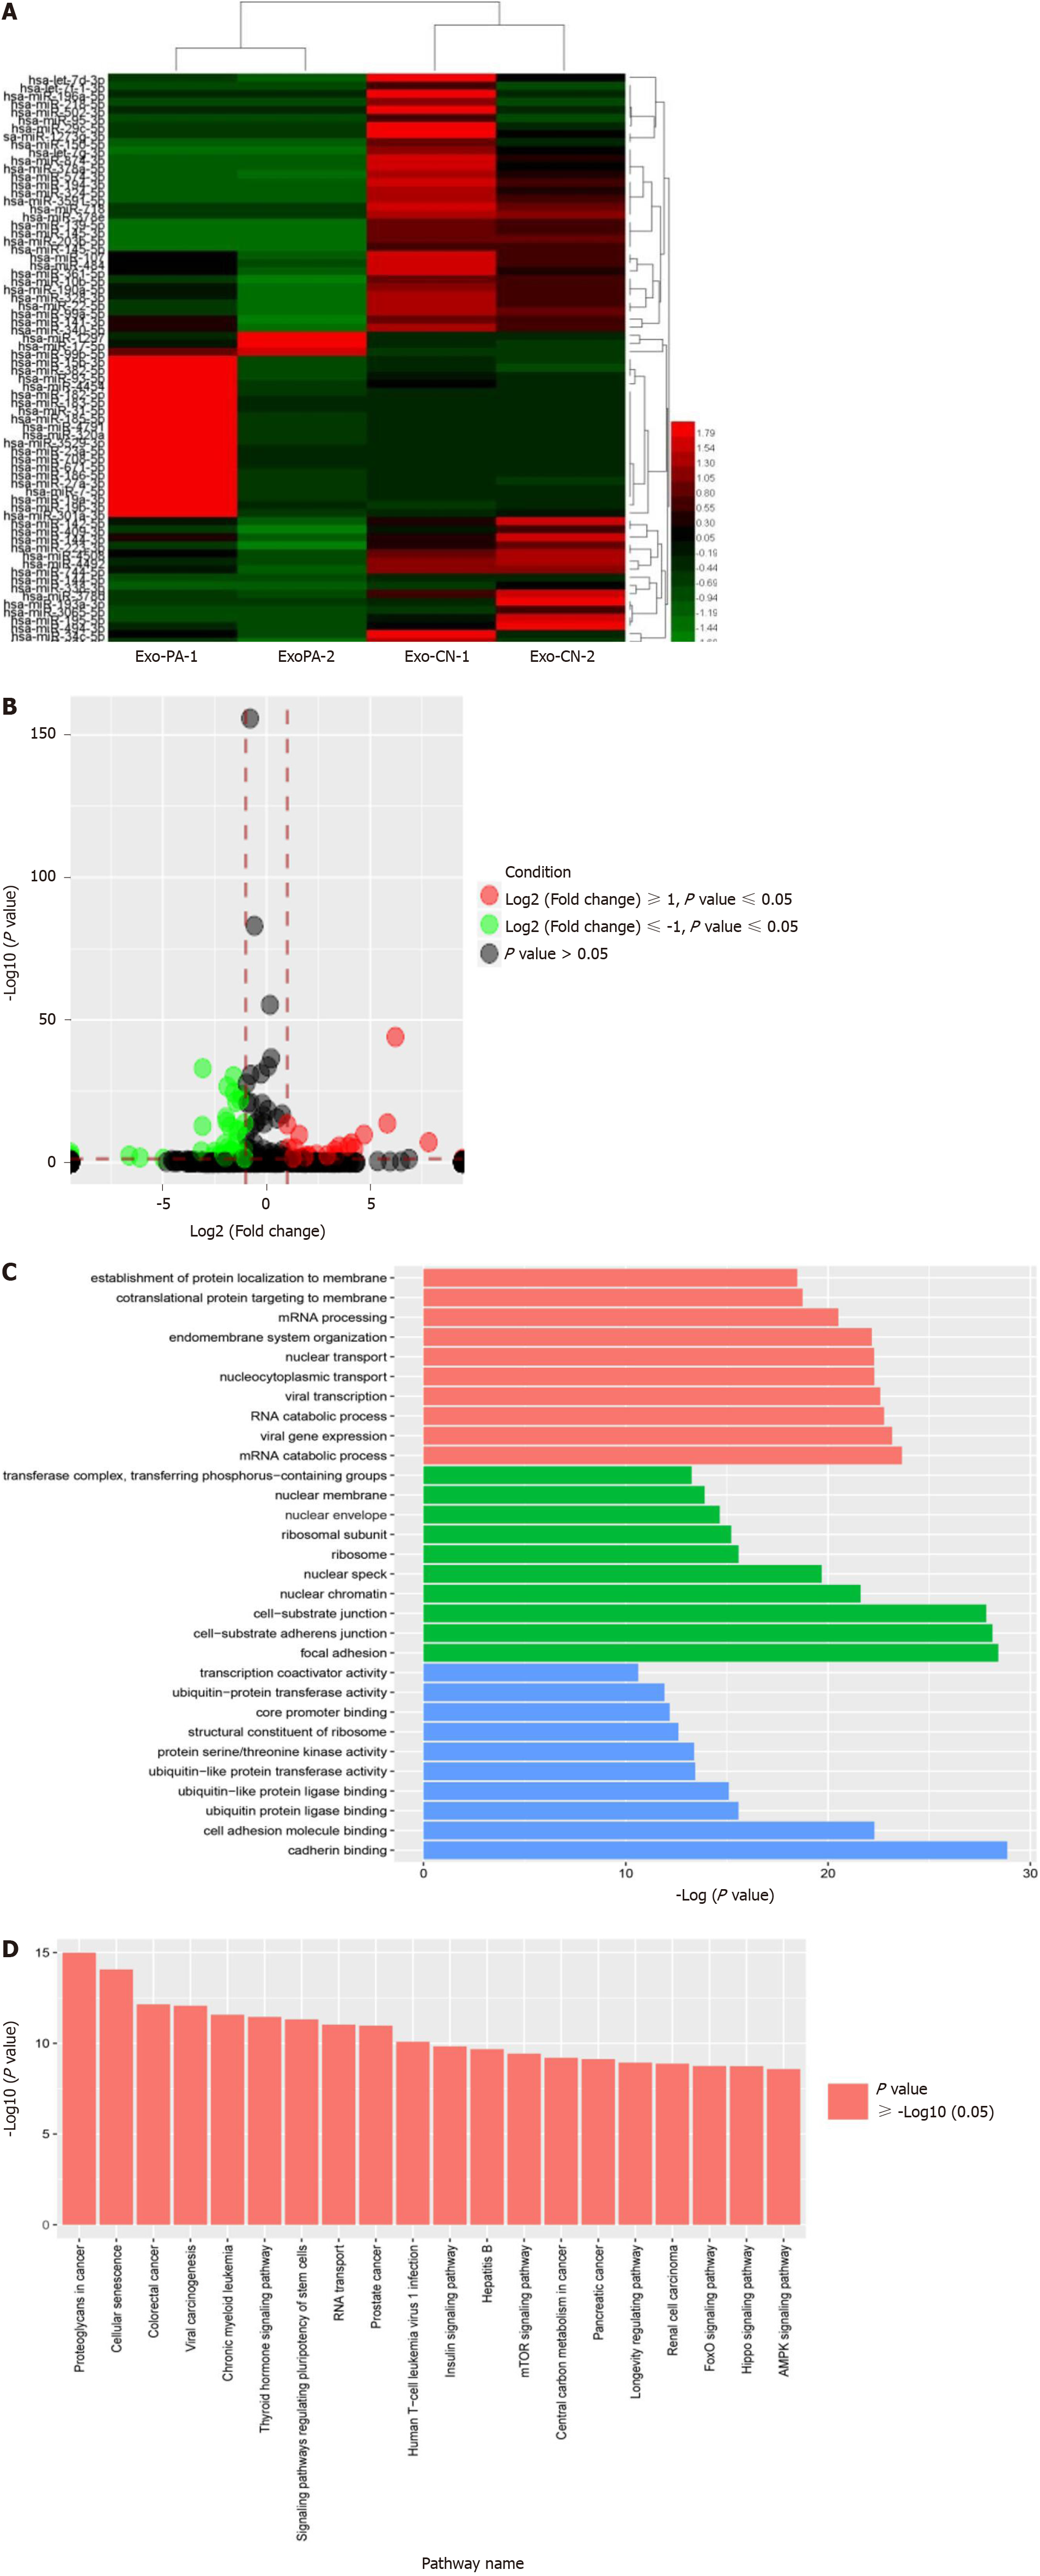
Figure 2 MicroRNA sequencing profiling and bioinformatic analysis.
A: Heatmap of differentially-expressed microRNAs (DE-miRs) in the microRNA sequencing; B: Volcano map of DE-miR expression in the miRNA sequencing; C: GO function analysis for target genes regulated by DE-miRs; D: Kyoto Encyclopedia of Genes and Genomes pathway enrichment analysis of target genes for the DE-miR. Exo-PA-1/Exo-PA-2: Group 1/2 of exosomes derived from palmitic acid treated primary hepatocytes; Exo-CN-1/Exo-CN-2: Group 1/2 of exosomes derived from vehicle control treated primary hepatocytes.
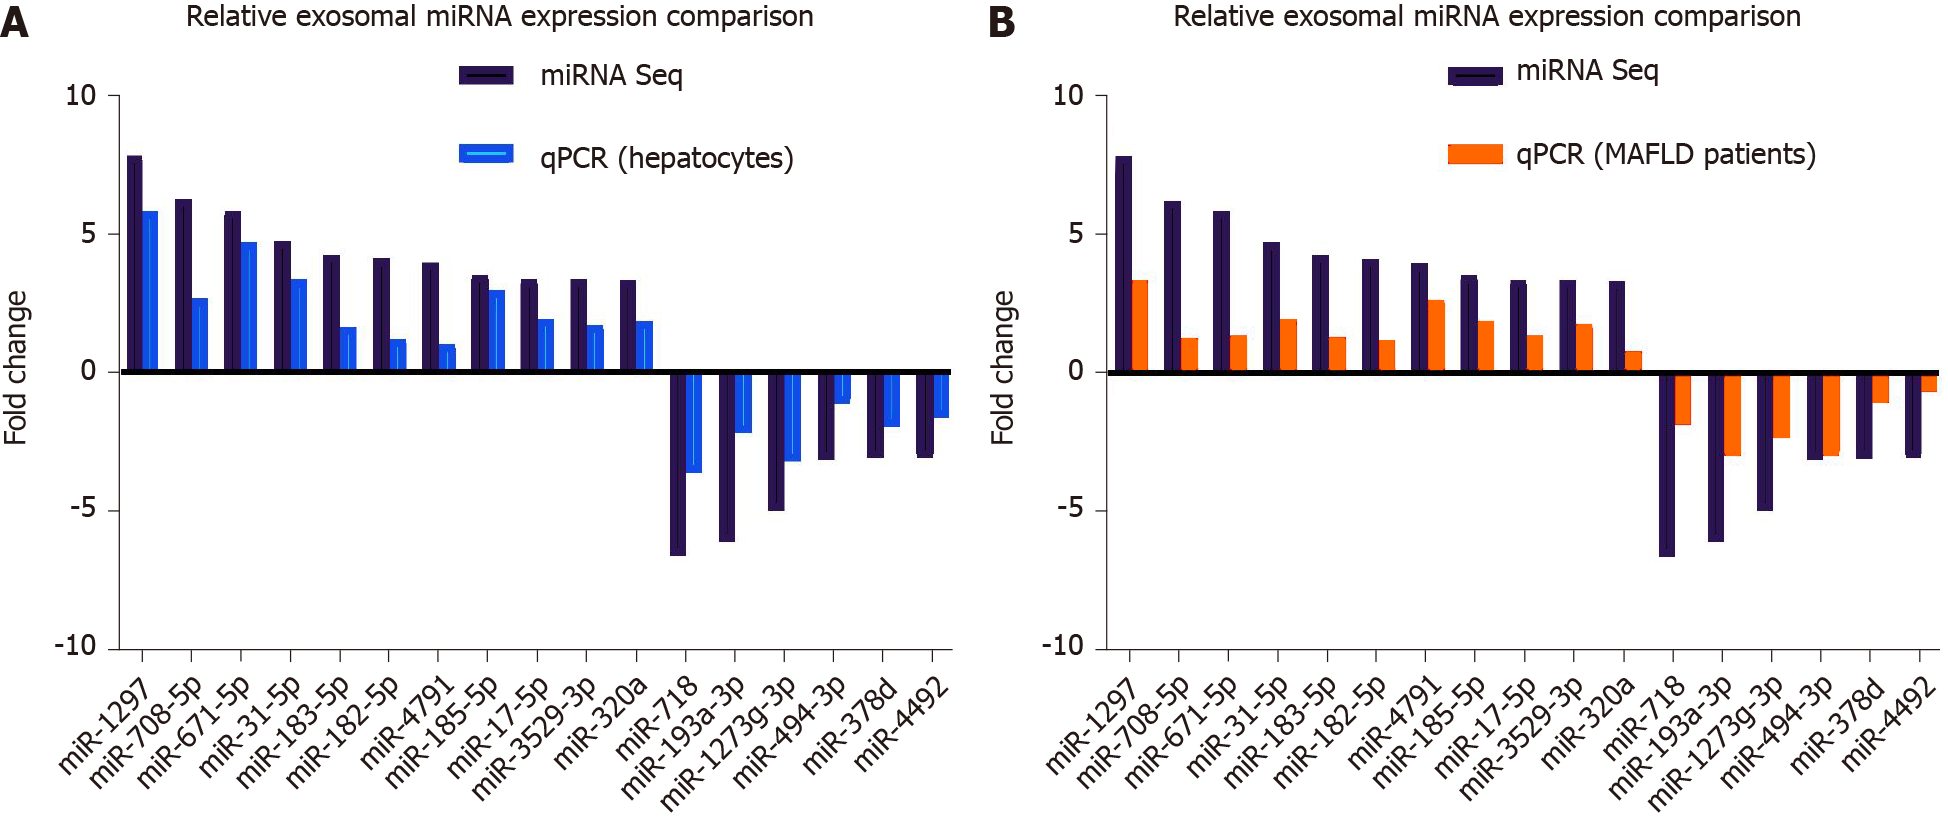
Figure 3 Quantitative real-time PCR analysis verification for differentially expressed microRNAs in exosomes derived from primary hepatocytes and patient serum samples of metabolic-associated fatty liver disease.
A: Quantitative real-time PCR was performed on exosomes derived from vehicle control treated primary hepatocyte and palmitic acid treated primary hepatocyte. The fold change ratio of microRNA (miRNA) in the Exo-PA group was compared to the result of differentially expressed miRNAs in the miRNA sequencing (miRNA seq). Detailed data of individual miRNA expression could be seen Supplementary Table 2; B: Quantitative real-time (q)PCR was performed between mild and severe fatty liver human serum exosome samples. The fold change ratio of miRNA in severe fatty liver were compared to the result of the differentially expressed miRNAs of the miRNA sequencing. Detailed data of individual miRNA expression could be seen Supplementary Table 2. MAFLD: Metabolic-associated fatty liver disease.
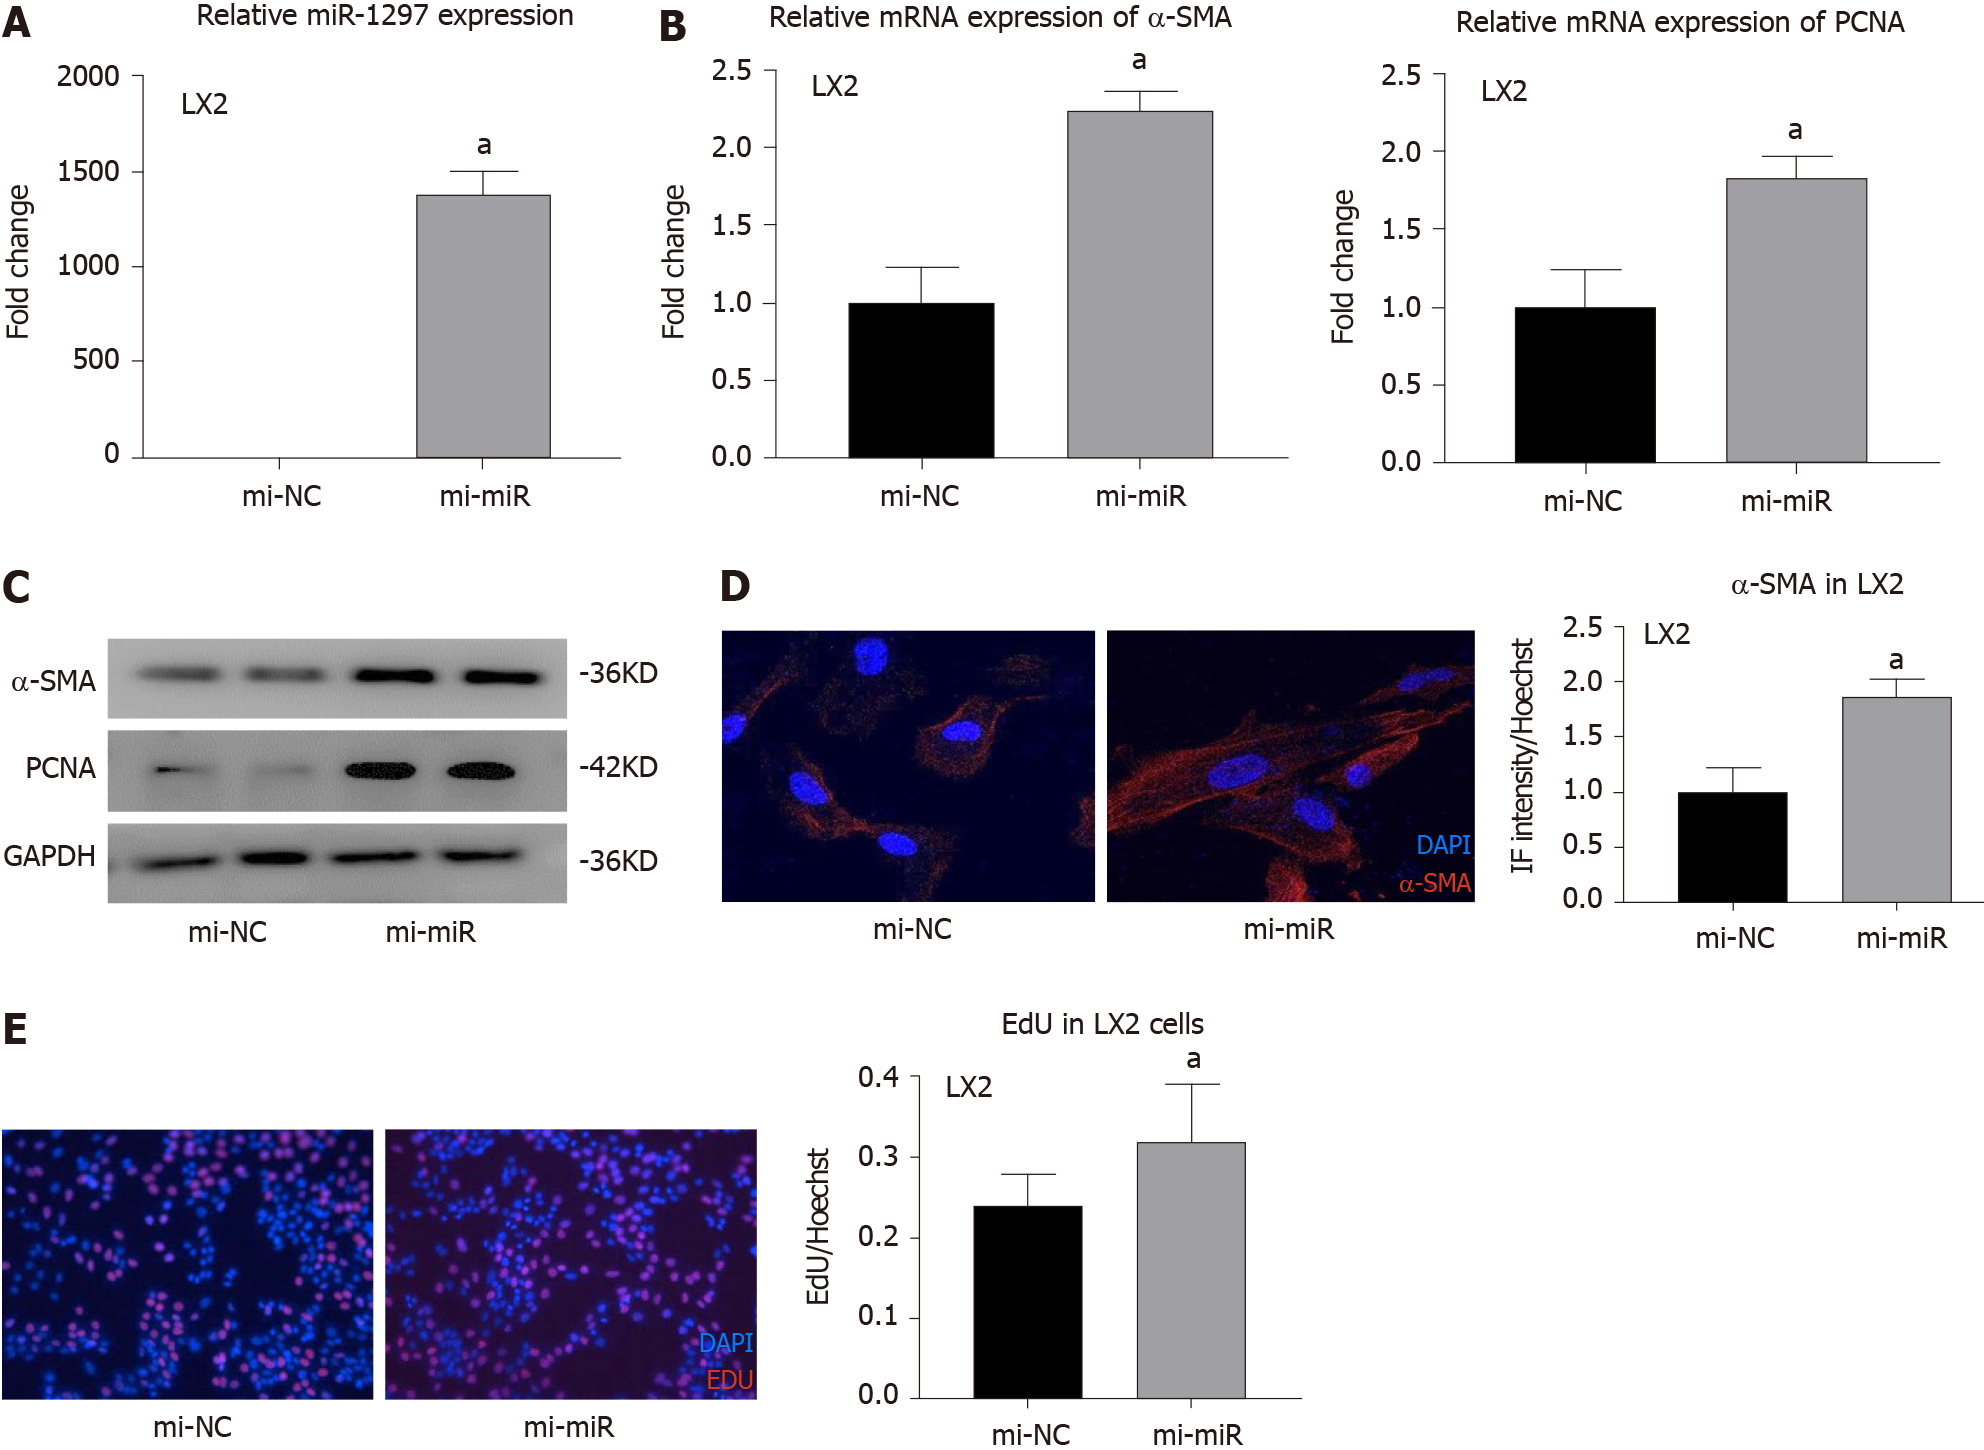
Figure 4 MicroR-1297 promoted hepatic stellate cell activation and proliferation by targeting the PTEN signaling pathway.
A: The transfection efficiency of 50 nM miR-1297 mimics in LX2 cells was assessed by quantitative real-time PCR. microRNA mimics of negative controls (mi-NC): 1.00 ± 0.12 vs miR-1297 mimics (mi-miR): 1380.25 ± 121.16; B: Relative mRNA expression of α-SMA (the activation marker of hepatic stellate cells) and PCNA (the proliferation marker of hepatic stellate cells) were assessed by quantitative real-time PCR. α-SMA: mi-NC: 1.00 ± 0.23 vs mi-miR: 2.24 ± 0.12; PCNA: mi-NC: 1.00 ± 0.25 vs mi-miR: 1.83 ± 0.14; C: Relative protein expression of α-SMA, PCNA, PTEN, PI3K, AKT and p-AKT were assessed by western blot after treatment of 50 nmol/L miR-1297 mimics for 48 h; D: Immunofluorescence staining of α-SMA was performed to evaluate the activation of LX2 cells after 50 nmol/L miR-1297 mimics for 48 h. mi-NC: 1.00 ± 0.22 vs mi-miR: 1.87 ± 0.15, Bar = 200 μm; E: Ethynyl-20-deoxyuridine test was performed to evaluate the proliferation of LX2 cells after 50 nmol/L miR-1297 mimics for 48 h. mi-NC: 0.24 ± 0.04 vs mi-miR: 0.32 ± 0.07, Bar = 50 μm. Statistical significance, aP < 0.05. DAPI: 4’6-Diamidino-2-phenylindole; EdU: Ethynyl-20-deoxyuridine.
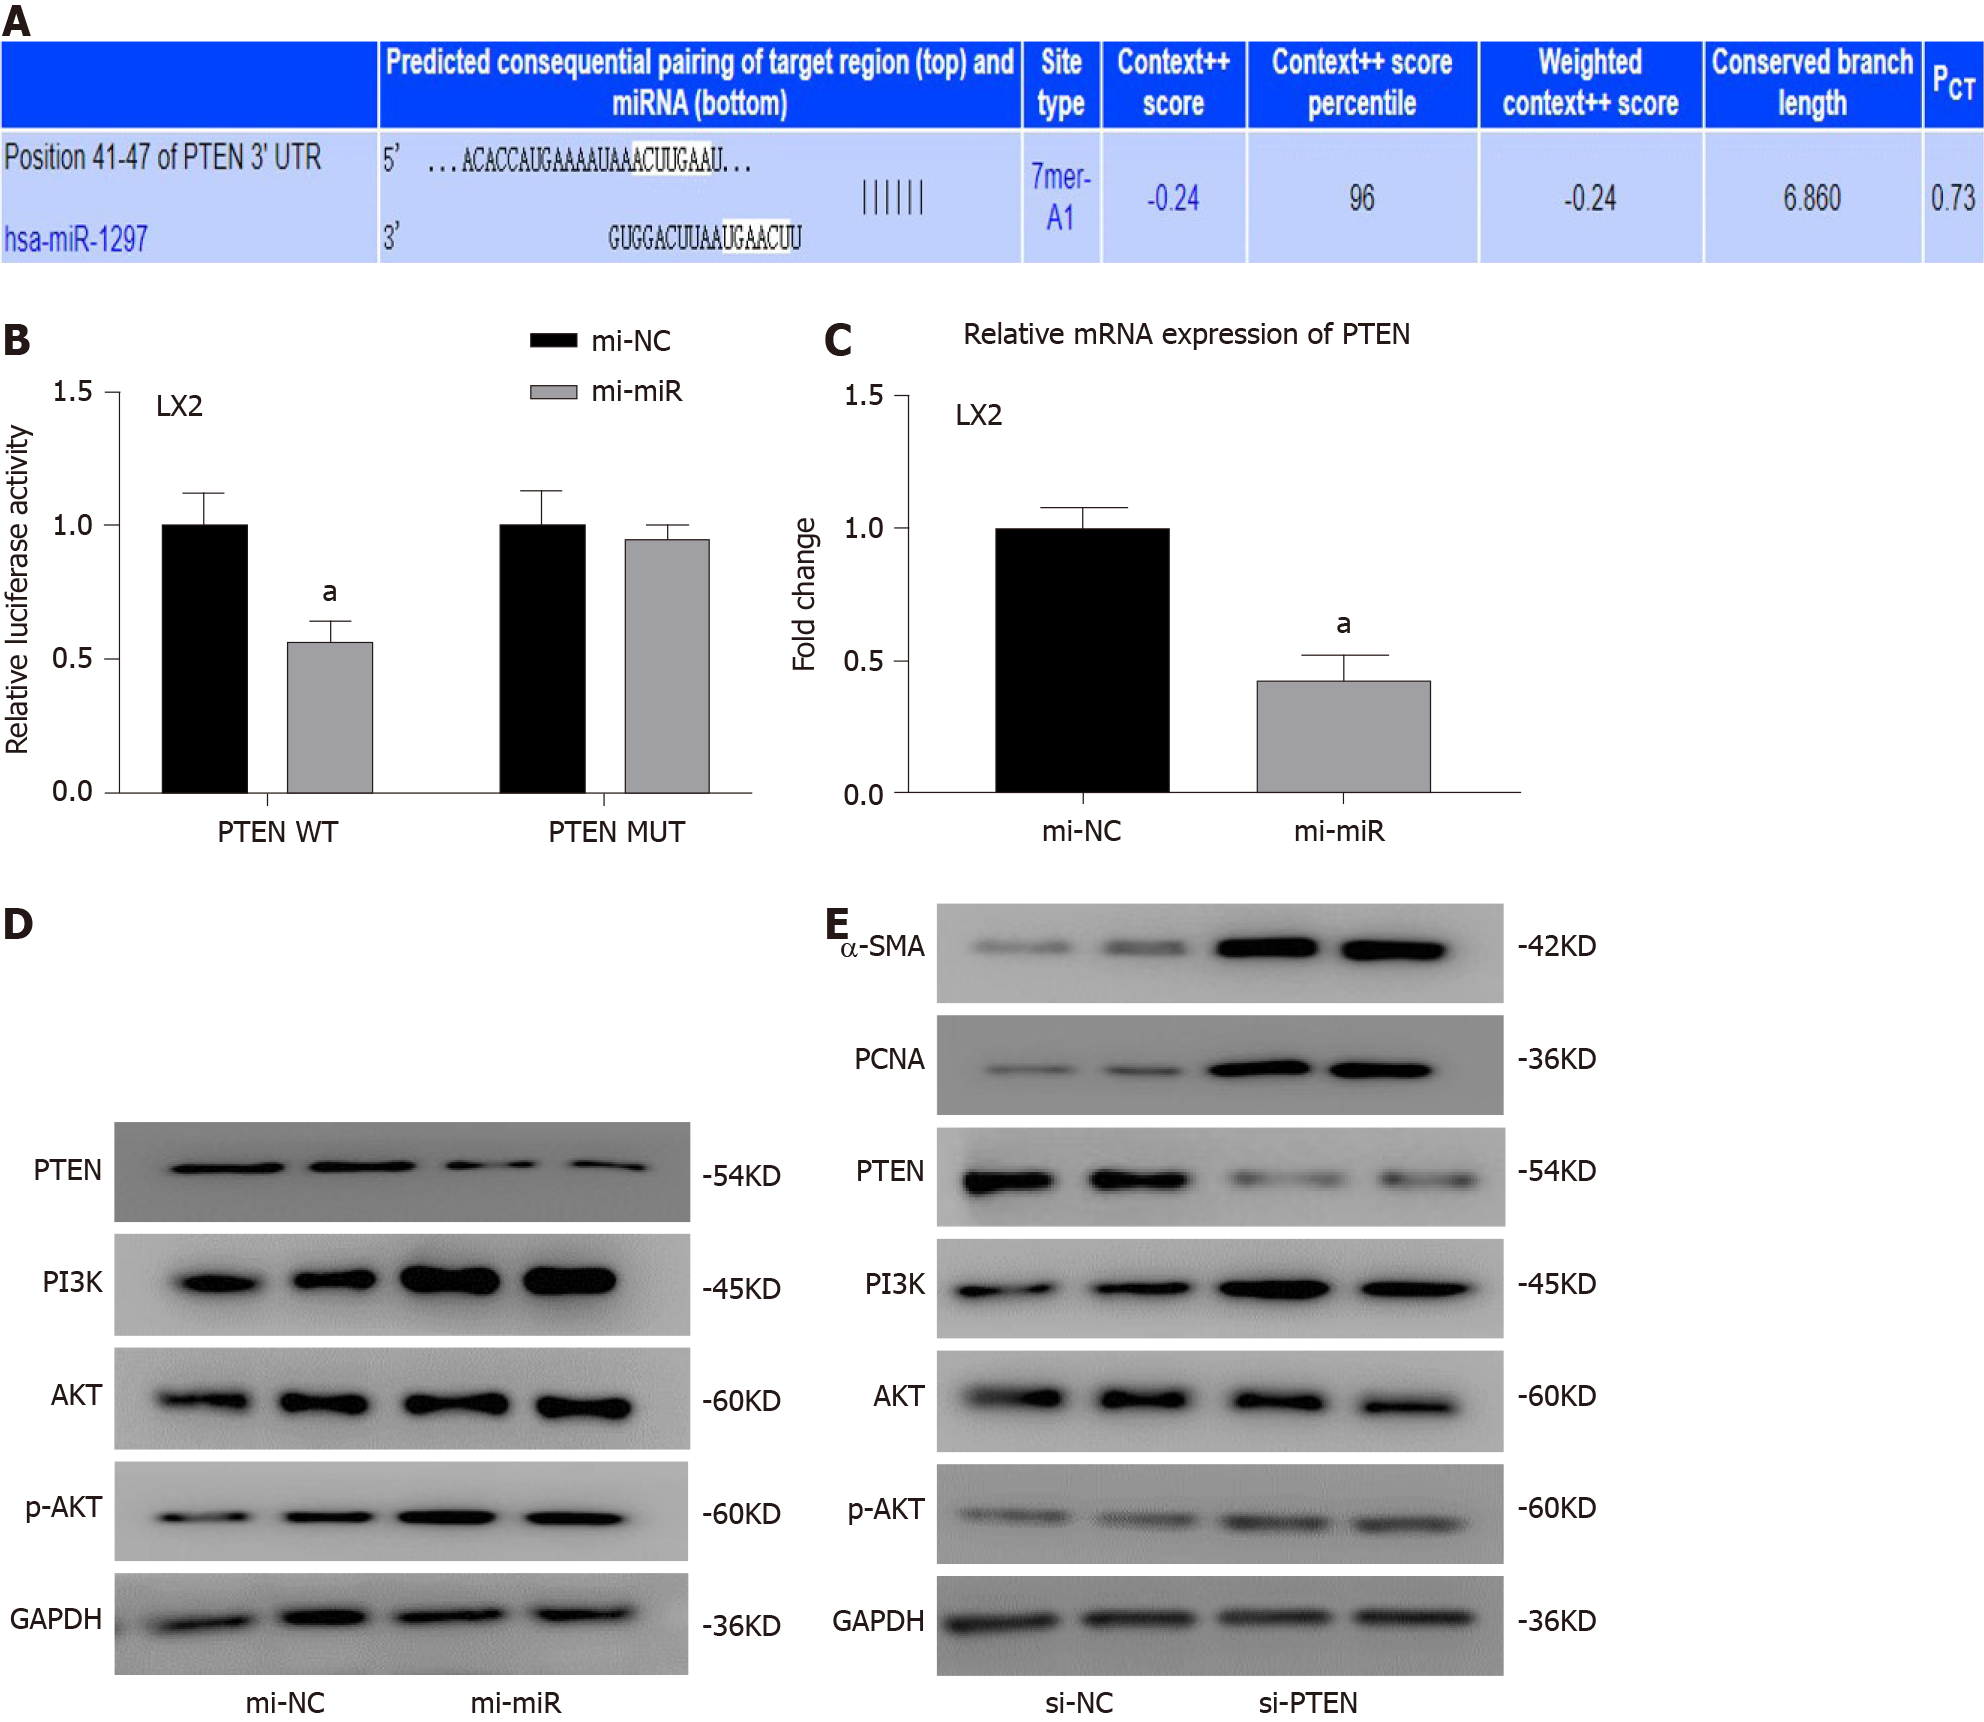
Figure 5 MicroR-1297 promoted hepatic stellate cell activation and proliferation by targeting the PTEN signaling pathway.
A: Binding site of PTEN mRNA with microRNA (miR)-1297 from TargetScan database; B: LX2 cells were cotransfected with luciferase reporter constructs containing a wild-type or mutant 3’-UTR of PTEN and 50 nmol/L miR-1297 mimics for 24 h. Then relative luciferase activity was assessed. PTEN wild-type (PTEN WT) microRNA mimics of negative controls: 1.00 ± 0.12 vs miR-1297 mimics: 0.56 ± 0.08; PTEN mutant (PTEN MUT) microRNA mimics of negative controls (mi-NC): 1.00 ± 0.13 vs miR-1297 mimics (mi-miR): 0.95 ± 0.05; C: Relative mRNA expression of PTEN were assessed by quantitative real-time PCR after 50 nmol/L miR-1297 mimics for 48 h. microRNA mimics of negative controls: 1.00 ± 0.08 vs miR-1297 mimics: 0.43 ± 0.09; D: Relative protein expression of PTEN, PI3K, AKT and p-AKT were assessed by western blot after 50 nmol/L miR-1297 mimics for 48 h; E: Relative protein expression of α-SMA, PCNA, PTEN, PI3K, AK and p-AKT were assessed by western blot after 100 nmol/L small interfering RNA for PTEN (si-PTEN) transfection for 48 h. Statistical significance: aP < 0.05. si-NC: Small interfering RNA for negative controls.
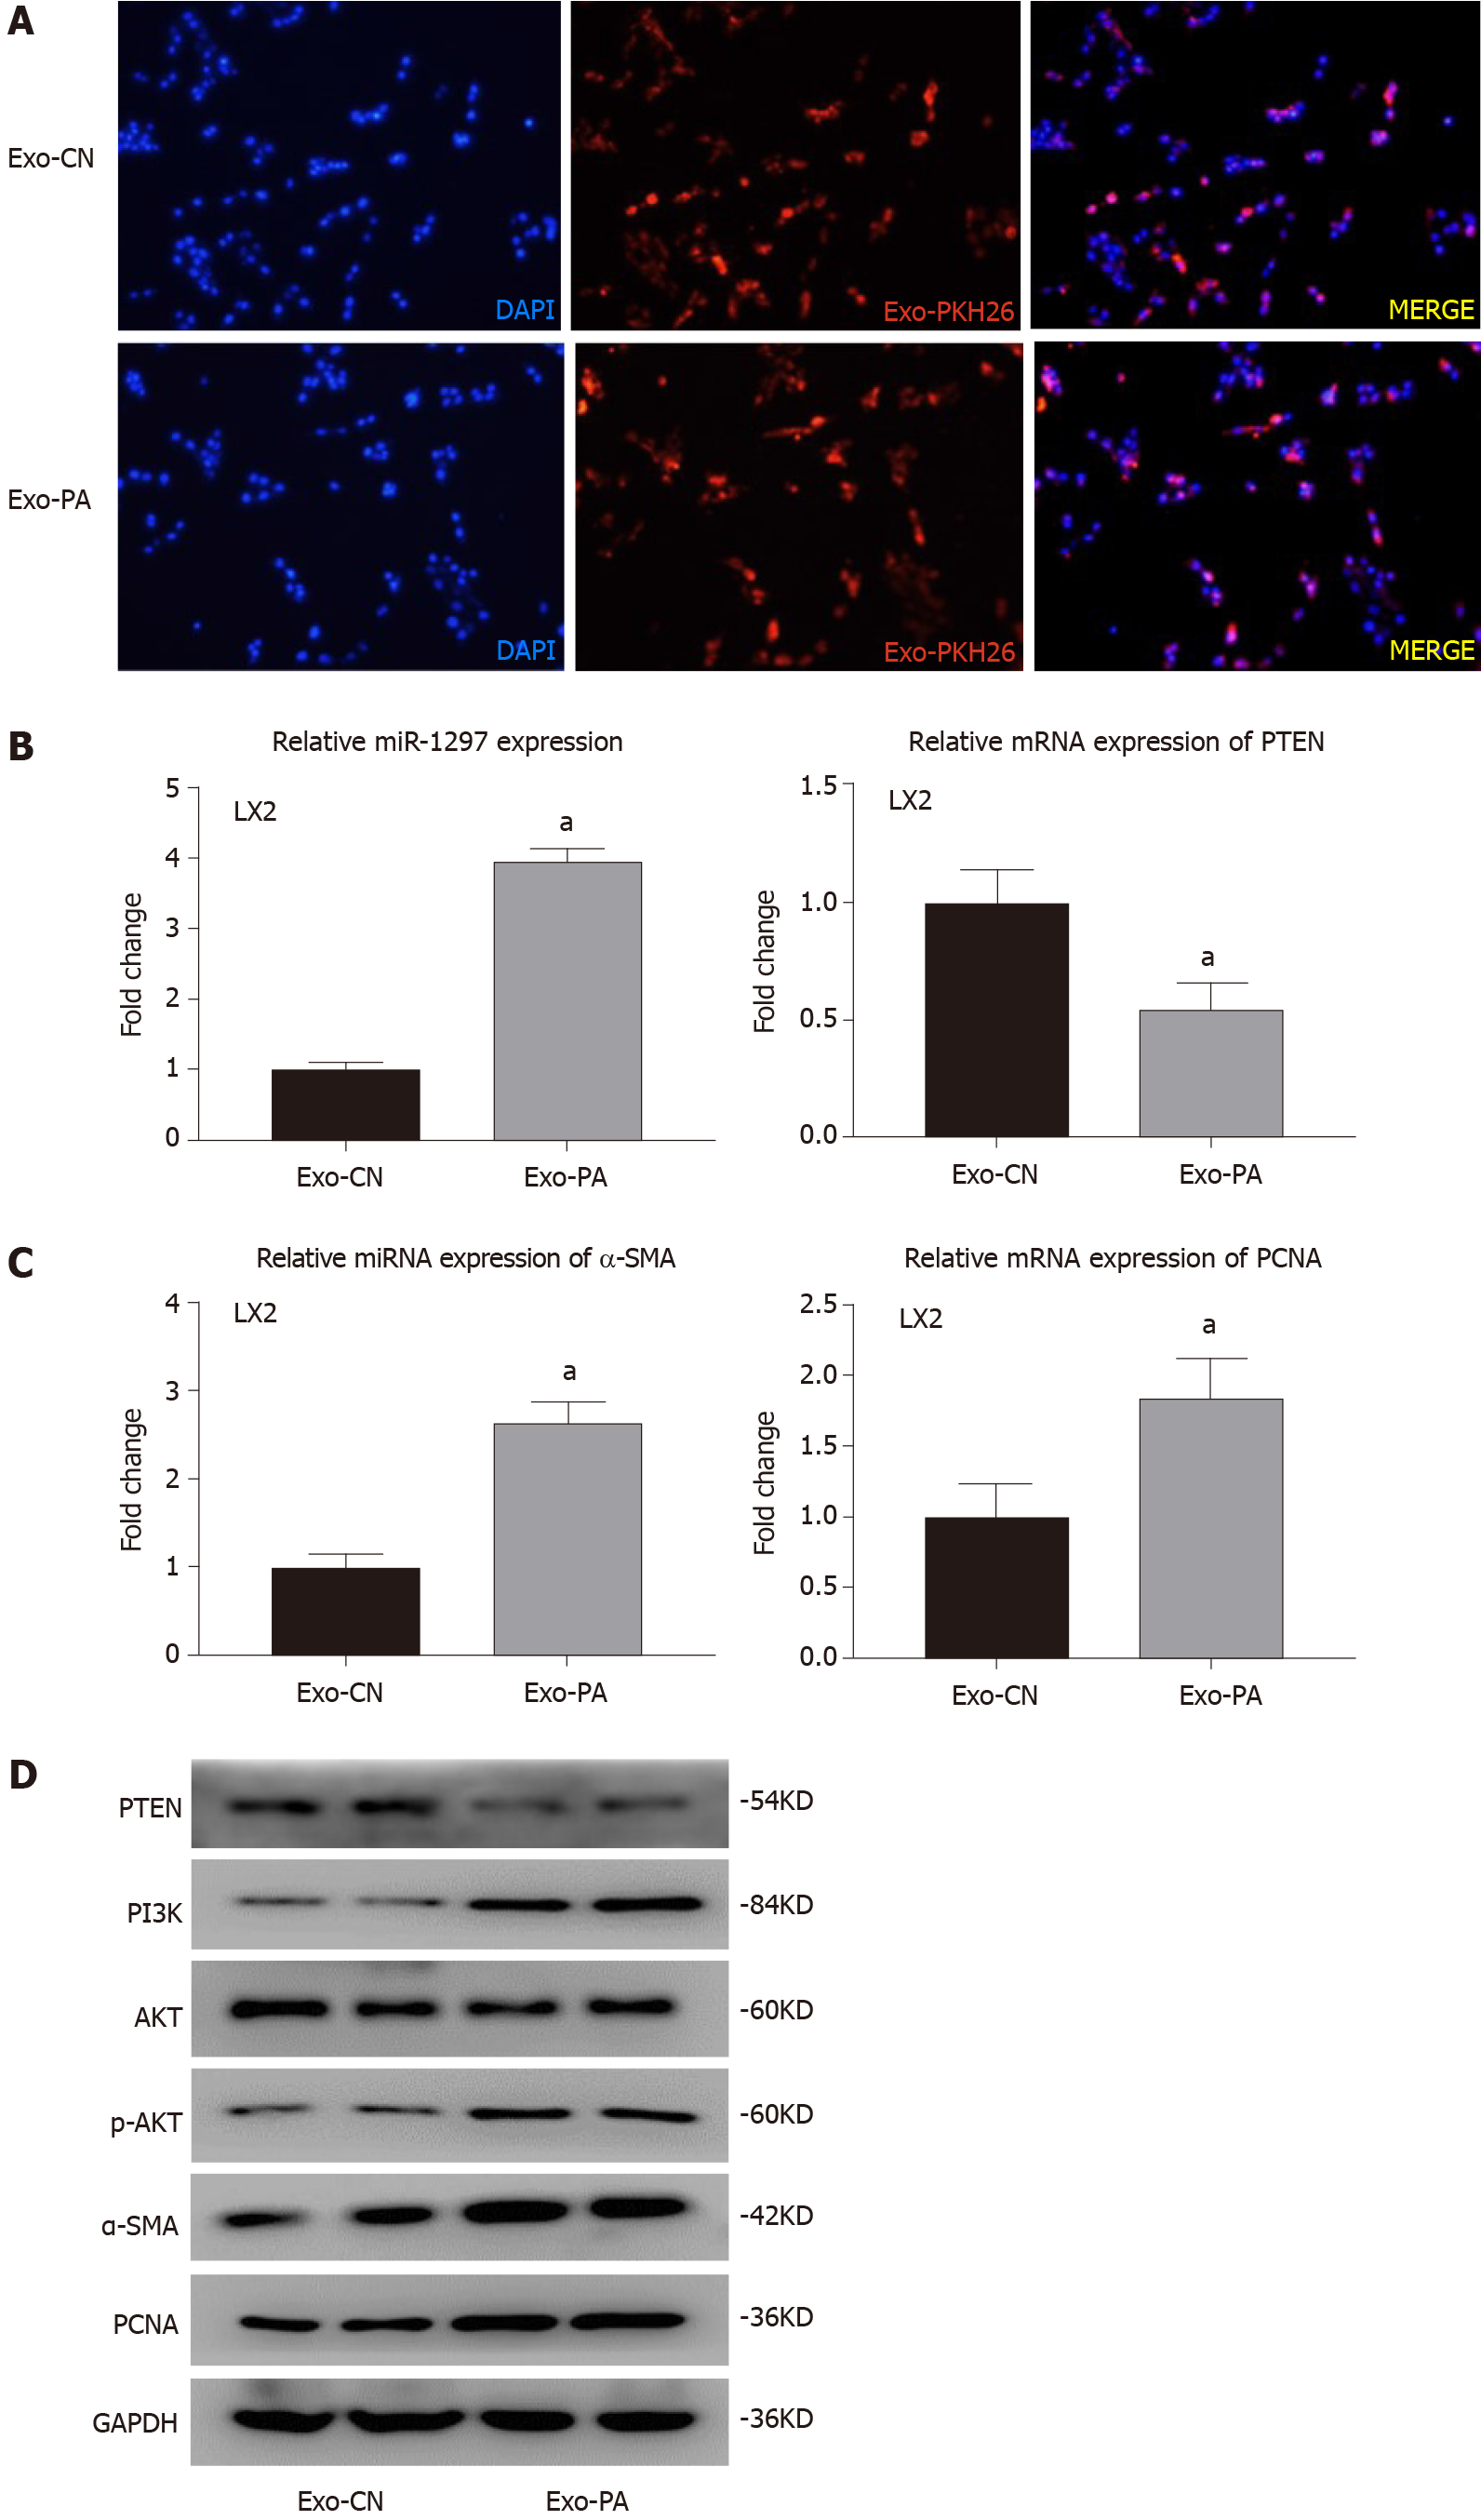
Figure 6 Lipotoxic hepatocyte-secreted exosomes could transfer exosomal microRNA-1297 to hepatic stellate cells and contribute to hepatic stellate cell activation through the PTEN/PI3K/AKT pathway.
A: The PKH-26 stained exosomes were absorbed by LX2 cells observed by a fluorescence microscope; B: The relative microRNA expression of miR-1297 and mRNA expression of PTEN were assessed by quantitative real-time PCR after exosomes derived from vehicle control or palmitic acid (Exo-CN or Exo-PA) treatment for 48 h. miR-1297 mimics of negative controls (mi-NC): 1.00 ± 0.12 vs miR1297 mimics (mi-miR): 3.95 ± 0.18, PTEN mi-NC: 1.00 ± 0.13 vs mi-miR: 0.54 ± 0.12; C: The relative mRNA expression of α-SMA and PCNA were assessed by quantitative real-time PCR after Exo-CN or Exo-PA treatment for 48 h. α-SMA mi-NC 1.00 ± 0.14 vs mi-miR 2.63 ± 0.23, PCNA mi-NC 1.00 ± 0.23 vs mi-miR 1.85 ± 0.23; D: Protein levels of α-SMA, PCNA, PTEN, PI3K, AKT and p-AKT in LX2 cells were assessed by western blot after Exo-CN or Exo-PA treatment for 48 h; E: Immunofluorescence staining was performed to evaluate the activation of LX2 cells after Exo-CN or Exo-PA treatment for 48 h; mi-NC: 1.00 ± 0.26 vs mi-miR: 1.68 ± 0.21; F: Ethynyl-20-deoxyuridine (EdU) staining was performed to evaluate the proliferation of LX2 cells after Exo-CN or Exo-PA treatment for 48 h, mi-NC: 0.21 ± 0.04 vs mi-miR: 0.41 ± 0.07. Statistical significance: aP < 0.05. DAPI: 4´6-Diamidino-2-phenylindole; Exo-CN: Exosomes from control vehicle; Exo-PA: Exosomes from palmitic acid.
- Citation: Luo X, Luo SZ, Xu ZX, Zhou C, Li ZH, Zhou XY, Xu MY. Lipotoxic hepatocyte-derived exosomal miR-1297 promotes hepatic stellate cell activation through the PTEN signaling pathway in metabolic-associated fatty liver disease. World J Gastroenterol 2021; 27(14): 1419-1434
- URL: https://www.wjgnet.com/1007-9327/full/v27/i14/1419.htm
- DOI: https://dx.doi.org/10.3748/wjg.v27.i14.1419


