Copyright
©The Author(s) 2021.
World J Gastroenterol. Mar 14, 2021; 27(10): 939-958
Published online Mar 14, 2021. doi: 10.3748/wjg.v27.i10.939
Published online Mar 14, 2021. doi: 10.3748/wjg.v27.i10.939
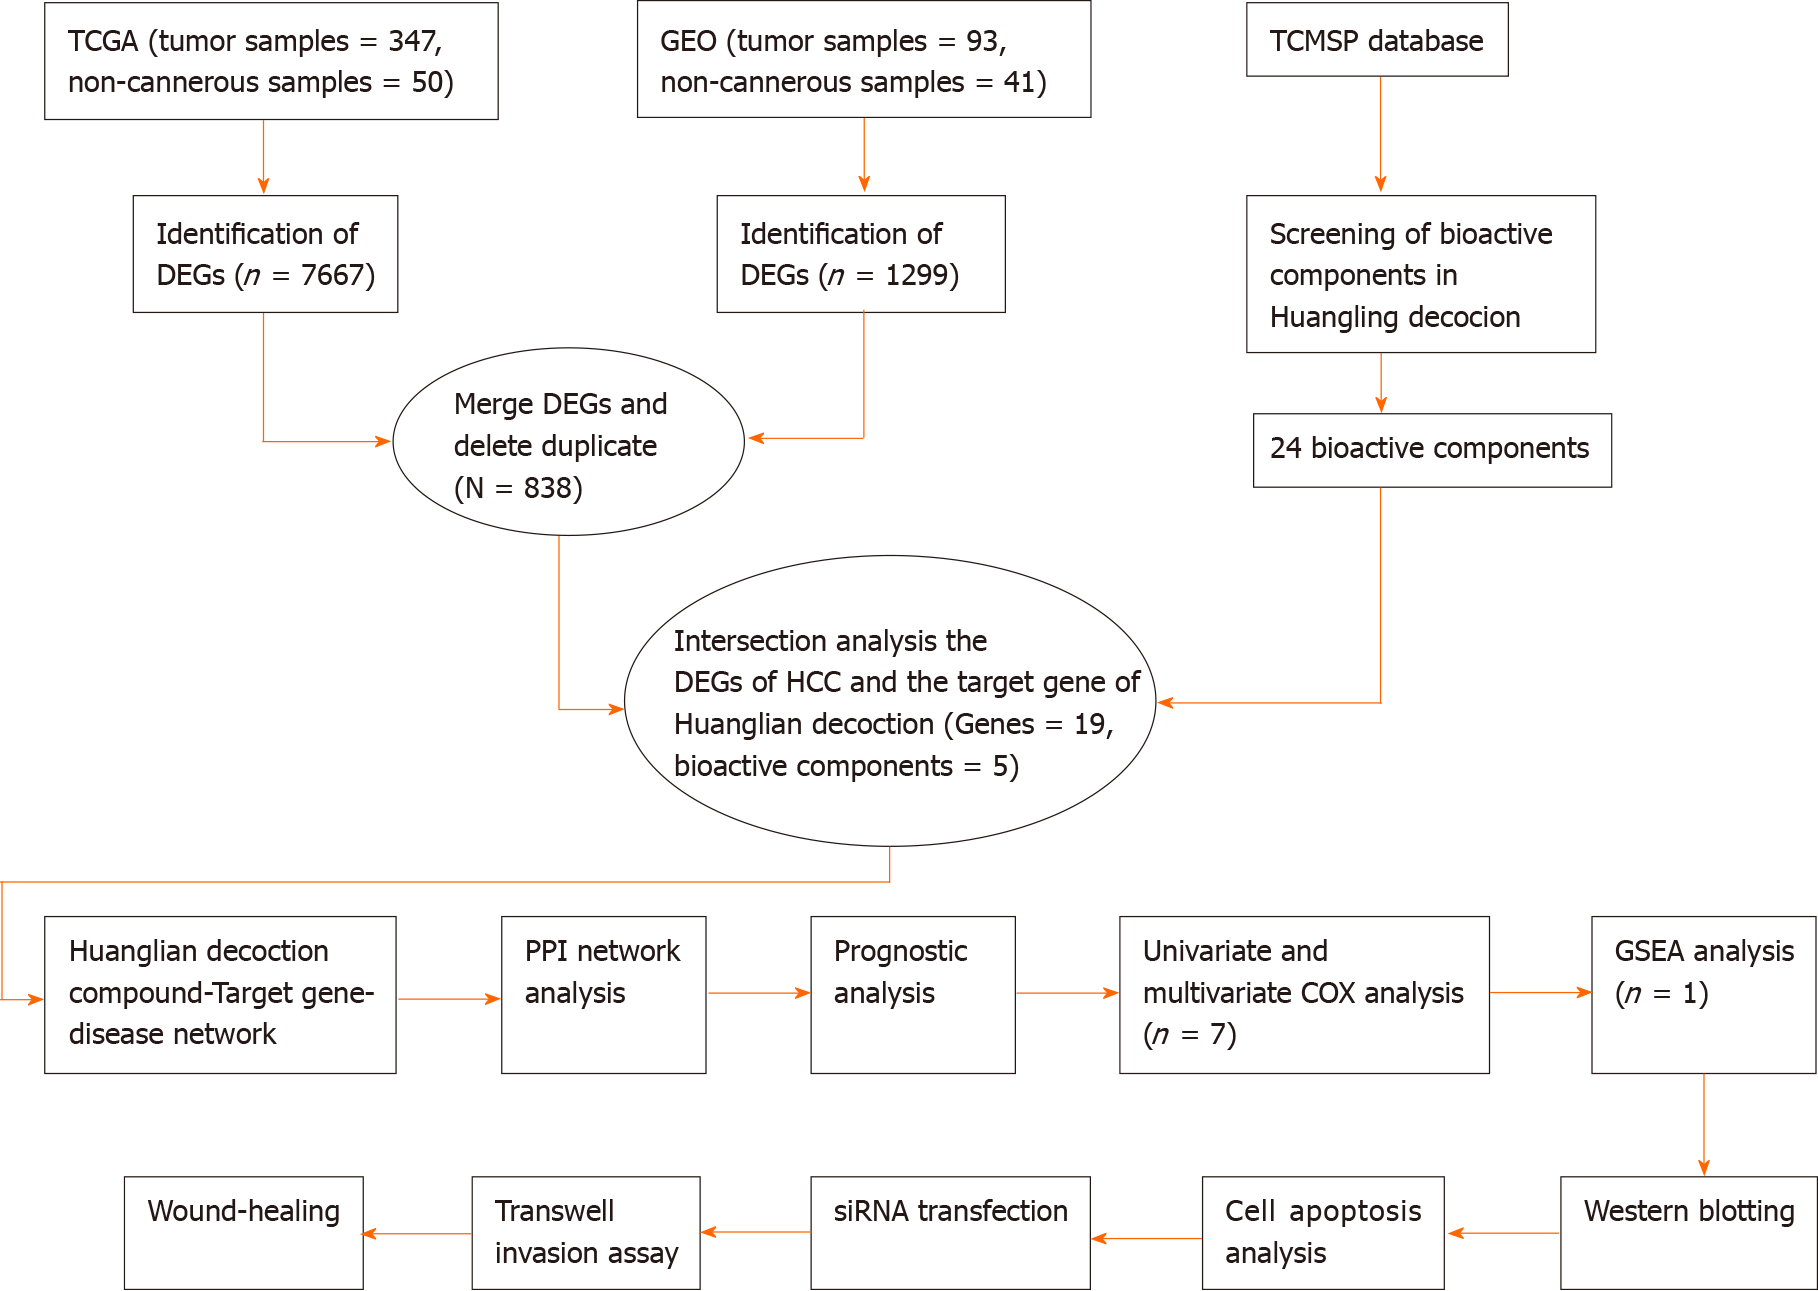
Figure 1 Flow chart.
TCGA: The Cancer Genome Atlas; GEO: Gene Expression Omnibus; TCMSP: Traditional Chinese Medicine System Pharmacology Database and Analysis Platform; DEGs: Differentially expressed genes; HCC: Hepatocellular carcinoma; PPI: Protein-protein interaction; GSEA: Gene set enrichment analysis.
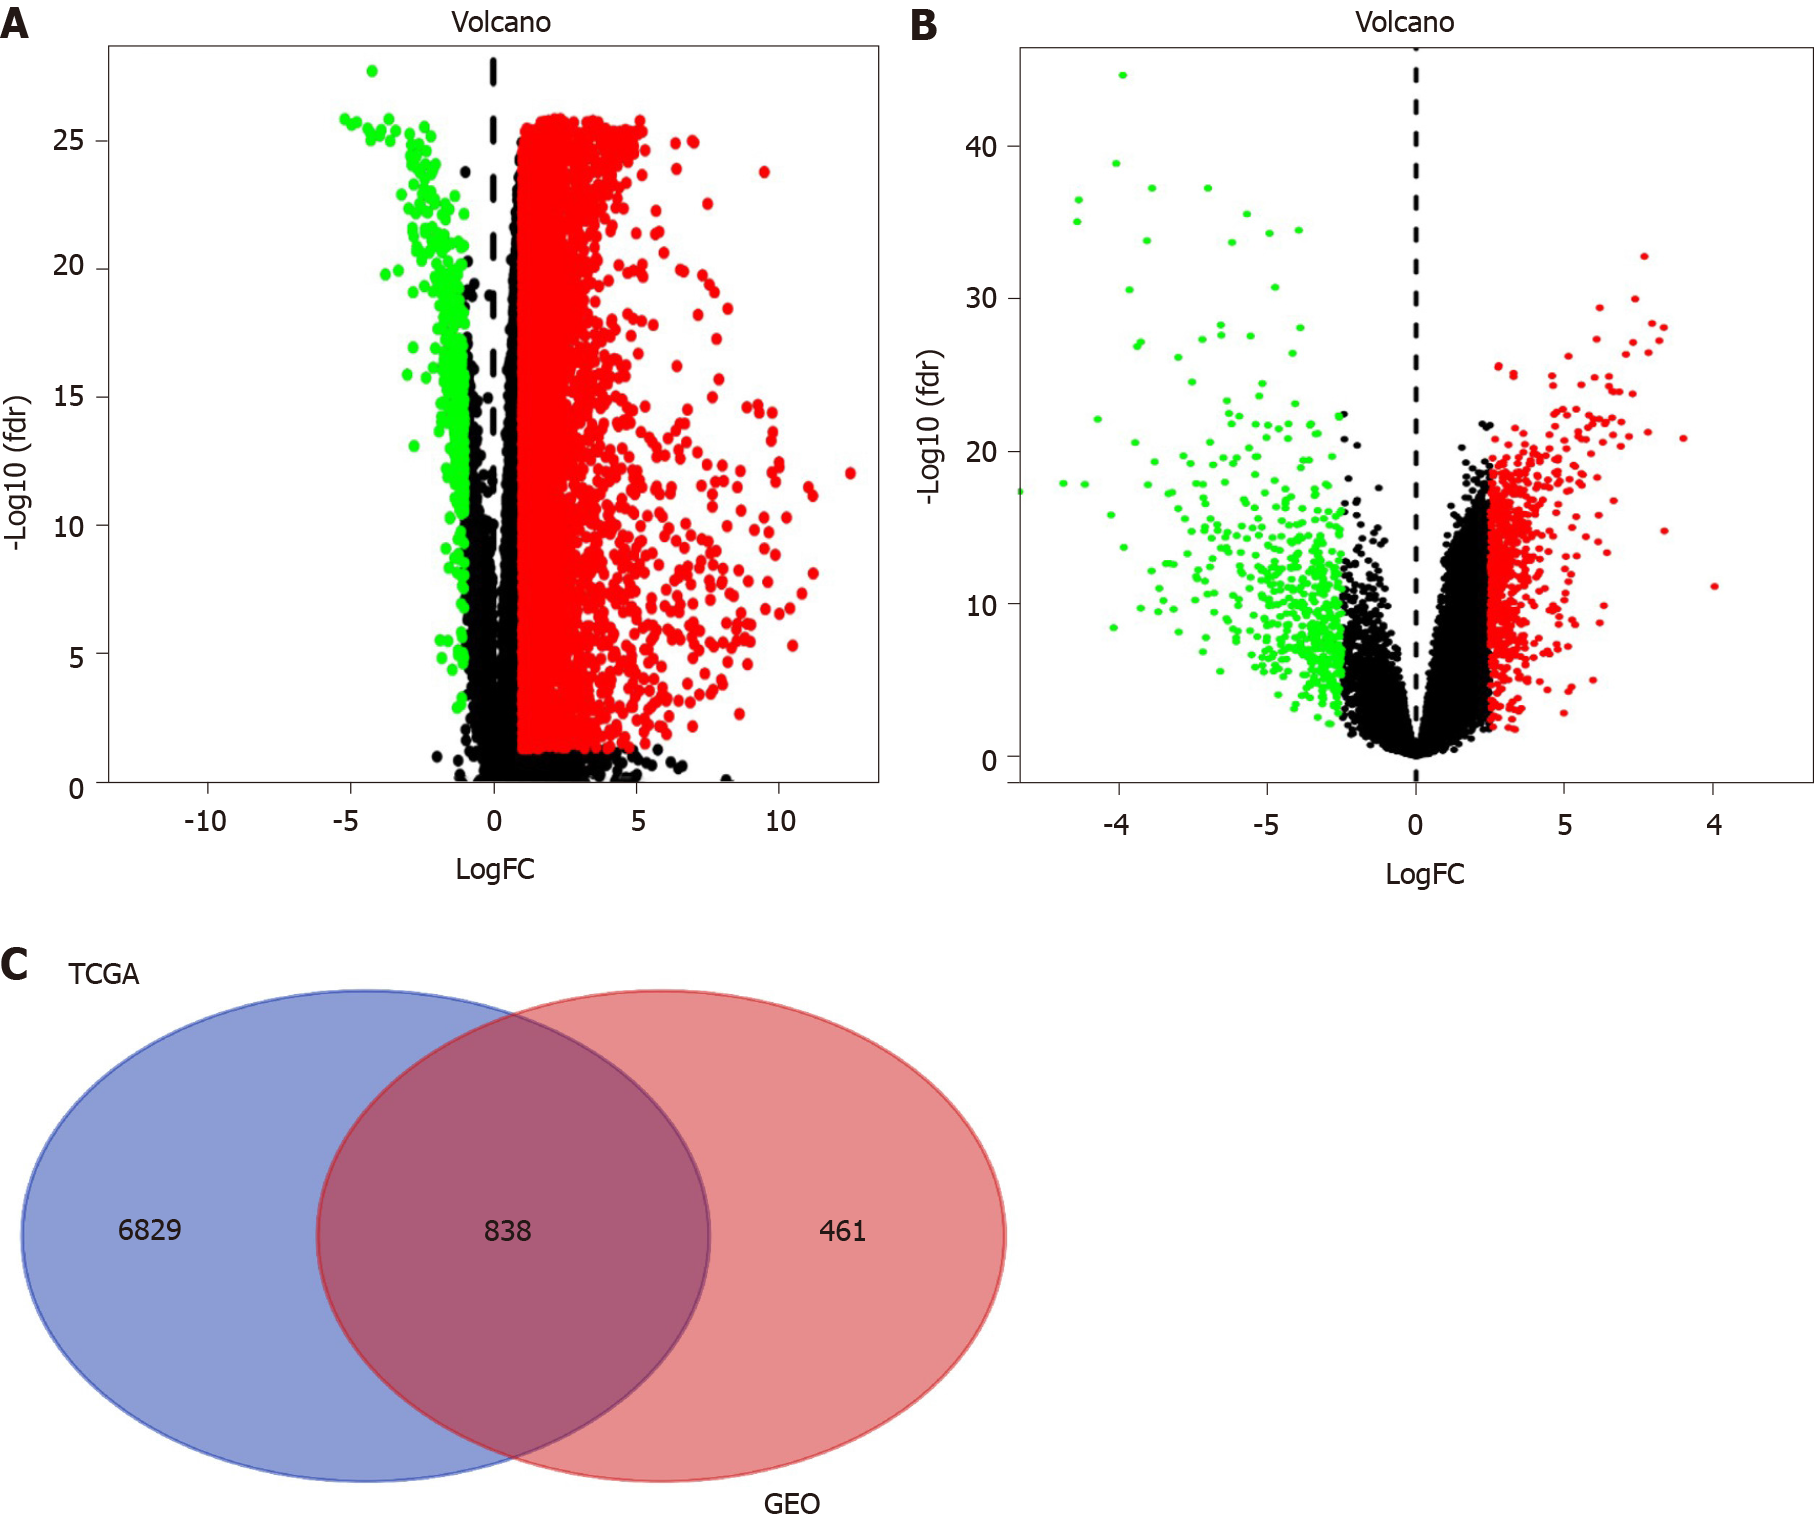
Figure 2 Volcano and Venn diagrams of differentially expressed genes.
A: Differential gene analysis of The Cancer Genome Atlas (TCGA) datasets; B: Differential gene analysis of Gene Expression Omnibus (GEO) datasets; C: The TCGA and GEO datasets show an overlap of 838 genes. Upregulated genes are marked in red; downregulated genes are marked in light green. TCGA: The Cancer Genome Atlas; GEO: Gene Expression Omnibus.
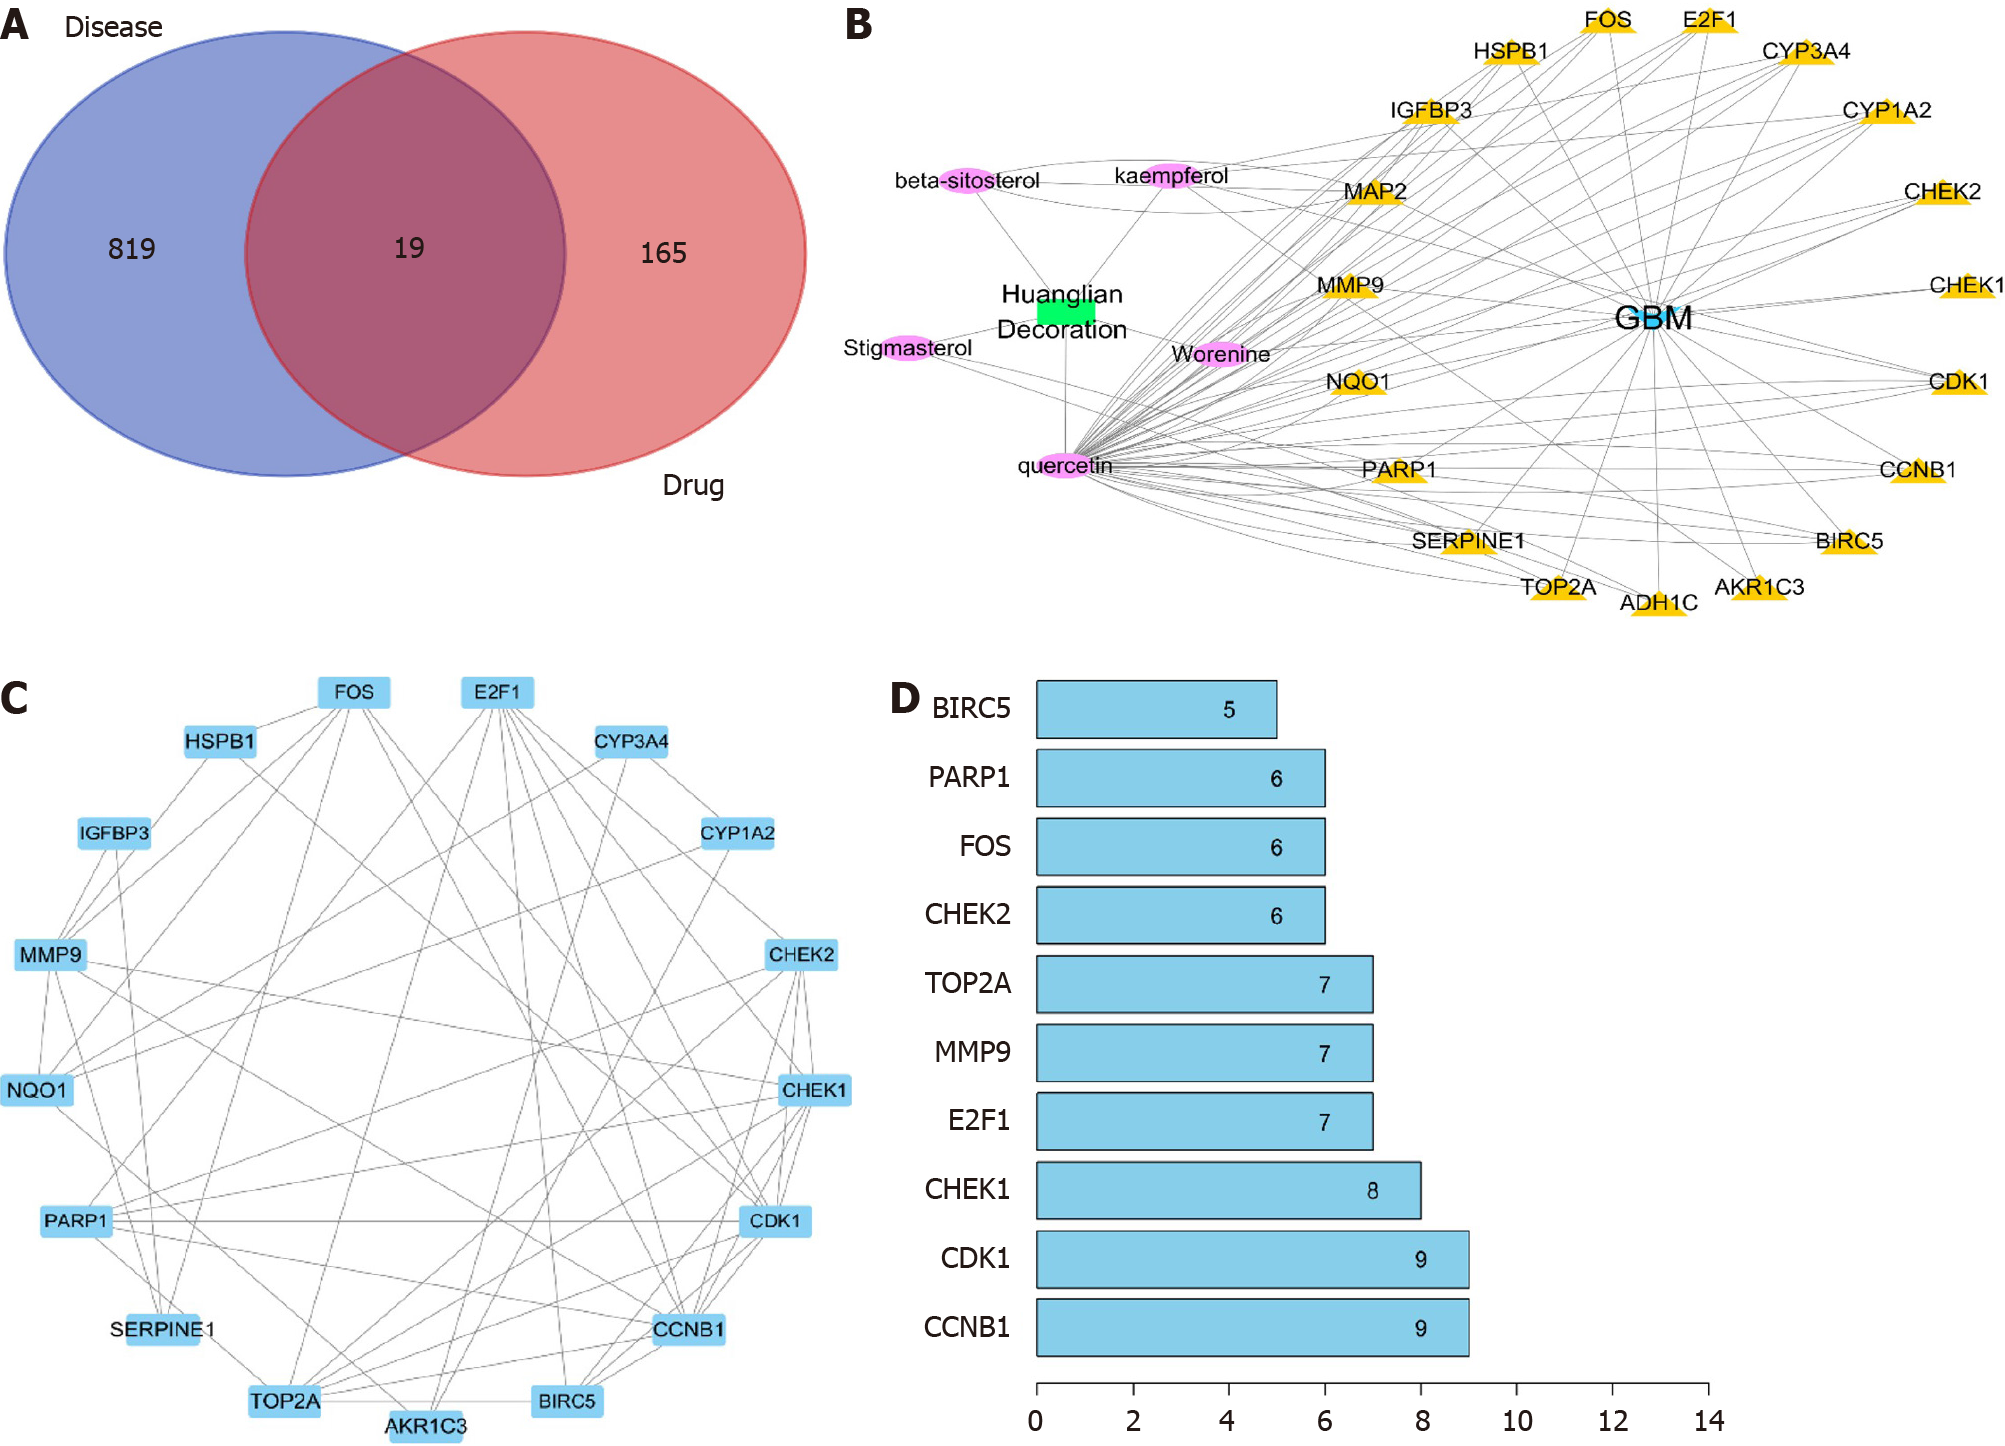
Figure 3 Identification of key genes.
A: 19 genes overlap between differentially expressed genes of disease and drug target genes; B: Herb-Compound network of potential bioactive constituents for Huanglian decoction. The circles on the left are the drugs and their bioactive compounds, while the circles on the right are the target genes; C: Protein-protein interaction network for target genes. The edges represent the interaction between them; D: The top 10 genes according to the number of nodes.
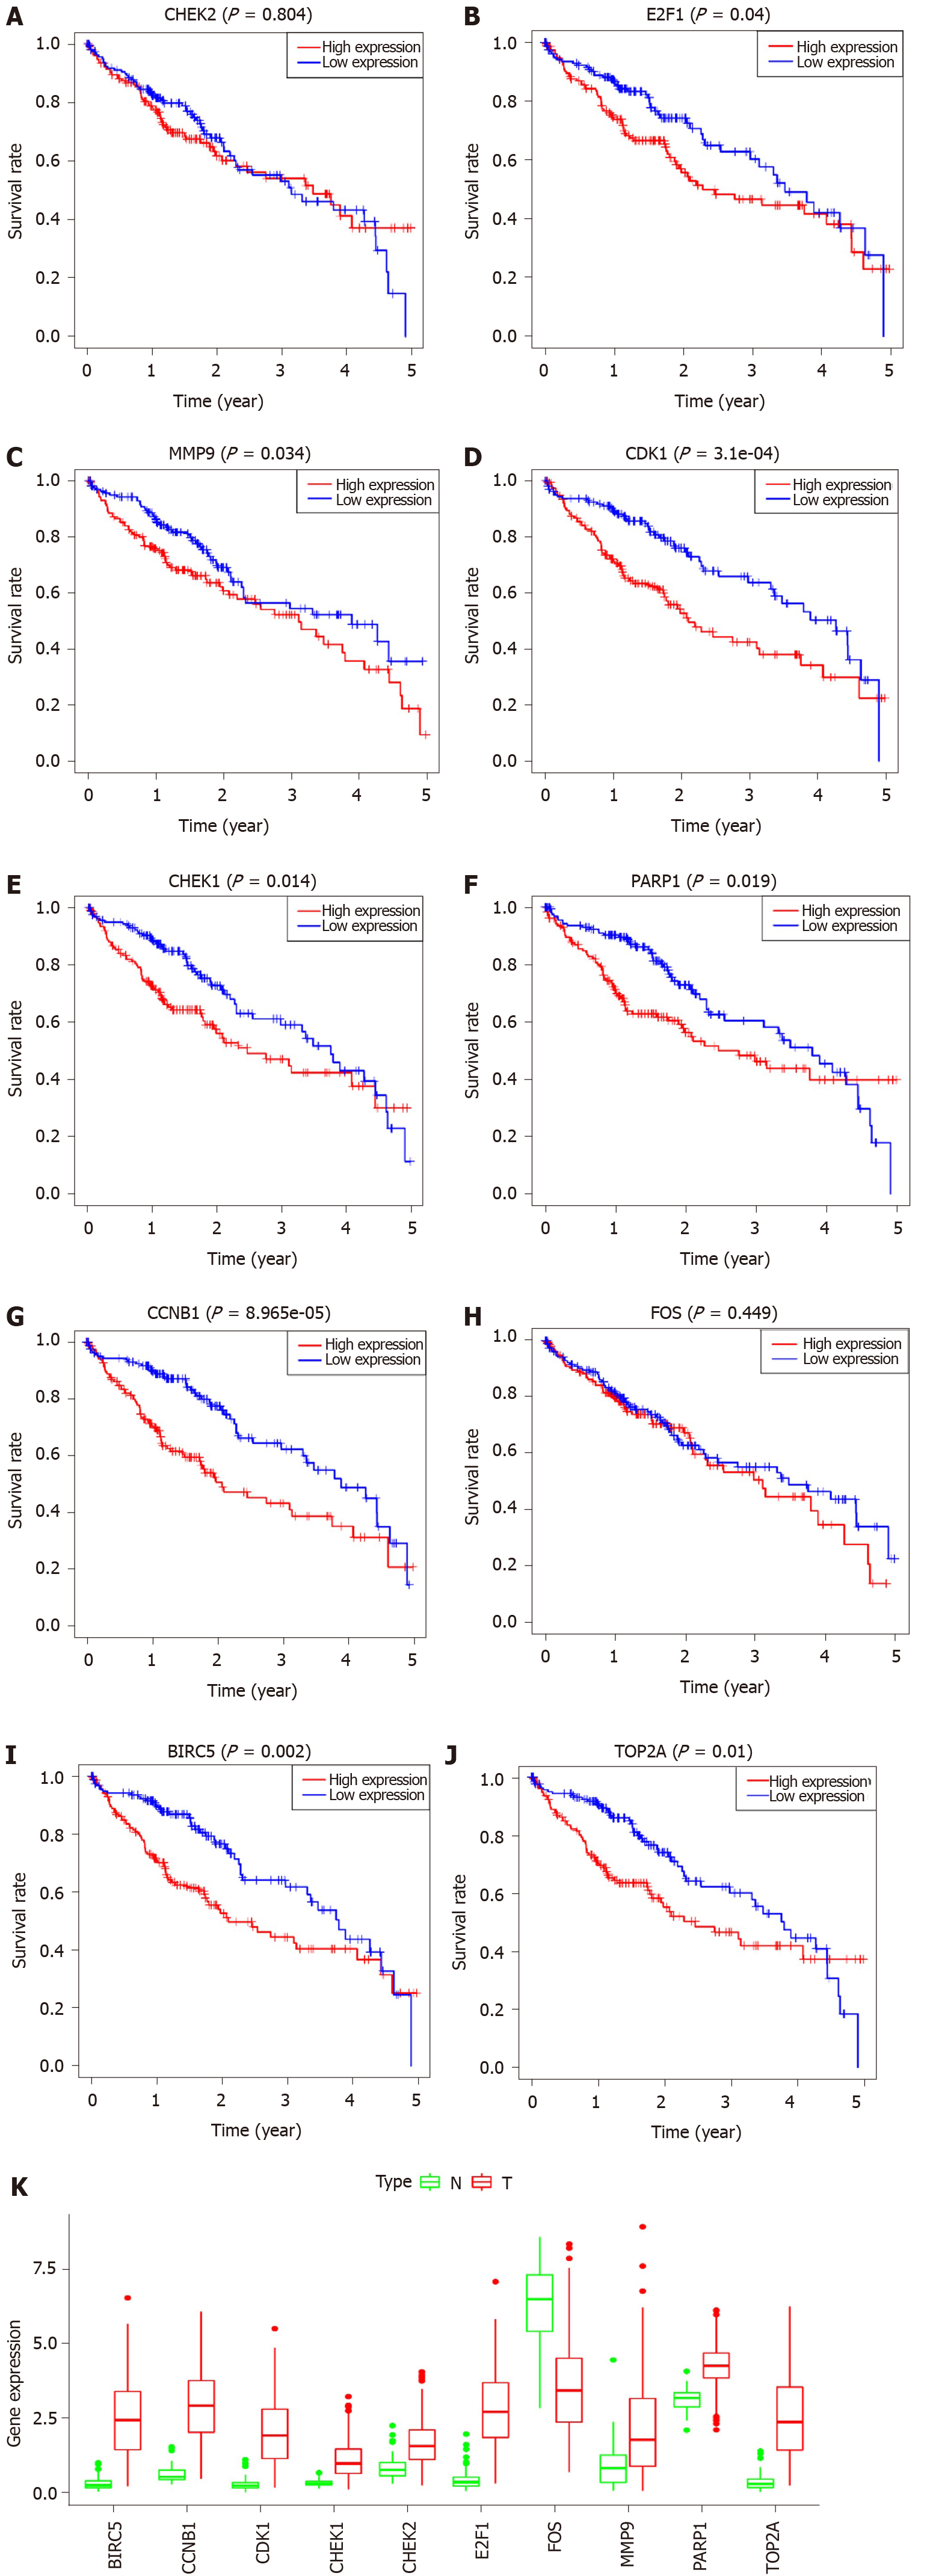
Figure 4 Survival and expression analyses.
A-J: Survival analysis of the hub genes; K: Expression analysis of the hub genes. A level of P < 0.05 was considered statistically significant.
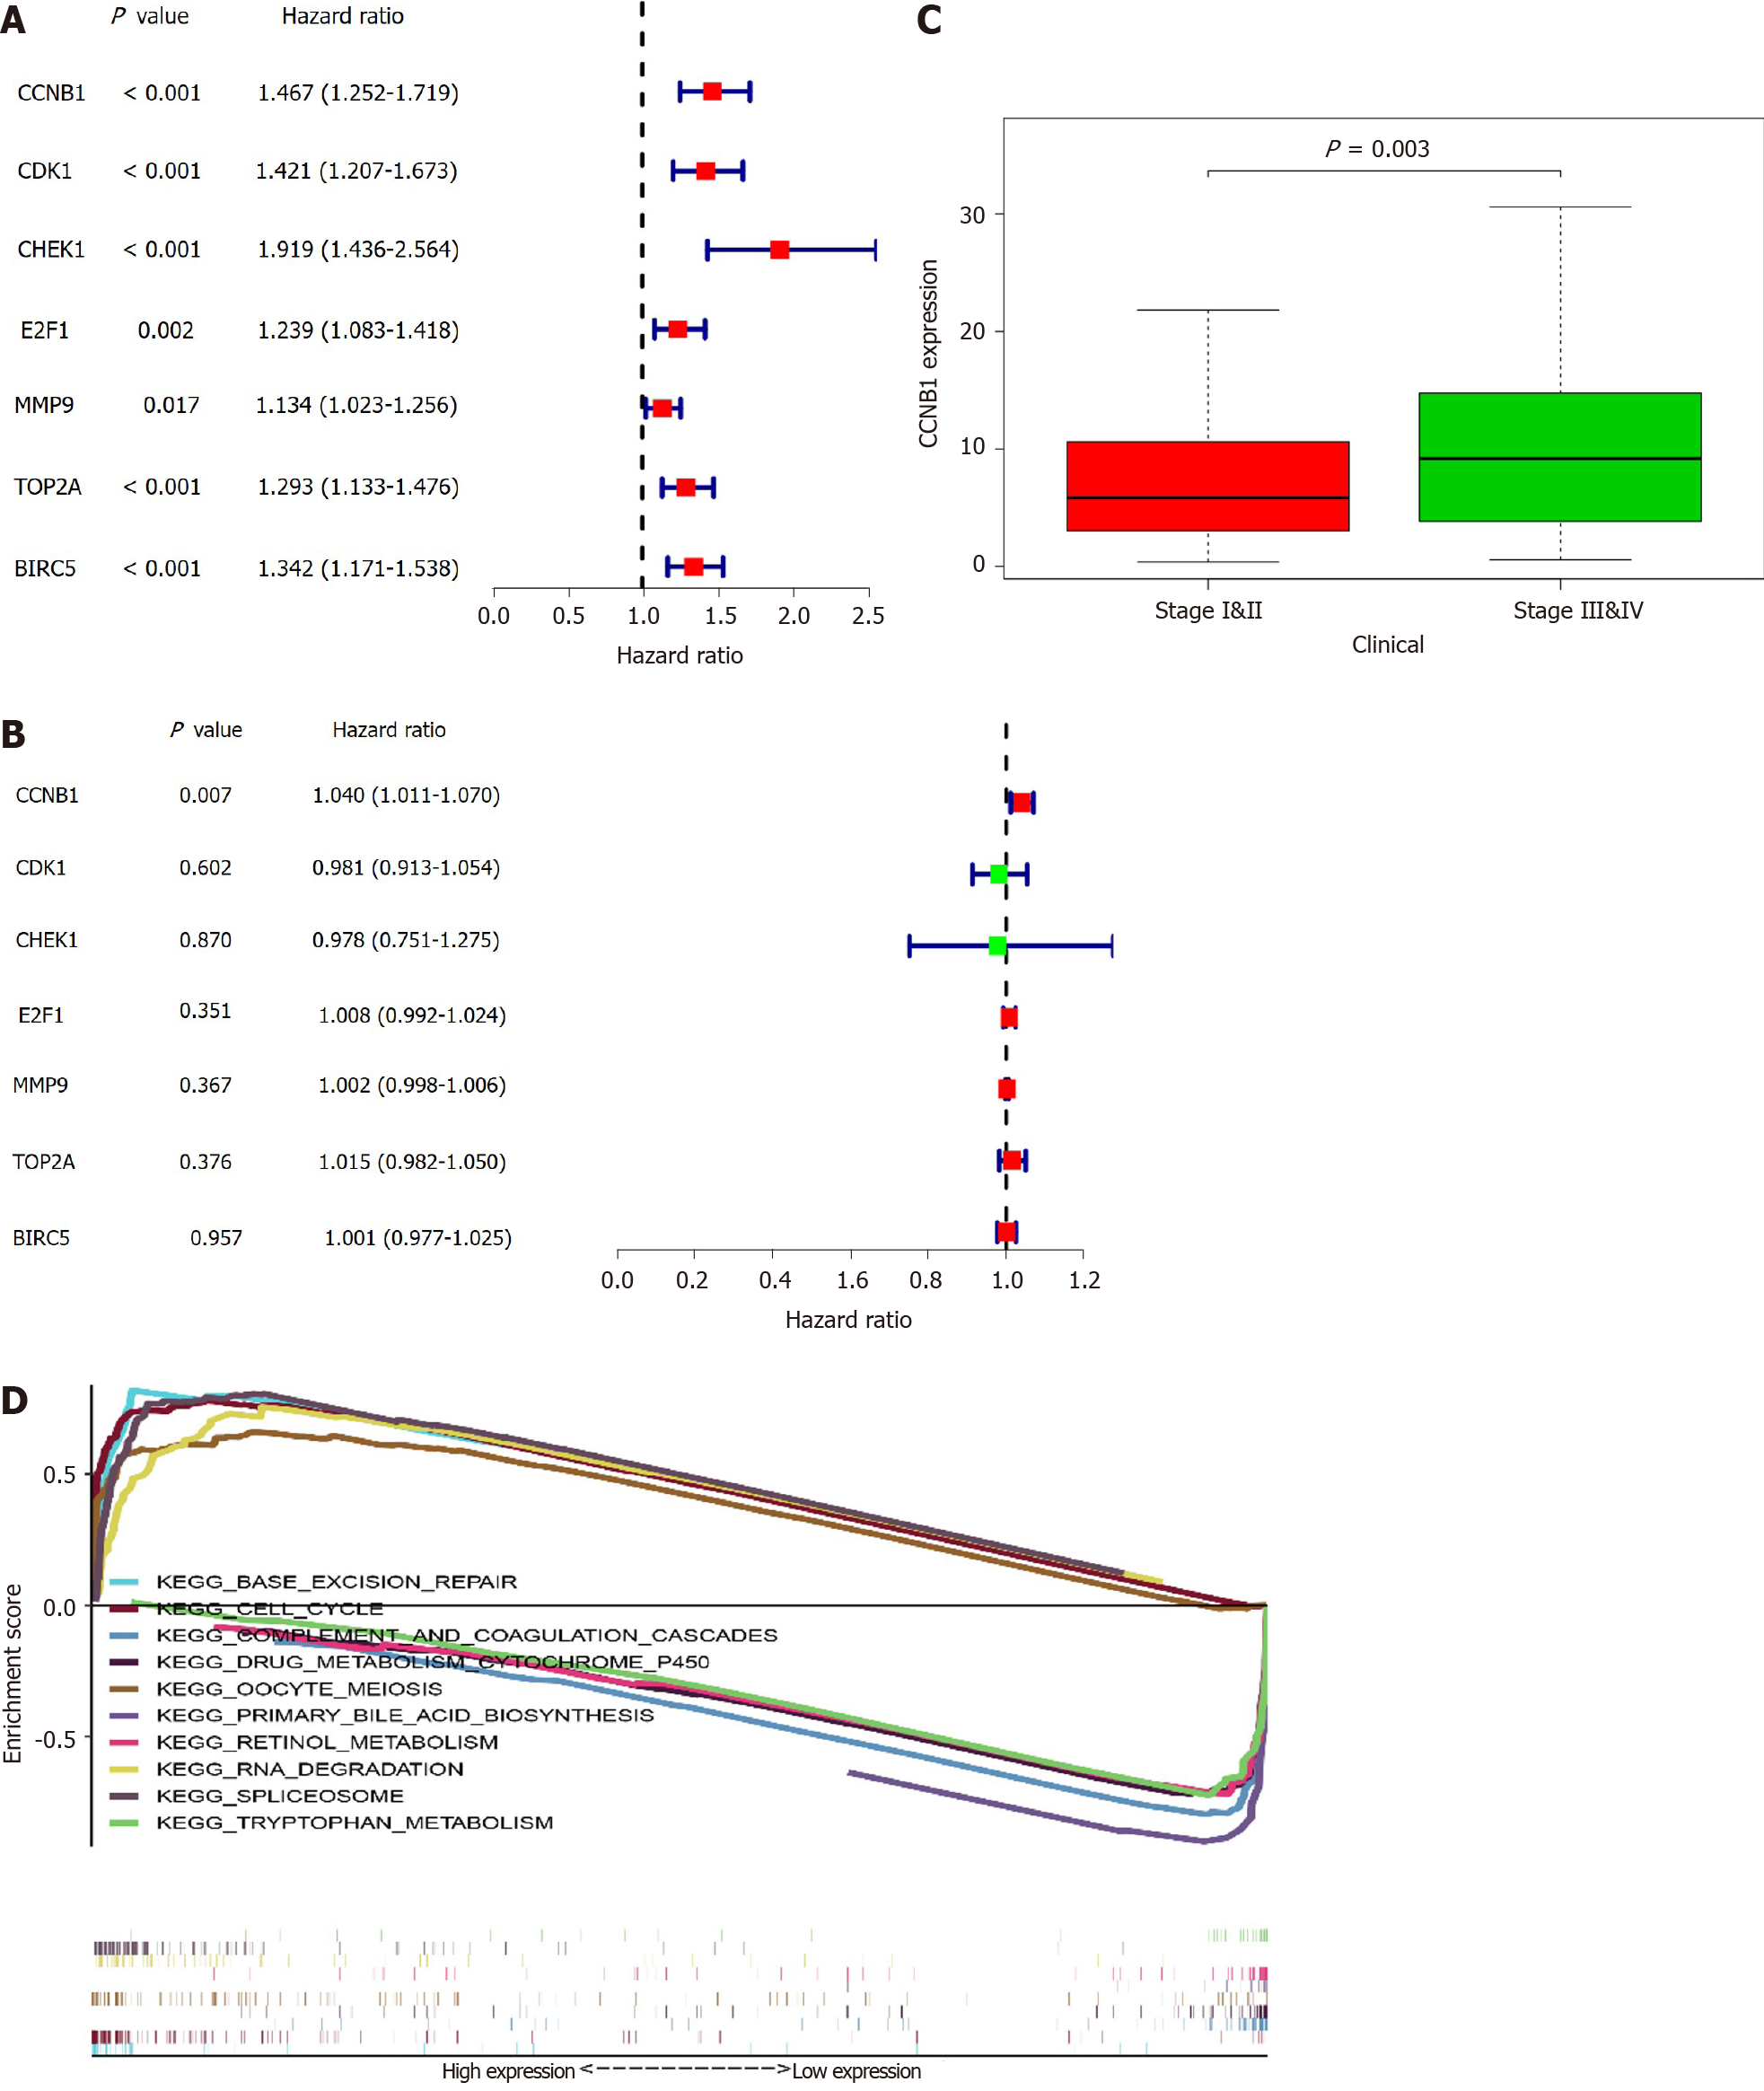
Figure 5 Identification of key prognostic genes in hepatocellular carcinoma.
A: Univariate Cox analysis; B: Multivariate Cox analysis; C: CCNB1 found to promote tumor development; D: The Gene Set Enrichment Analysis reveals the biological pathways and processes associated with CCNB1.
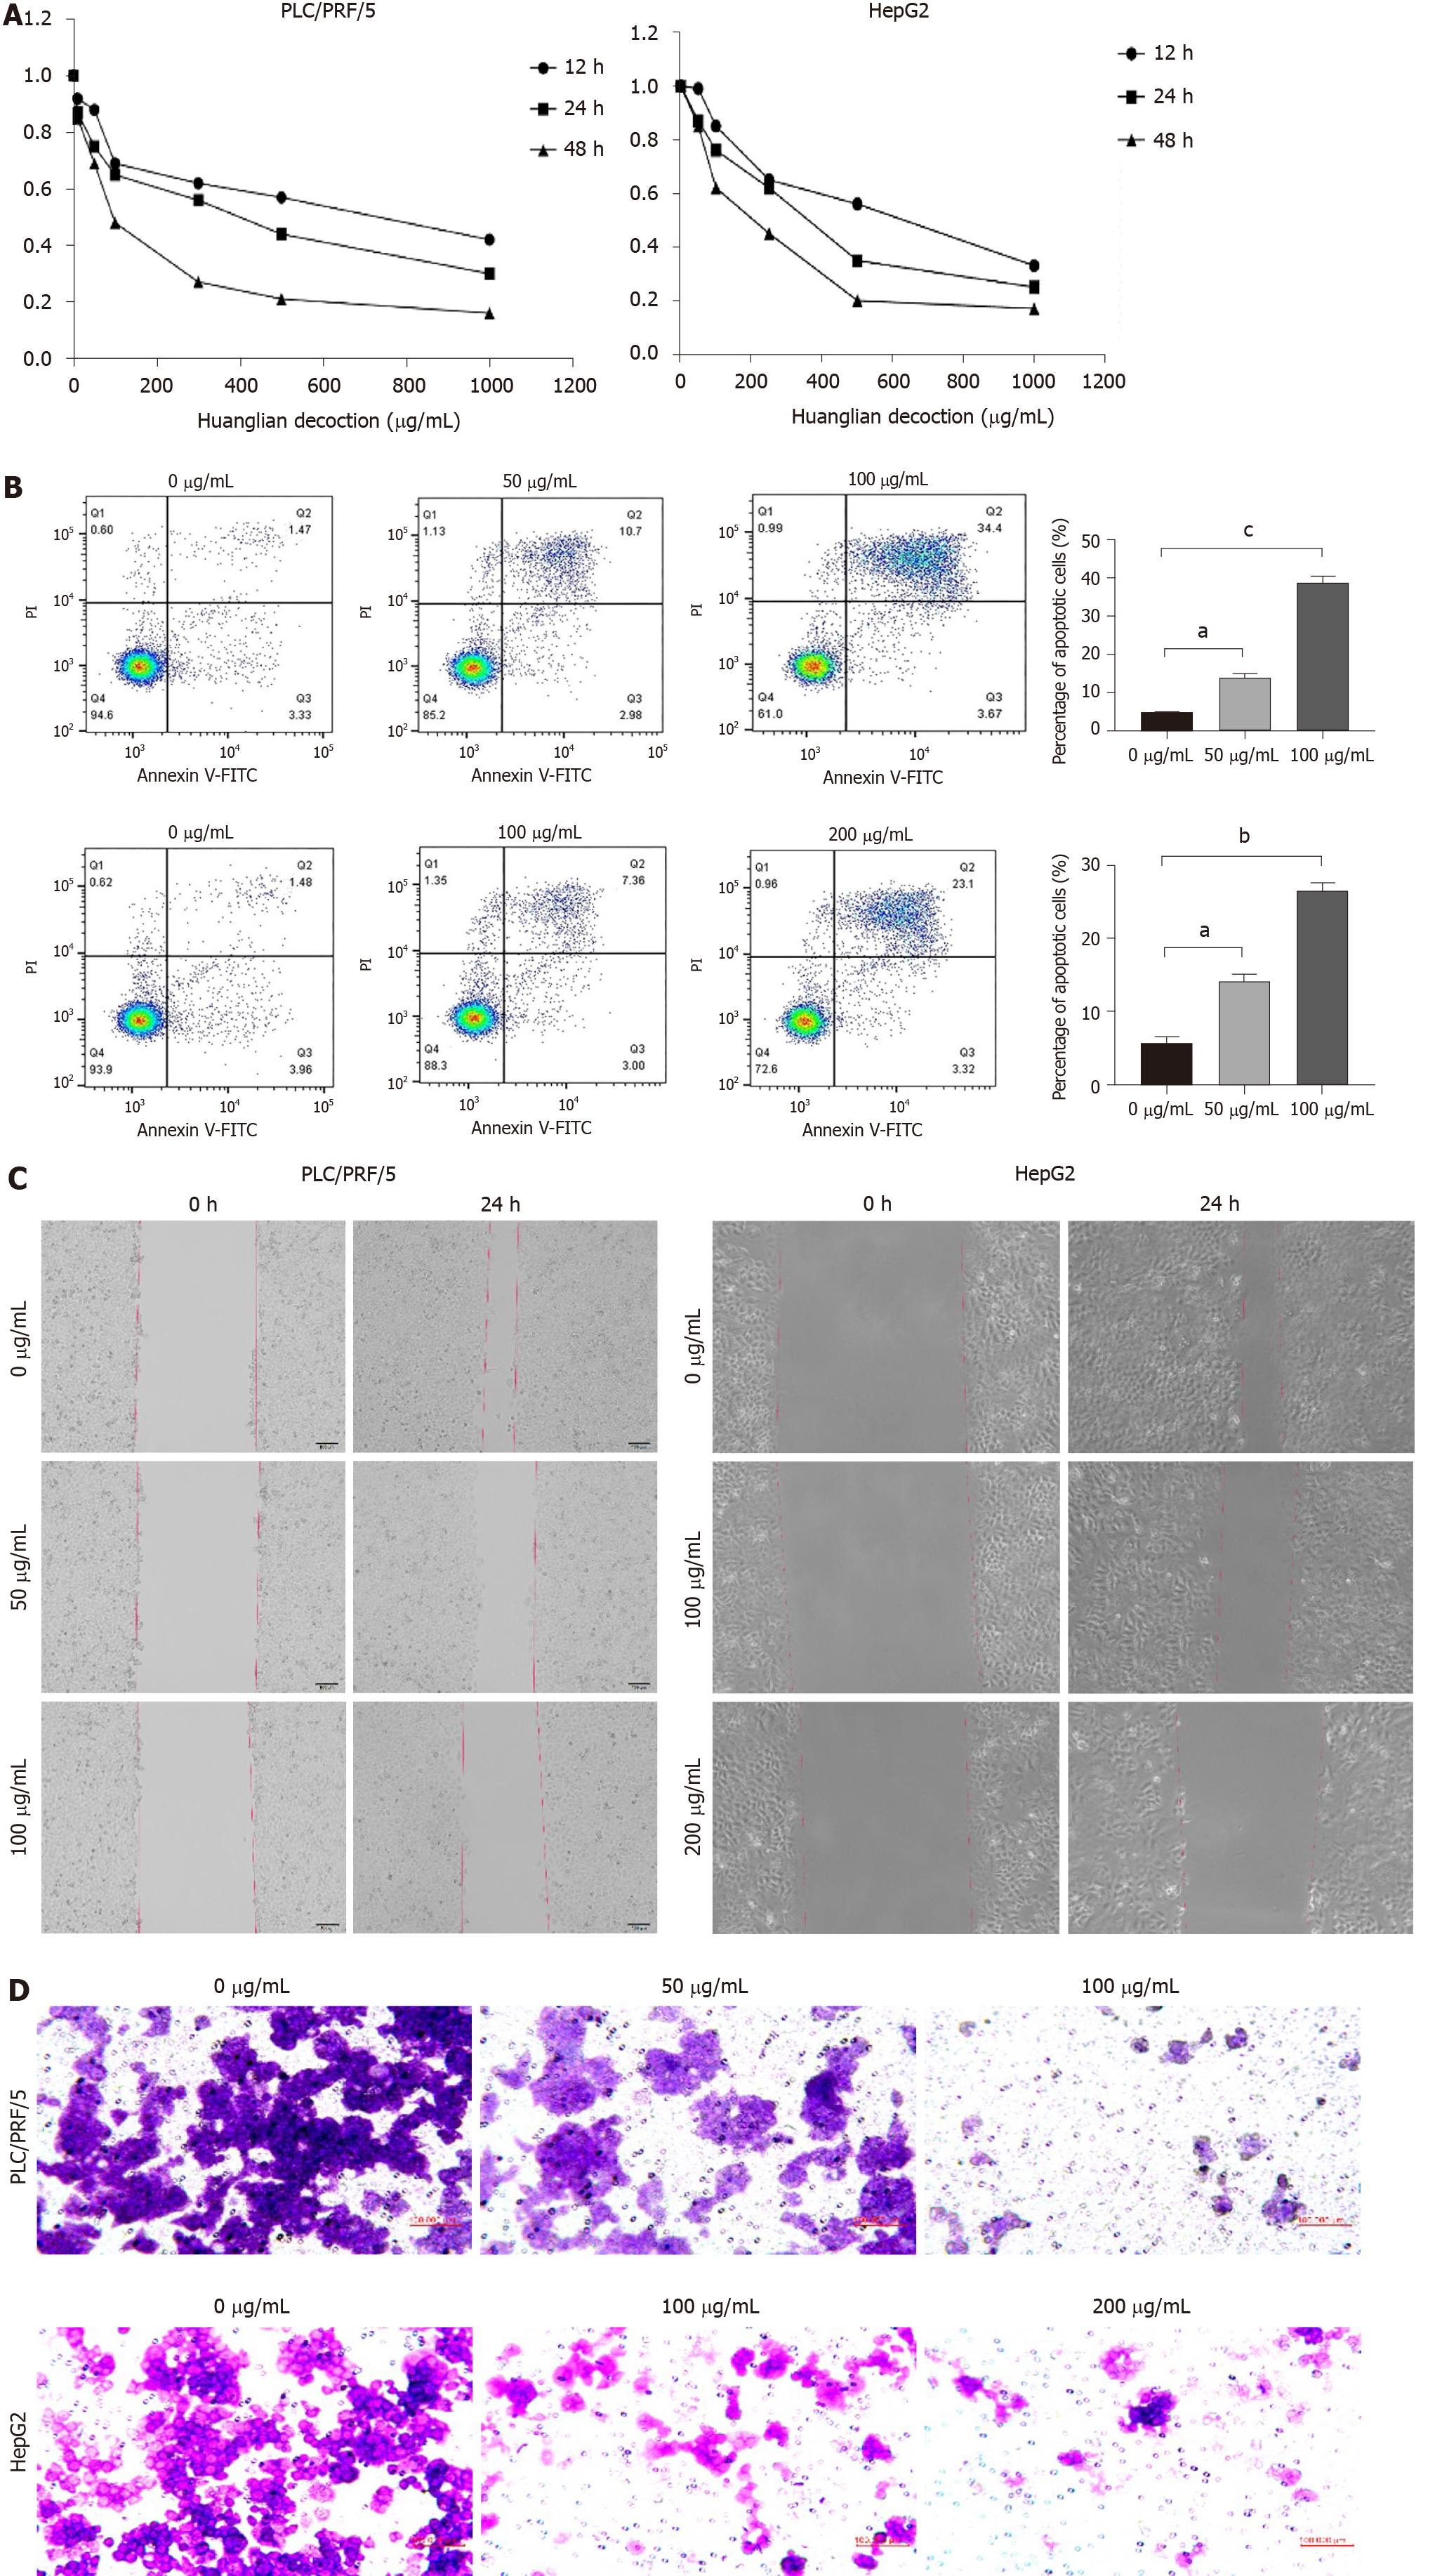
Figure 6 Huanglian decoction suppressed hepatocellular carcinoma cell growth in vitro.
A: Time- and dose-dependent effects of Huanglian decoction treatment on the viability of both PLC/PRF/5 and HepG2 cells; B: Huanglian decoction can induce apoptosis of both PLC/PRF/5 and HepG2 cells; C: Huanglian decoction can reduce the migration activity of both PLC/PRF/5 and HepG2 cells; D: Huanglian decoction can reduce the invasion activity of both PLC/PRF/5 and HepG2 cells. aP < 0.05 vs negative control (NC) group; bP < 0.01 vs NC group; cP < 0.001 vs NC group. FITC: Fluorescein isothiocyanate.
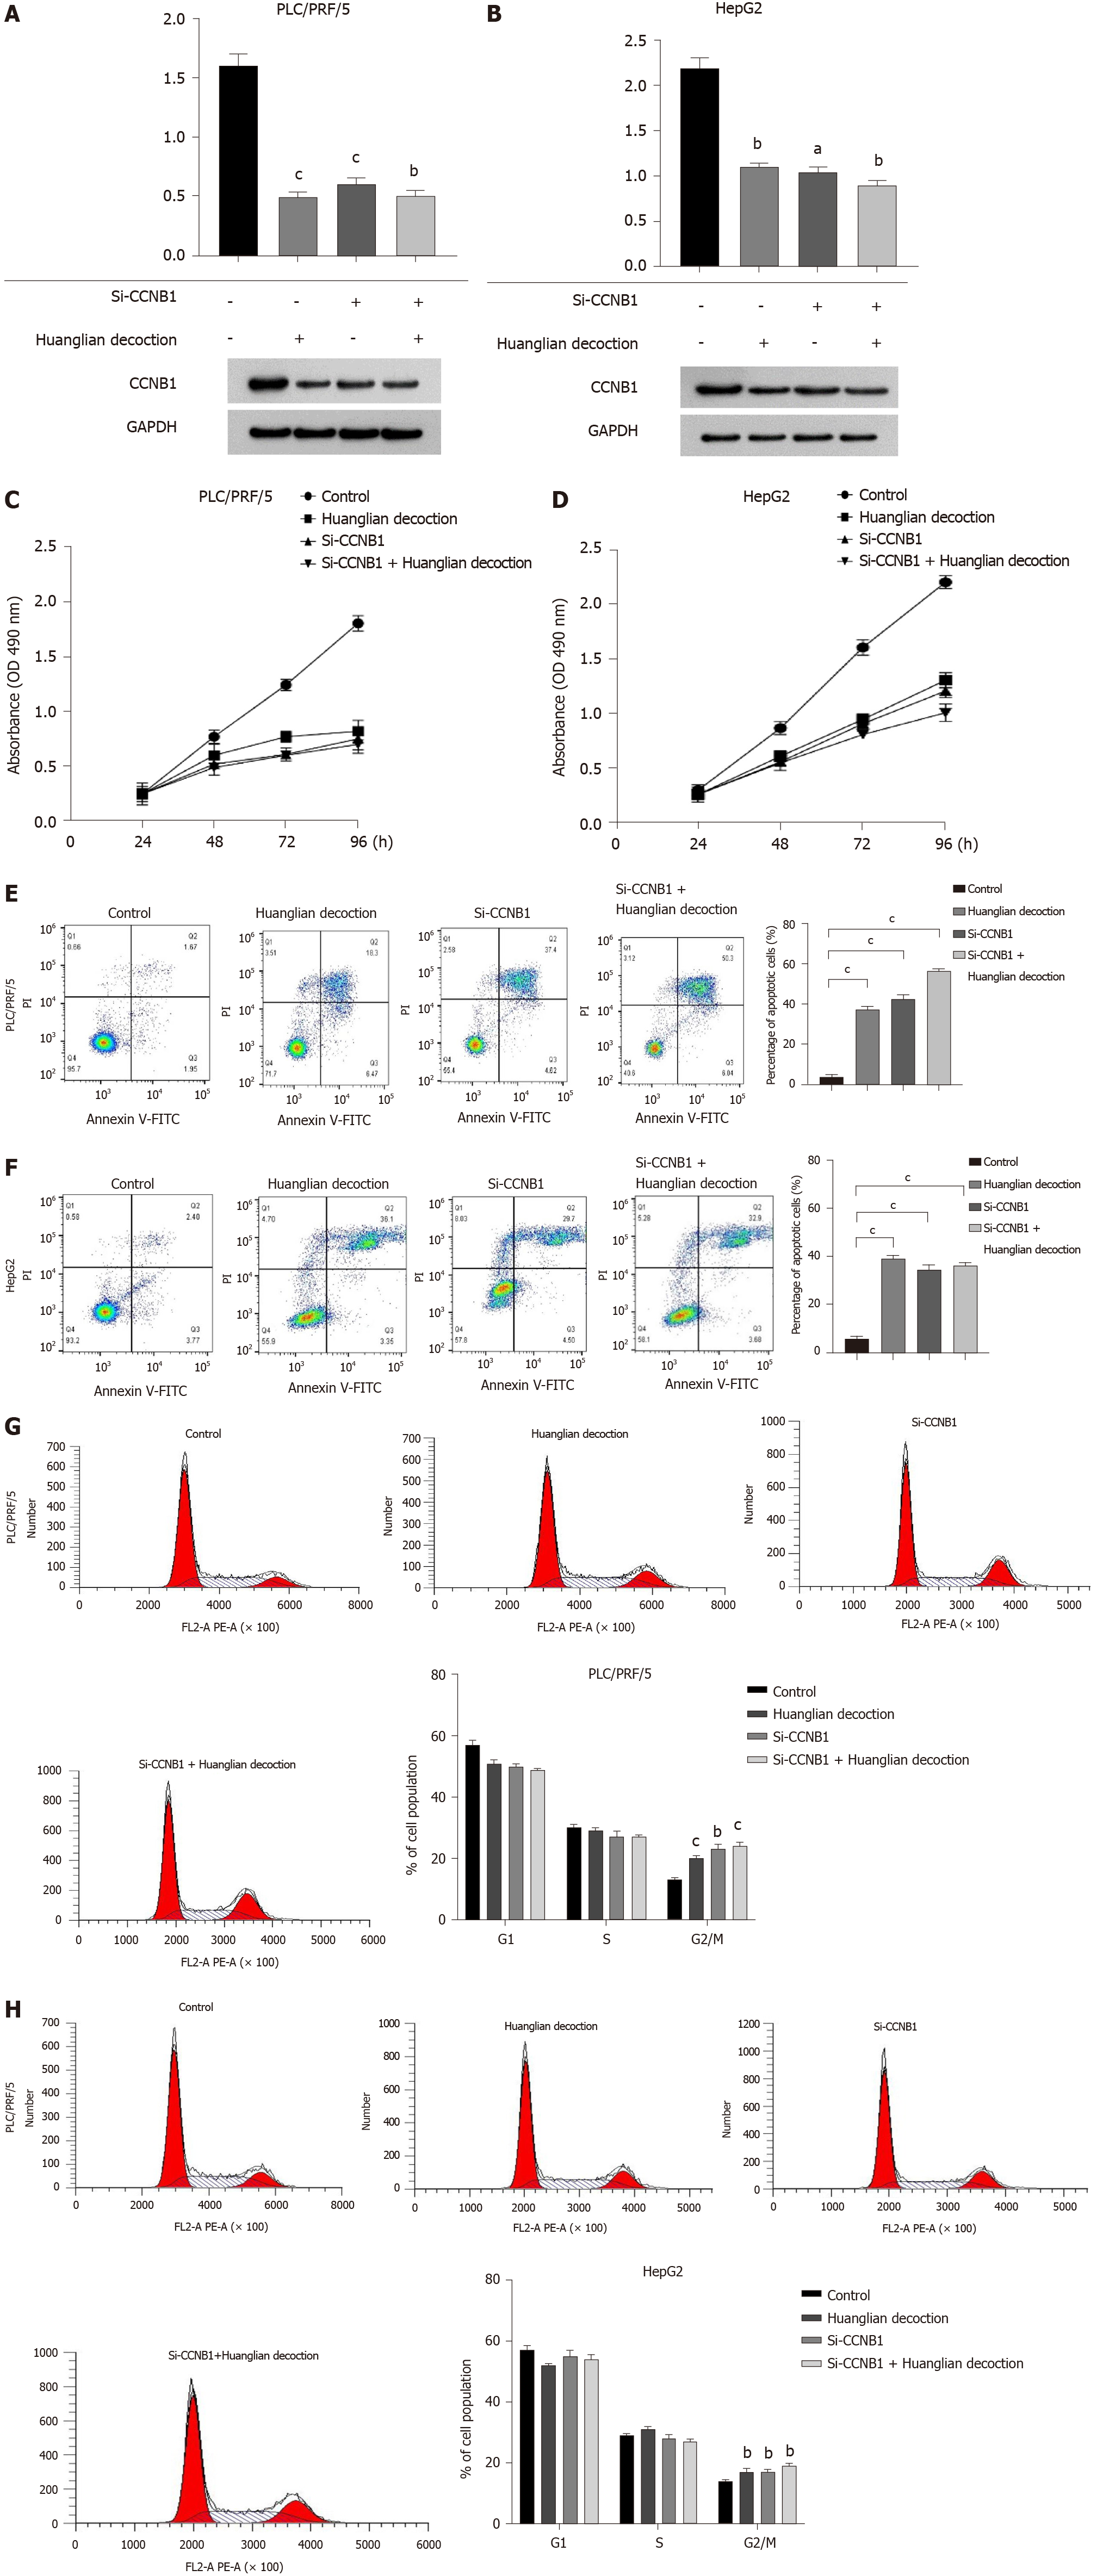
Figure 7 Huanglian decoction suppressed hepatocellular carcinoma cell growth in vitro by inhibiting the expression level of CCNB1 protein.
A and B: Huanglian decoction can reduce the expression level of CCNB1 protein in hepatocellular carcinoma cells, but has no significant effect on the transfected cells; C and D: At 24, 48, 72, and 96 h after transfection, cell proliferation was determined using the MTT assay; E and F: The level of cell apoptosis increased significantly after transfection, and Huanglian decoction had no significant effect on the cells after transfection; G and H: Huanglian decoction can induce G2/M phase arrest of PLC/PRF/5 and HepG2 cells. aP < 0.05 vs negative control (NC) group; bP < 0.01 vs NC group; cP < 0.001 vs NC group. FITC: Fluorescein isothiocyanate.
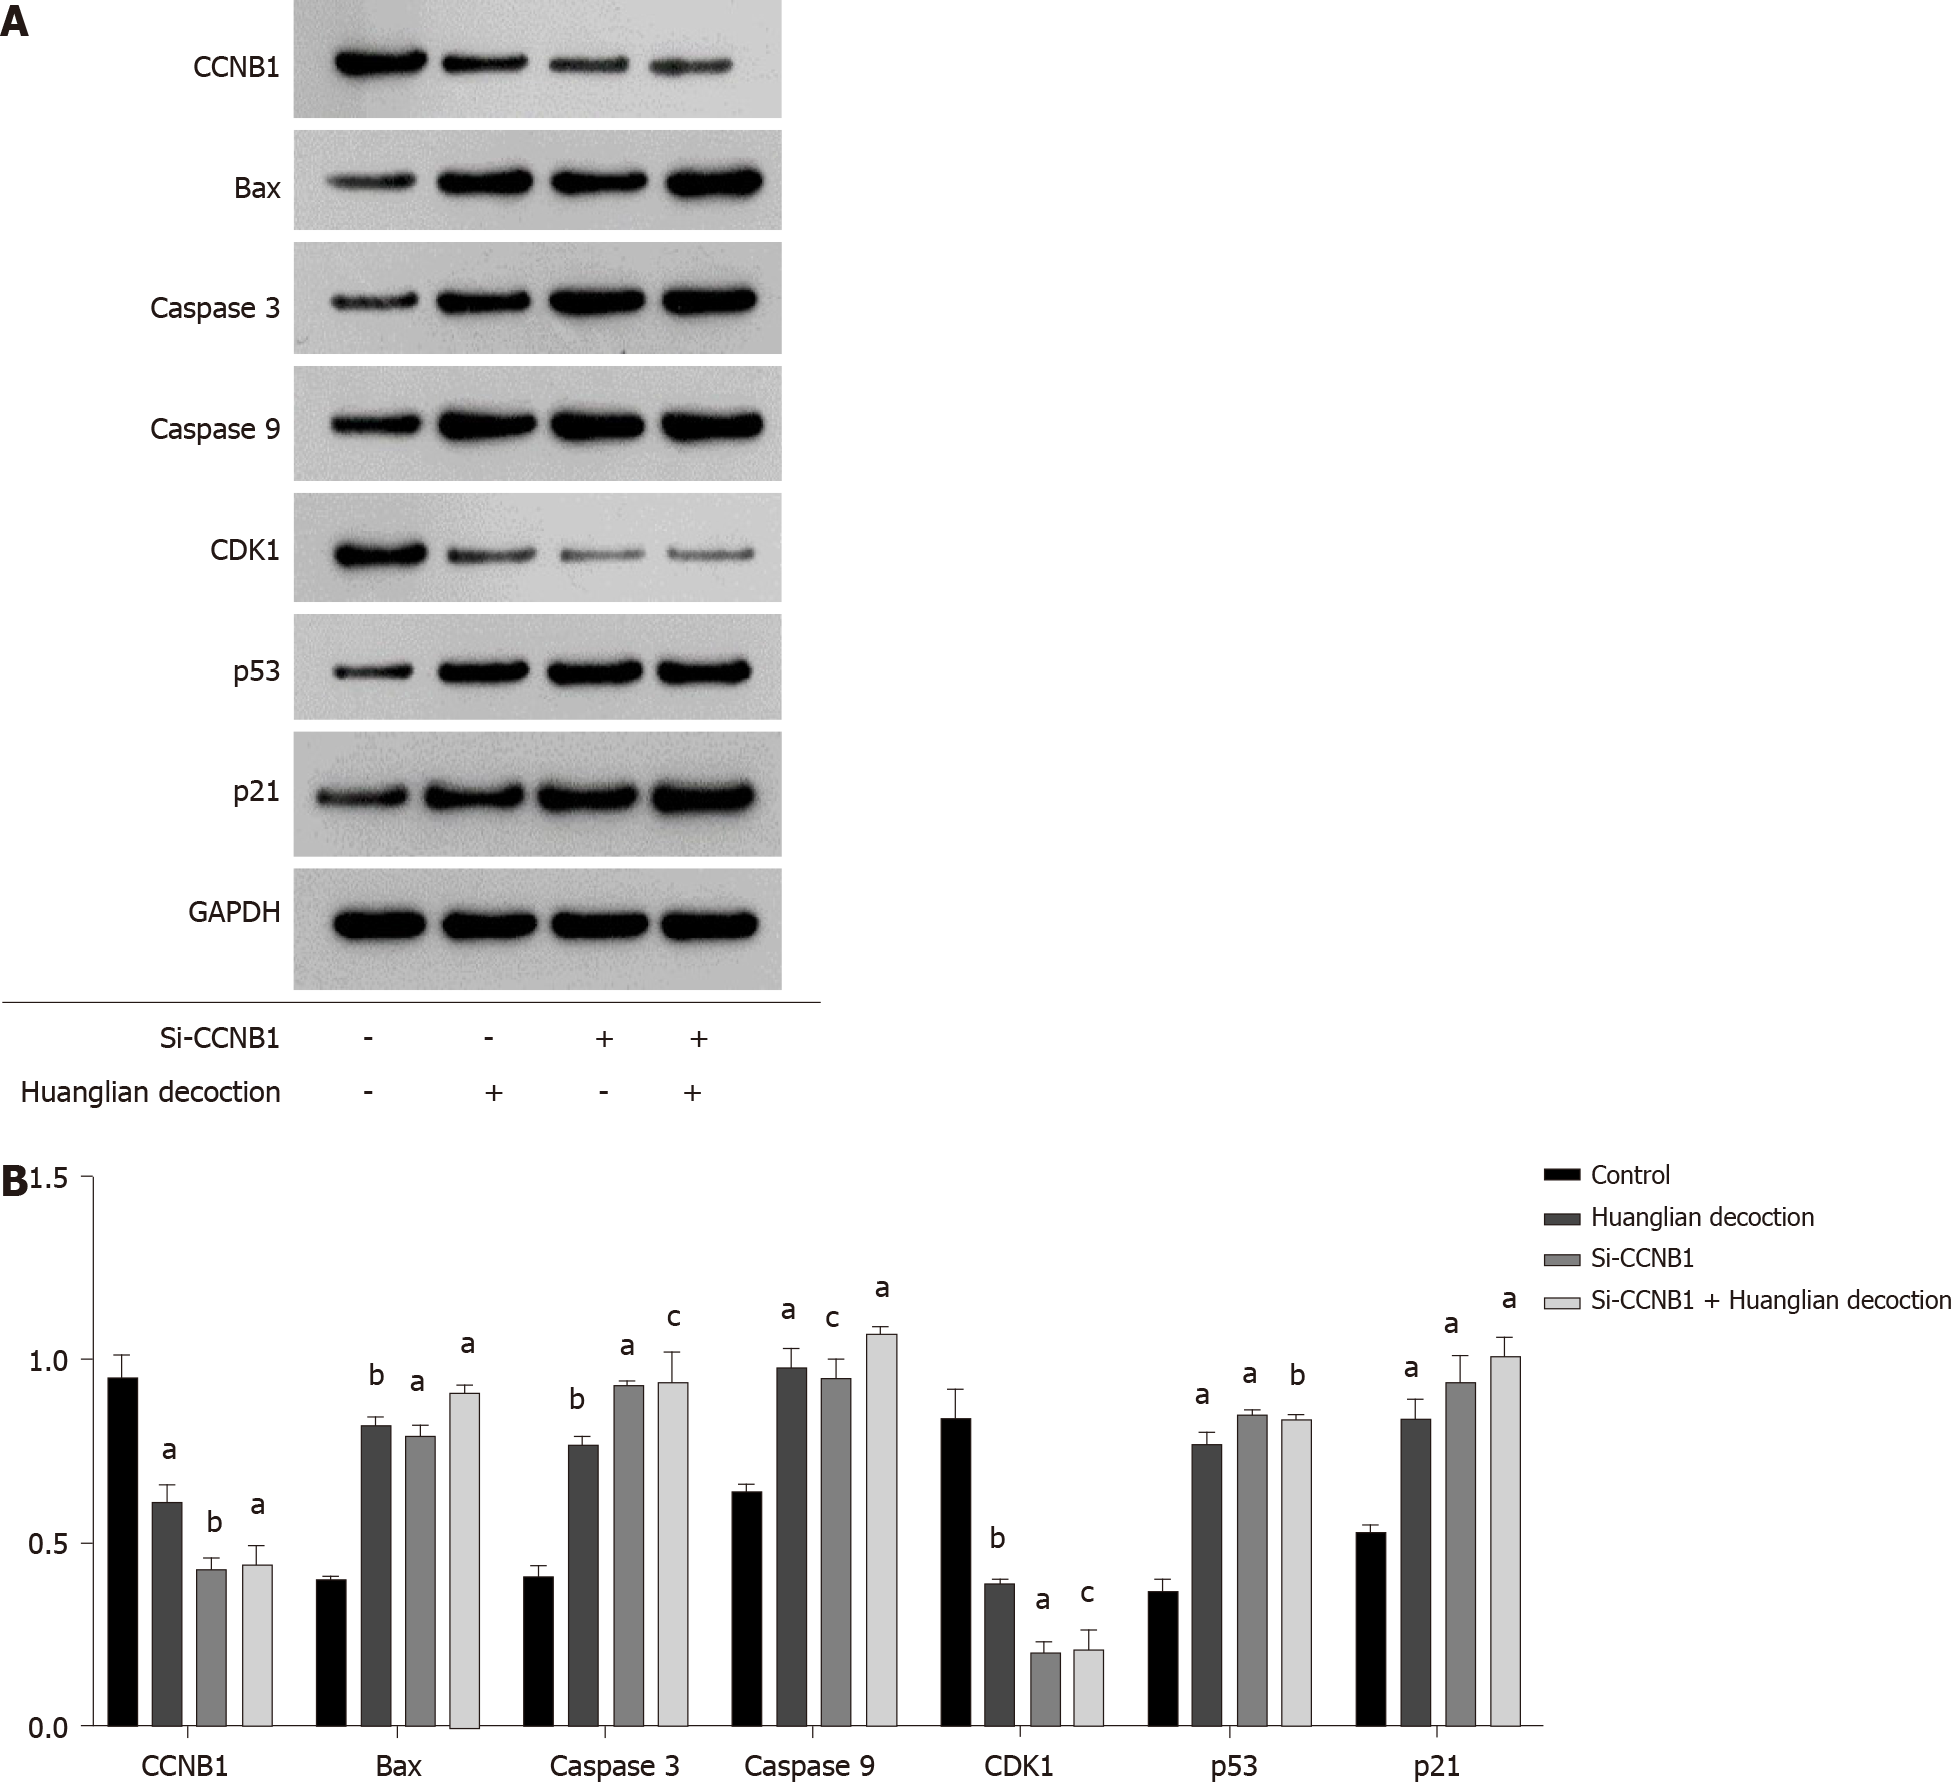
Figure 8 Protein expression of CCNB1, Bax, caspase 3, caspase 9, CDK1, p53, and p21 in the different groups by western blot.
A: Western blot analysis results; B: Histogram of protein expression levels. aP < 0.05 vs negative control (NC) group; bP < 0.01 vs NC group; cP < 0.001 vs NC group.
- Citation: Li M, Shang H, Wang T, Yang SQ, Li L. Huanglian decoction suppresses the growth of hepatocellular carcinoma cells by reducing CCNB1 expression. World J Gastroenterol 2021; 27(10): 939-958
- URL: https://www.wjgnet.com/1007-9327/full/v27/i10/939.htm
- DOI: https://dx.doi.org/10.3748/wjg.v27.i10.939


