©The Author(s) 2020.
World J Gastroenterol. Feb 28, 2020; 26(8): 789-803
Published online Feb 28, 2020. doi: 10.3748/wjg.v26.i8.789
Published online Feb 28, 2020. doi: 10.3748/wjg.v26.i8.789
Figure 1 High immune scores and stromal scores are significantly associated with better prognosis in patients with hapetocellular carcinoma.
A: Recurrence-free survival (RFS) between two groups based on immune scores; B: Overall survival (OS) between two groups based on immune scores; C: RFS between two groups based on stromal scores; D: OS between two groups based on stromal scores; E-J: Level of tumor-infiltrating immune cells in the two groups, including B cell, CD4+ T cell, CD8+ T cell, neutrophil, macrophage, and dendritic cell. There were 258 cases with high scores and 86 cases with low scores. aP = 6.9e-15, bP < 2.2e-16, cP = 8.8e-10. RFS: Recurrence-free survival; OS: Overall survival.
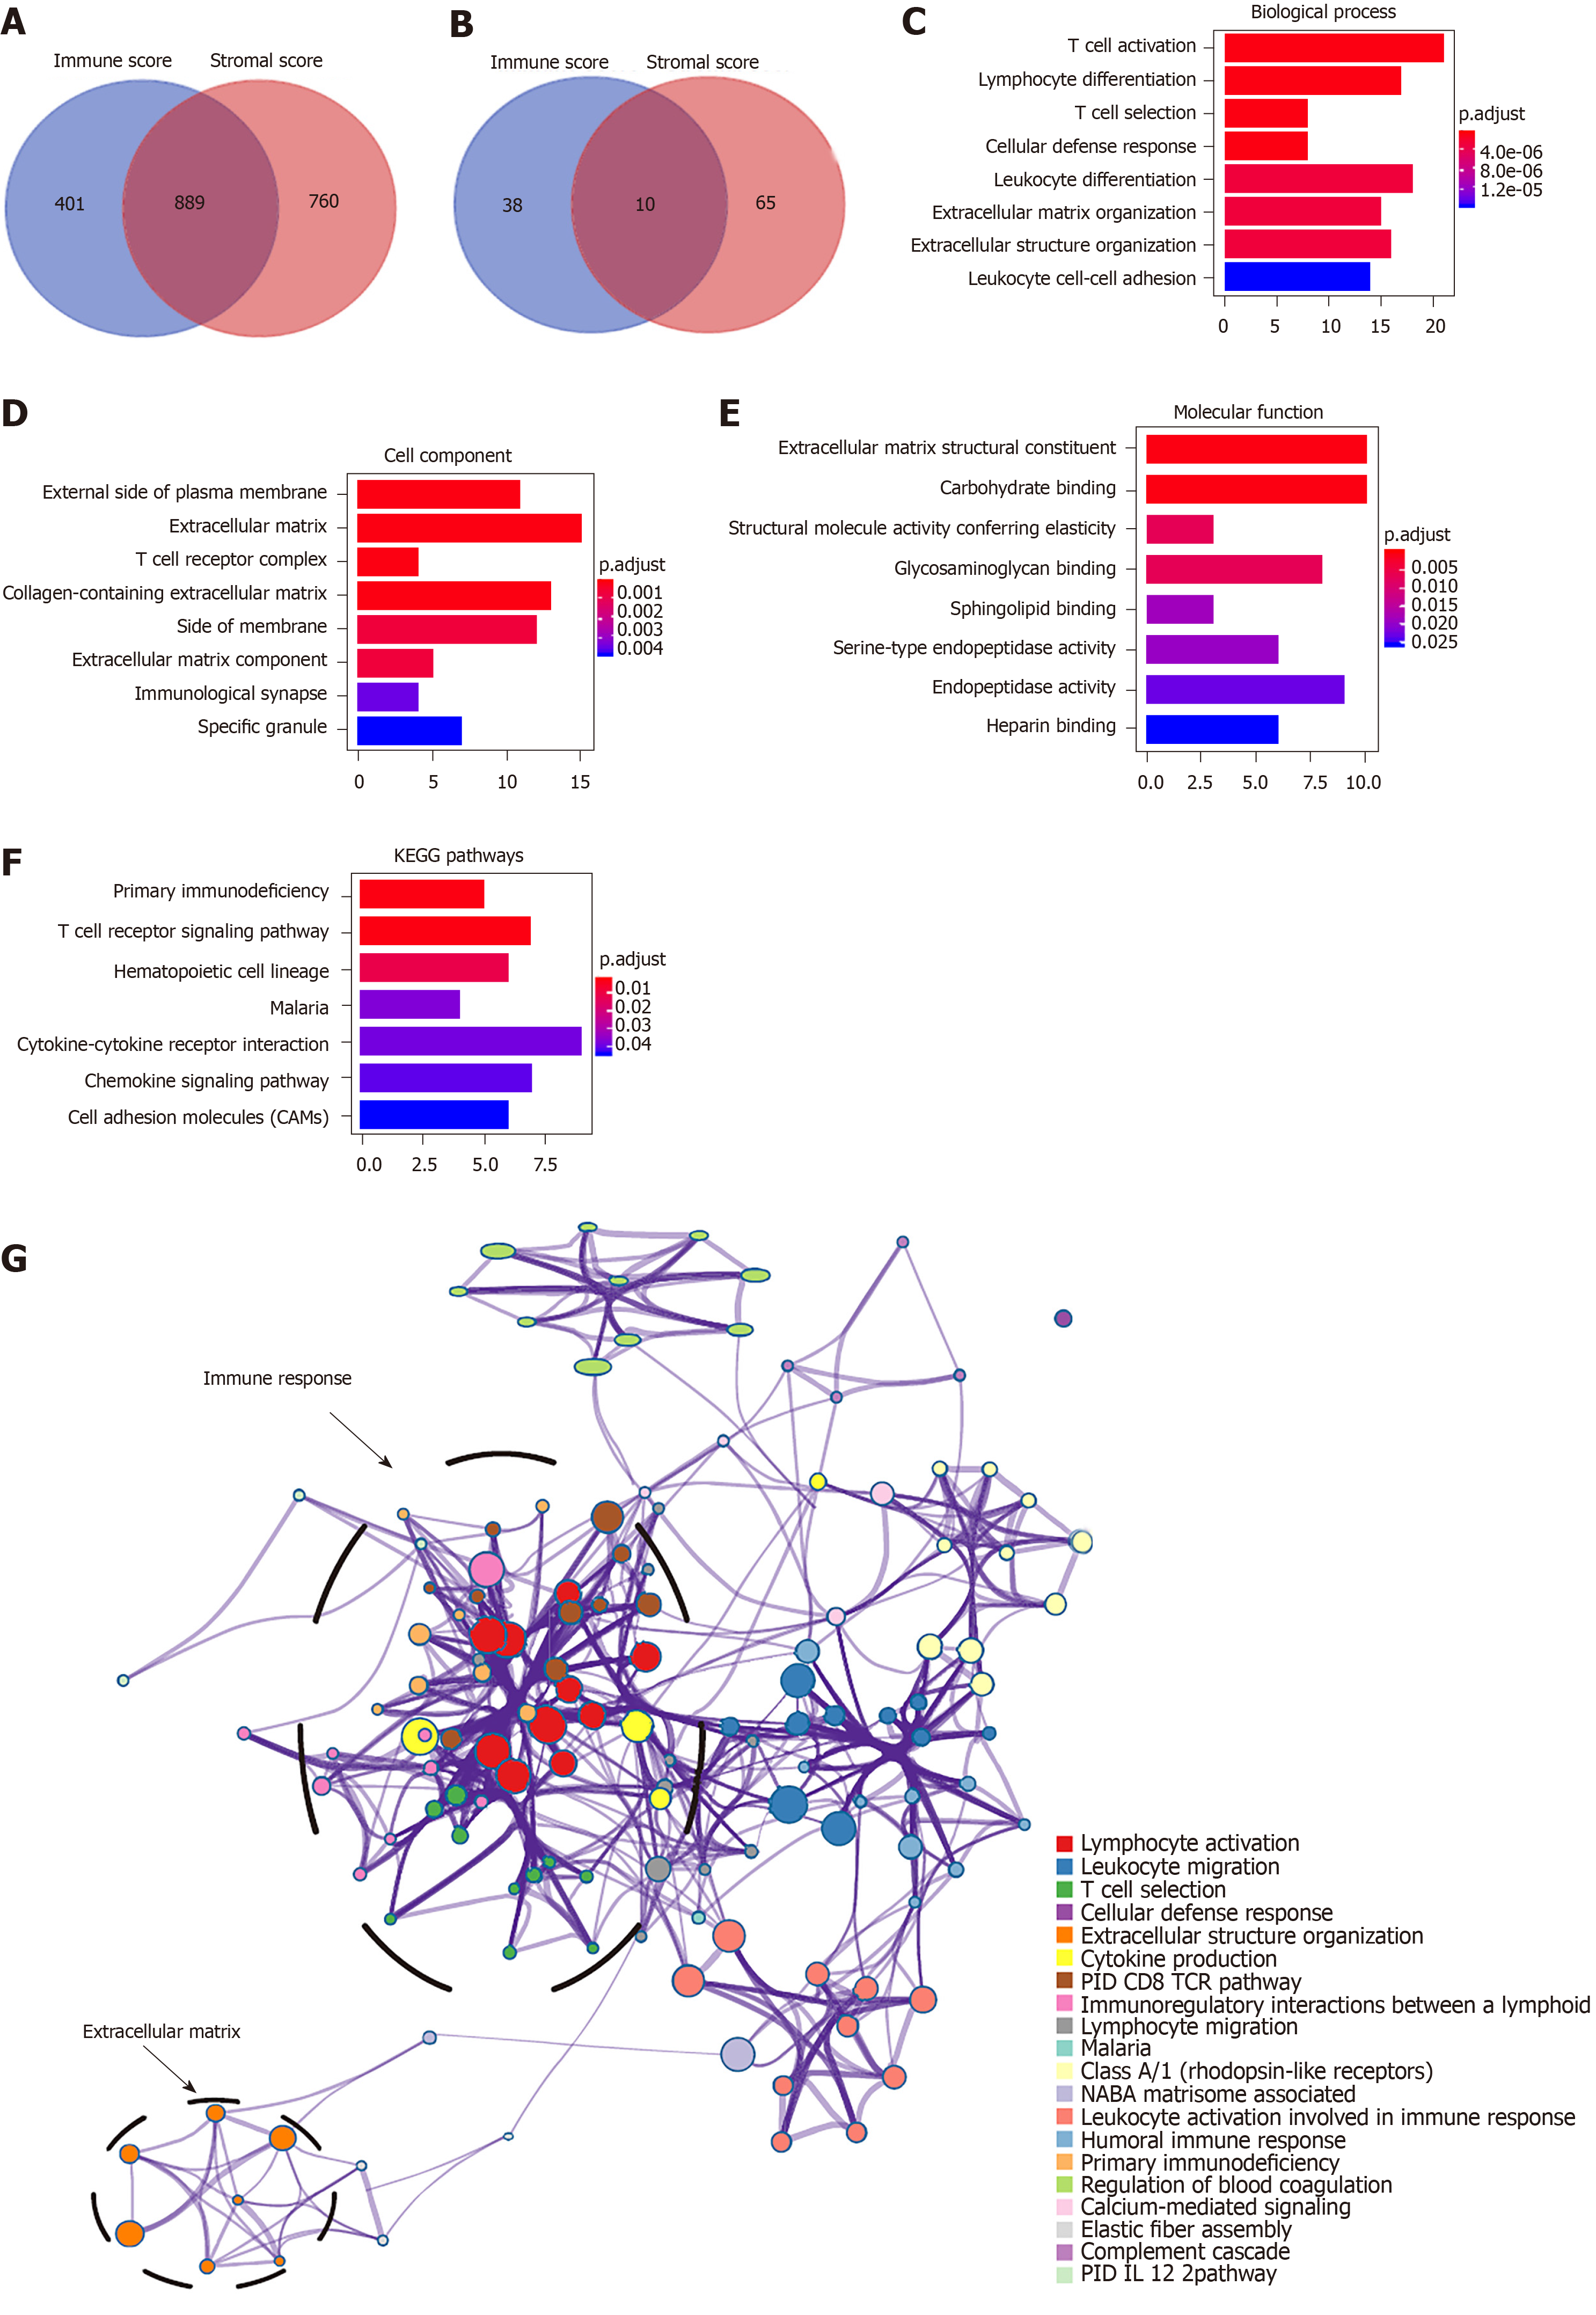
Figure 2 Pathway and process enrichment analysis of prognosis-related differentially expressed genes in hapetocellular carcinoma.
A and B: Venn diagrams showing the number of simutaneously downregulated (A) or upregulated (B) differentially expressed genes (DEGs) in immune or stromal score groups; C-F: Gene ontology terms and Kyoto Encyclopedia of Genes and Genomes (KEGG) pathway analysis across 147 DEGs with regard to (C) biological process, (D) cellular component, (E) molecular function, and (F) KEGG pathway. G: Network of enriched terms. Nodes that share the same terms are typically close to each other. KEGG: Kyoto Encyclopedia of Genes and Genomes.
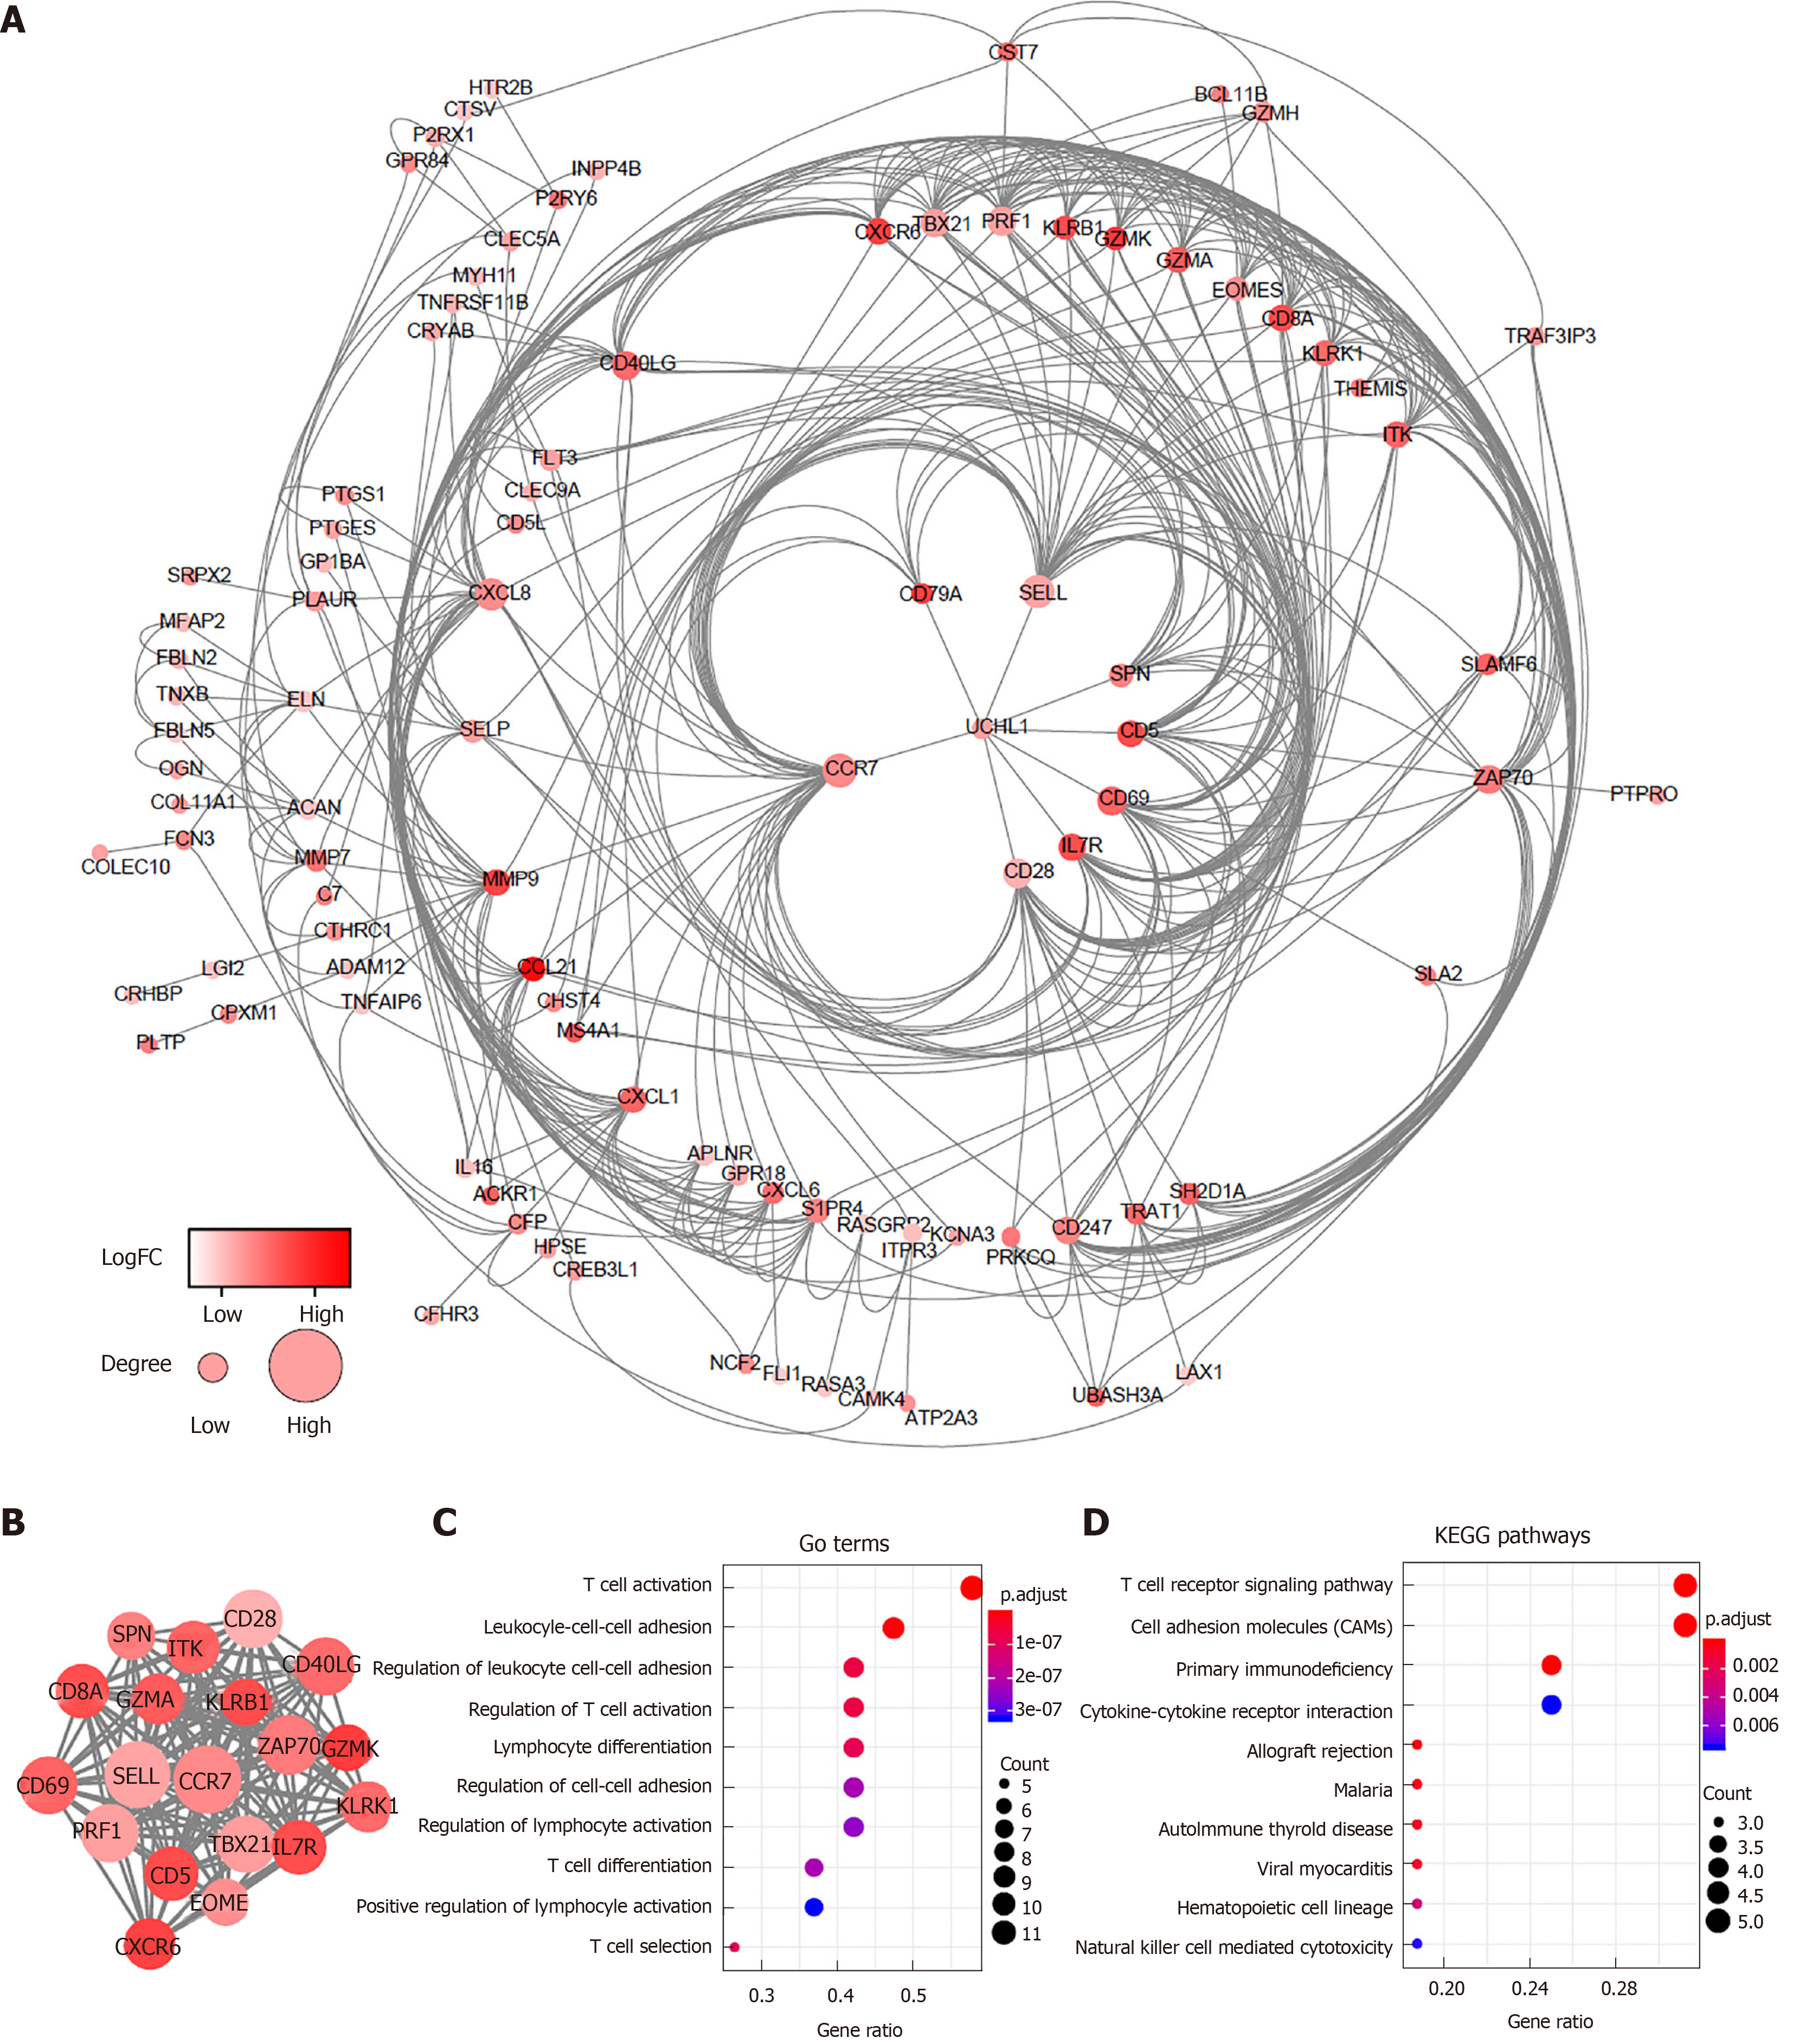
Figure 3 Protein-protein interaction network and module analysis of prognosis-related differentially expressed genes.
A: Protein-protein interaction (PPI) network of all 147 differentially expressed genes; B: PPI network of the module. The color of nodes in the PPI network reflects the log (FC) value of the Z score of gene expression, and the size of nodes means the number of interacting proteins with the designated protein; C and D: Gene ontology terms and KEGG pathway analysis for the genes in the module. GO: Gene ontology; KEGG: Kyoto Encyclopedia of Genes and Genomes.
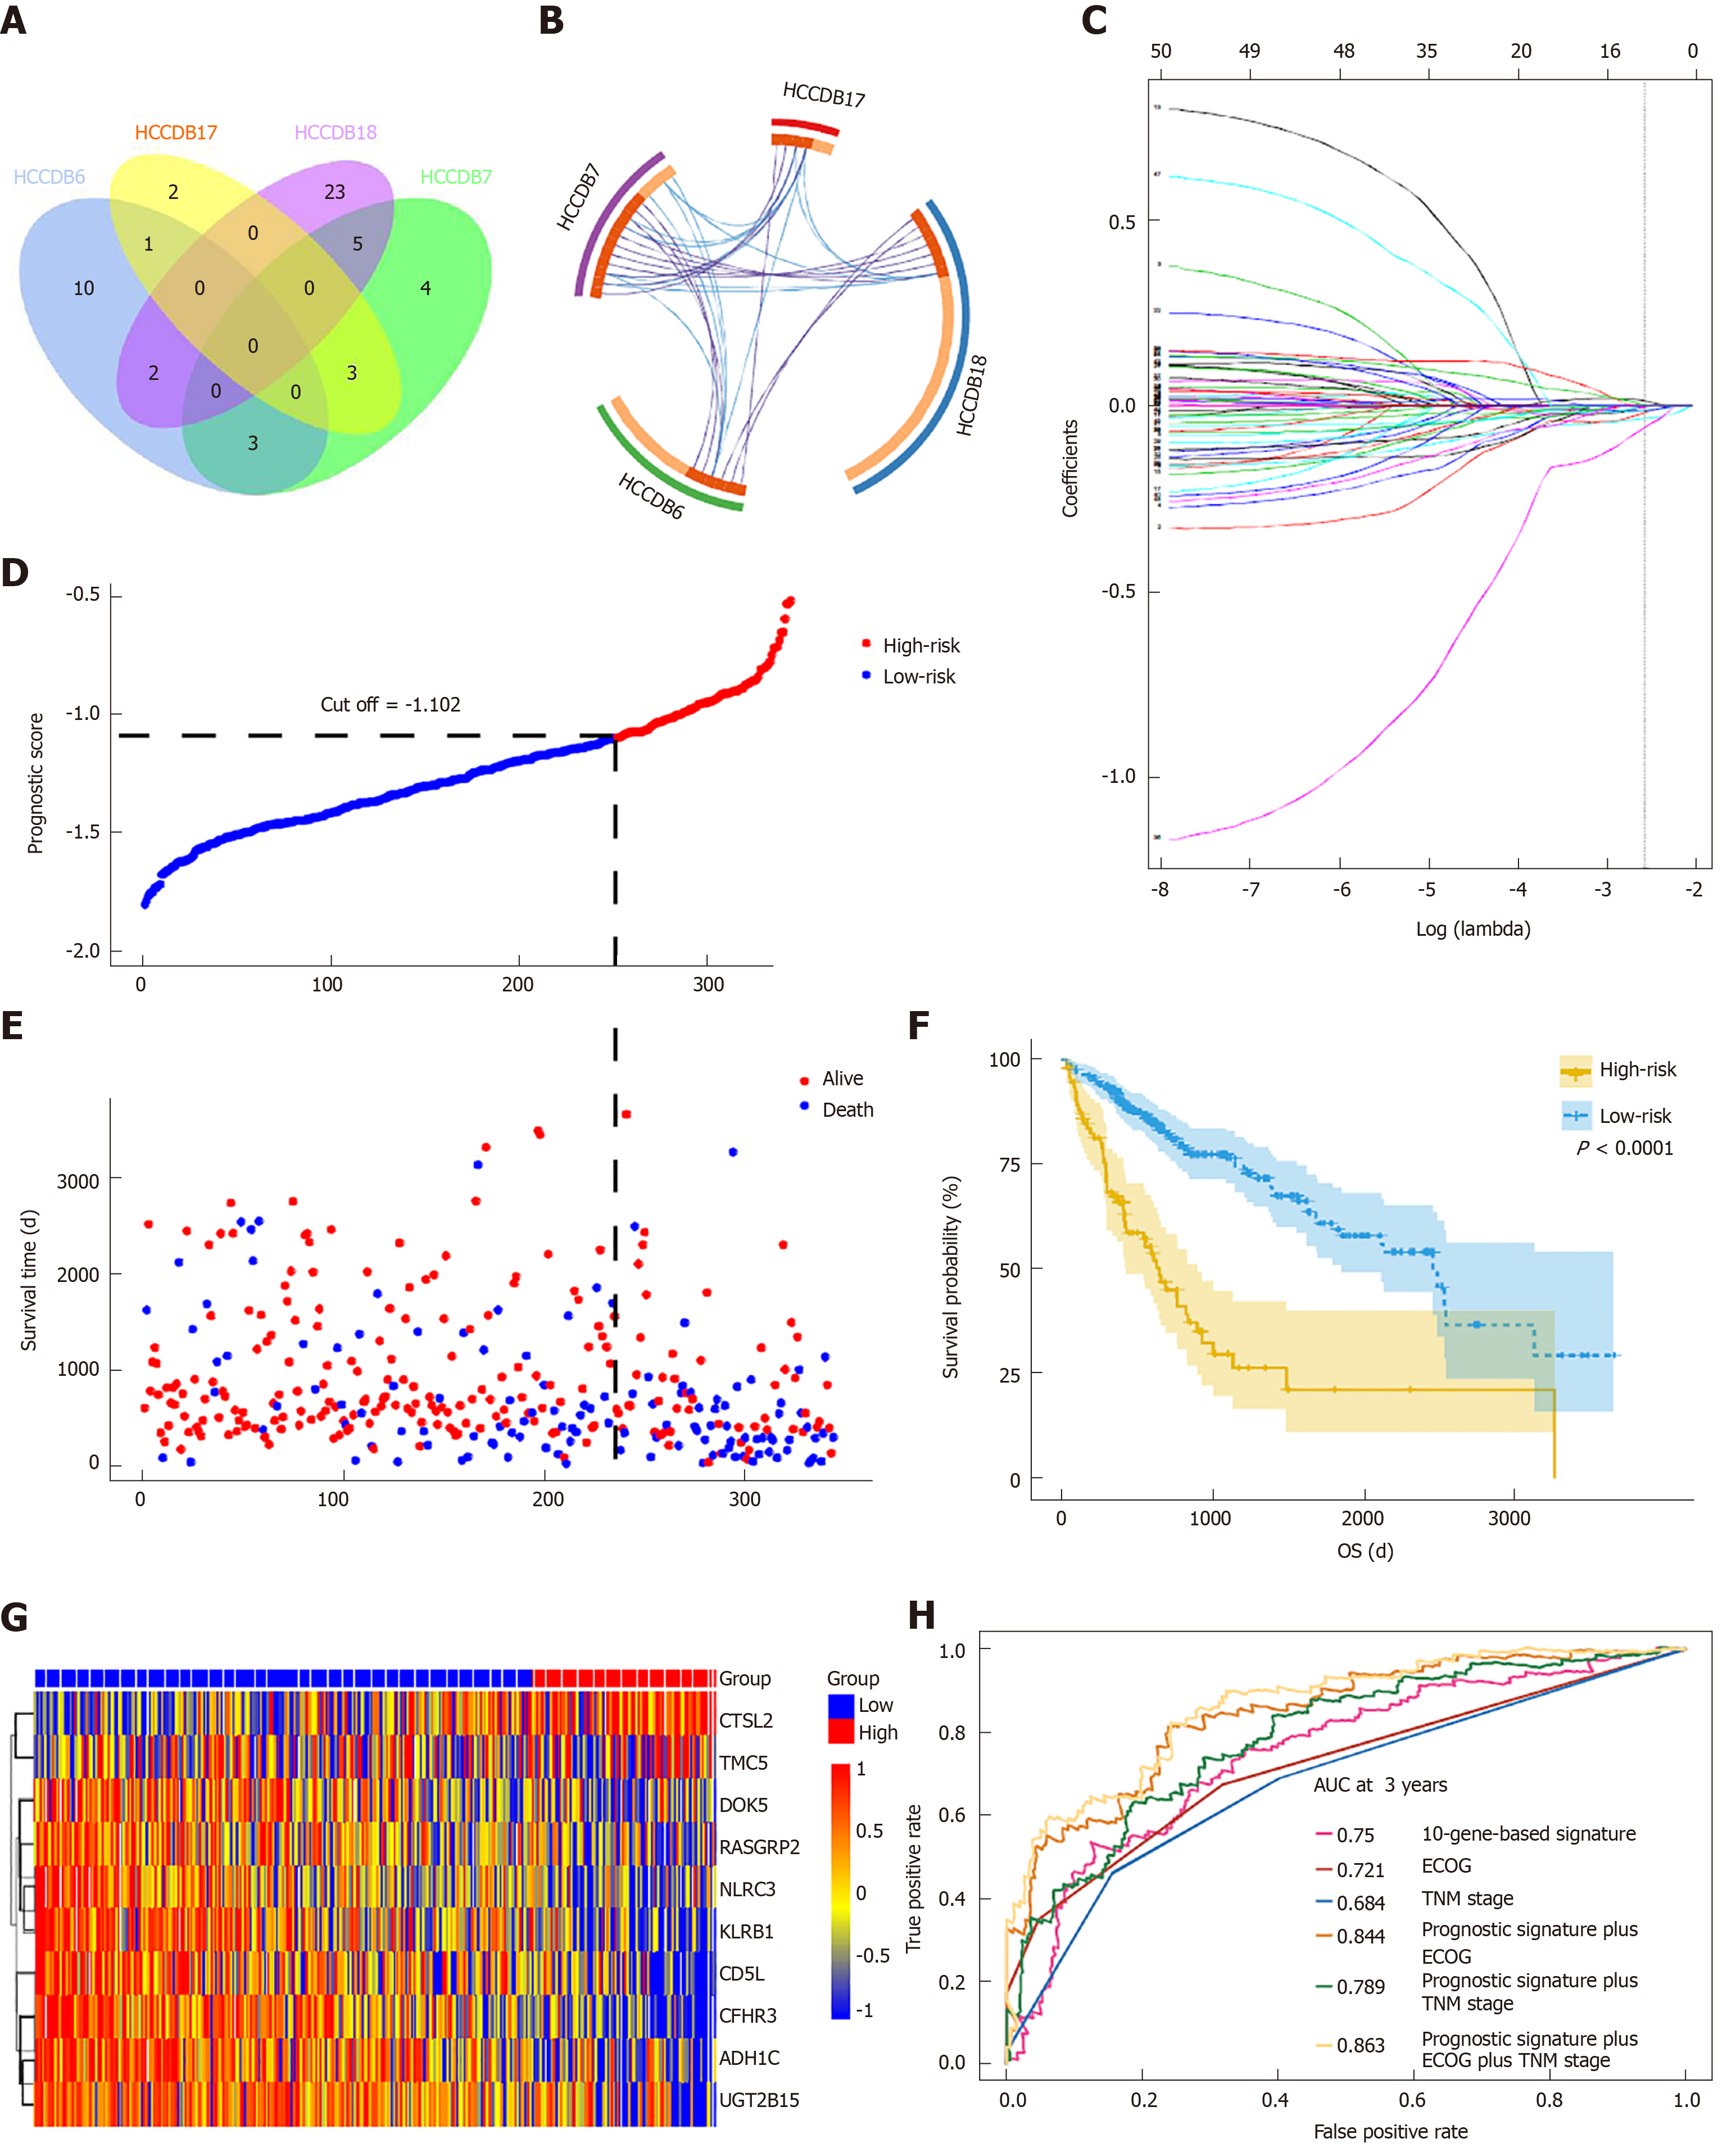
Figure 4 Prognosis-related differentially expressed genes validated in four additional cohorts and construction of the prognostic gene signature.
A: Venn diagram showing the results of genes validated in four cohorts; B: Circos plot showing overlapping genes between the four cohorts. Purple curves link identical genes while blue curves link genes that belong to the same enriched ontology term; C: LASSO coefficient profiles of 52 genes validated in four cohorts; D: Distribution of risk scores; E: Patients’ survival time and status. The black dotted line indicates the optimum cutoff dividing patients into low- and high-risk groups; (F) Kaplan-Meier curves for low- and high-risk groups; G: Heat map of ten key genes in the genes signature; H: Time-dependent receiver operating characteristic curves for comparing prediction accuracy among the ten-gene-based signature and clinicopathological features.
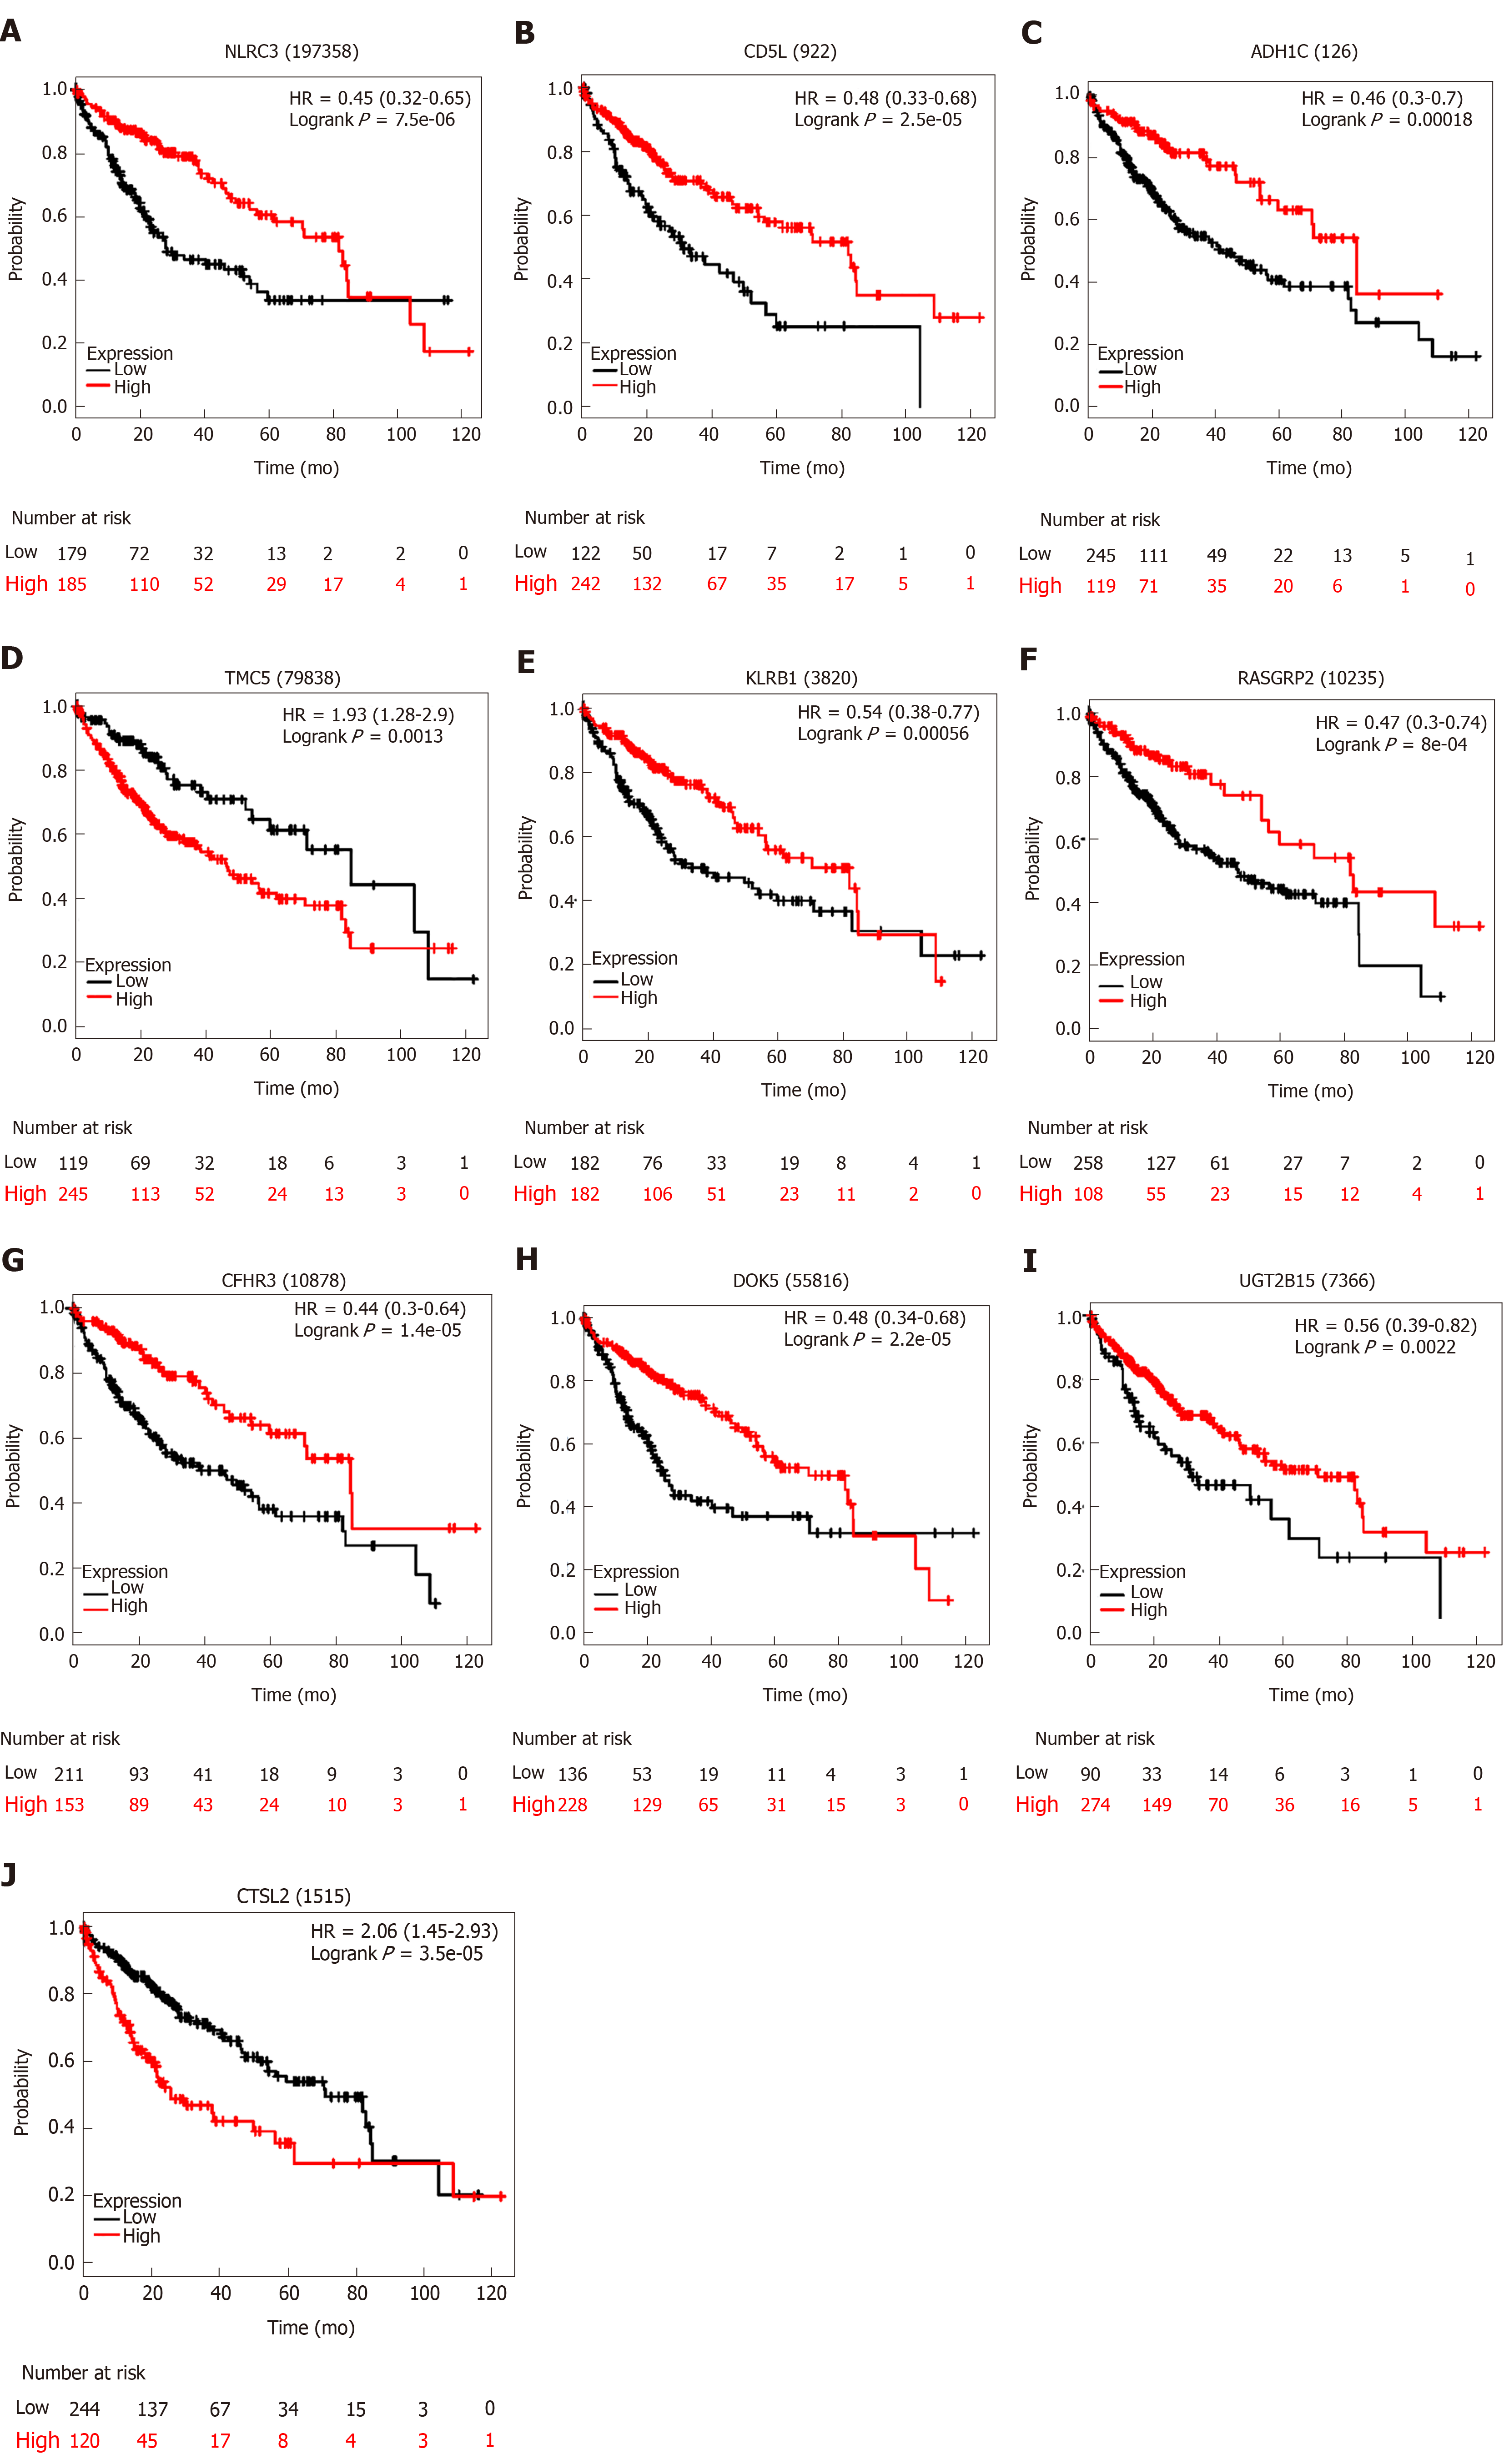
Figure 5 Correlation of expression of the ten genes with overall survival in The Cancer Genome Atlas.
Kaplan-Meier survival curves were generated by using the website “Kaplan Meier plotter” (http://kmplot.com/analysis). The the best performing threshold was selected as a cutoff.
- Citation: Pan L, Fang J, Chen MY, Zhai ST, Zhang B, Jiang ZY, Juengpanich S, Wang YF, Cai XJ. Promising key genes associated with tumor microenvironments and prognosis of hepatocellular carcinoma. World J Gastroenterol 2020; 26(8): 789-803
- URL: https://www.wjgnet.com/1007-9327/full/v26/i8/789.htm
- DOI: https://dx.doi.org/10.3748/wjg.v26.i8.789


