©The Author(s) 2020.
World J Gastroenterol. Dec 28, 2020; 26(48): 7679-7692
Published online Dec 28, 2020. doi: 10.3748/wjg.v26.i48.7679
Published online Dec 28, 2020. doi: 10.3748/wjg.v26.i48.7679
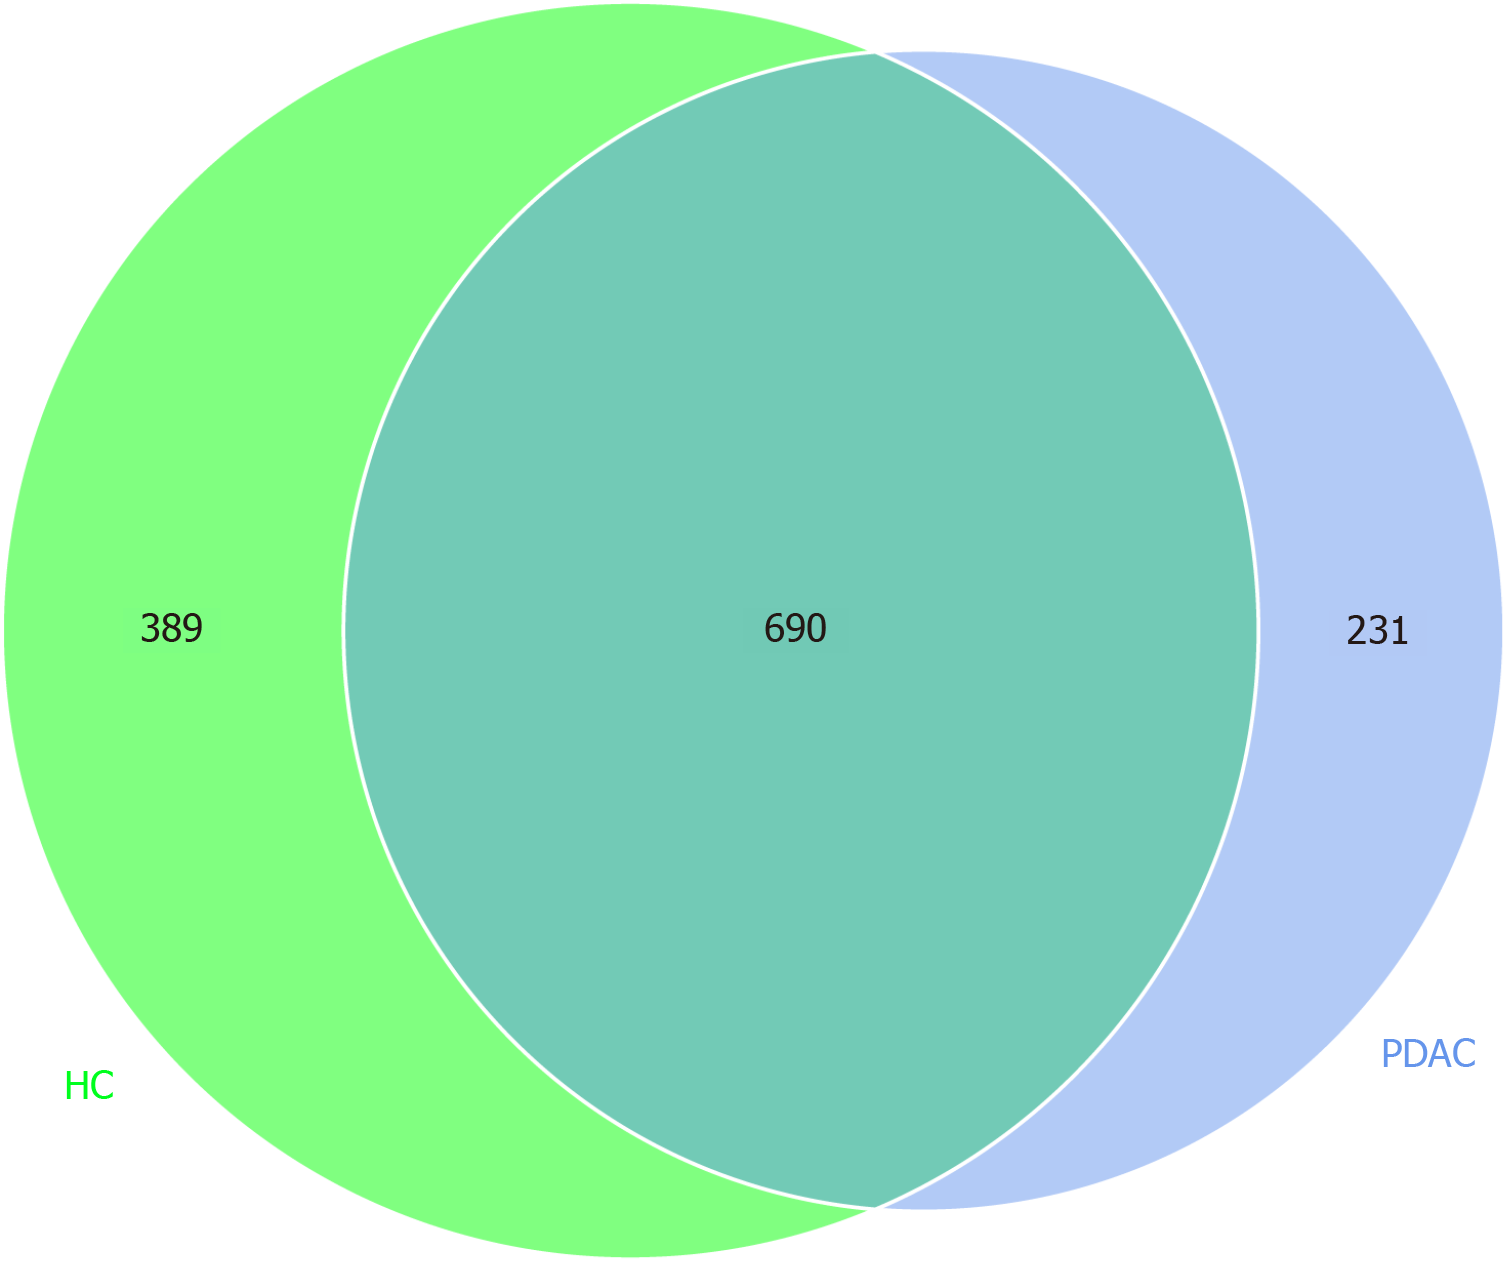
Figure 1 Microbial profiles of two groups.
Venn diagram showing shared and unique operational taxonomic units (OTUs) at 97% identity among pancreatic adenocarcinoma (PDAC) group (n = 41) and healthy controls (HC) group (n = 69). PDAC group is blue; HC group is green. OTUs (690) are shared by two groups. Unique OTUs of 231 and 389 were found in PDAC and HC, respectively.
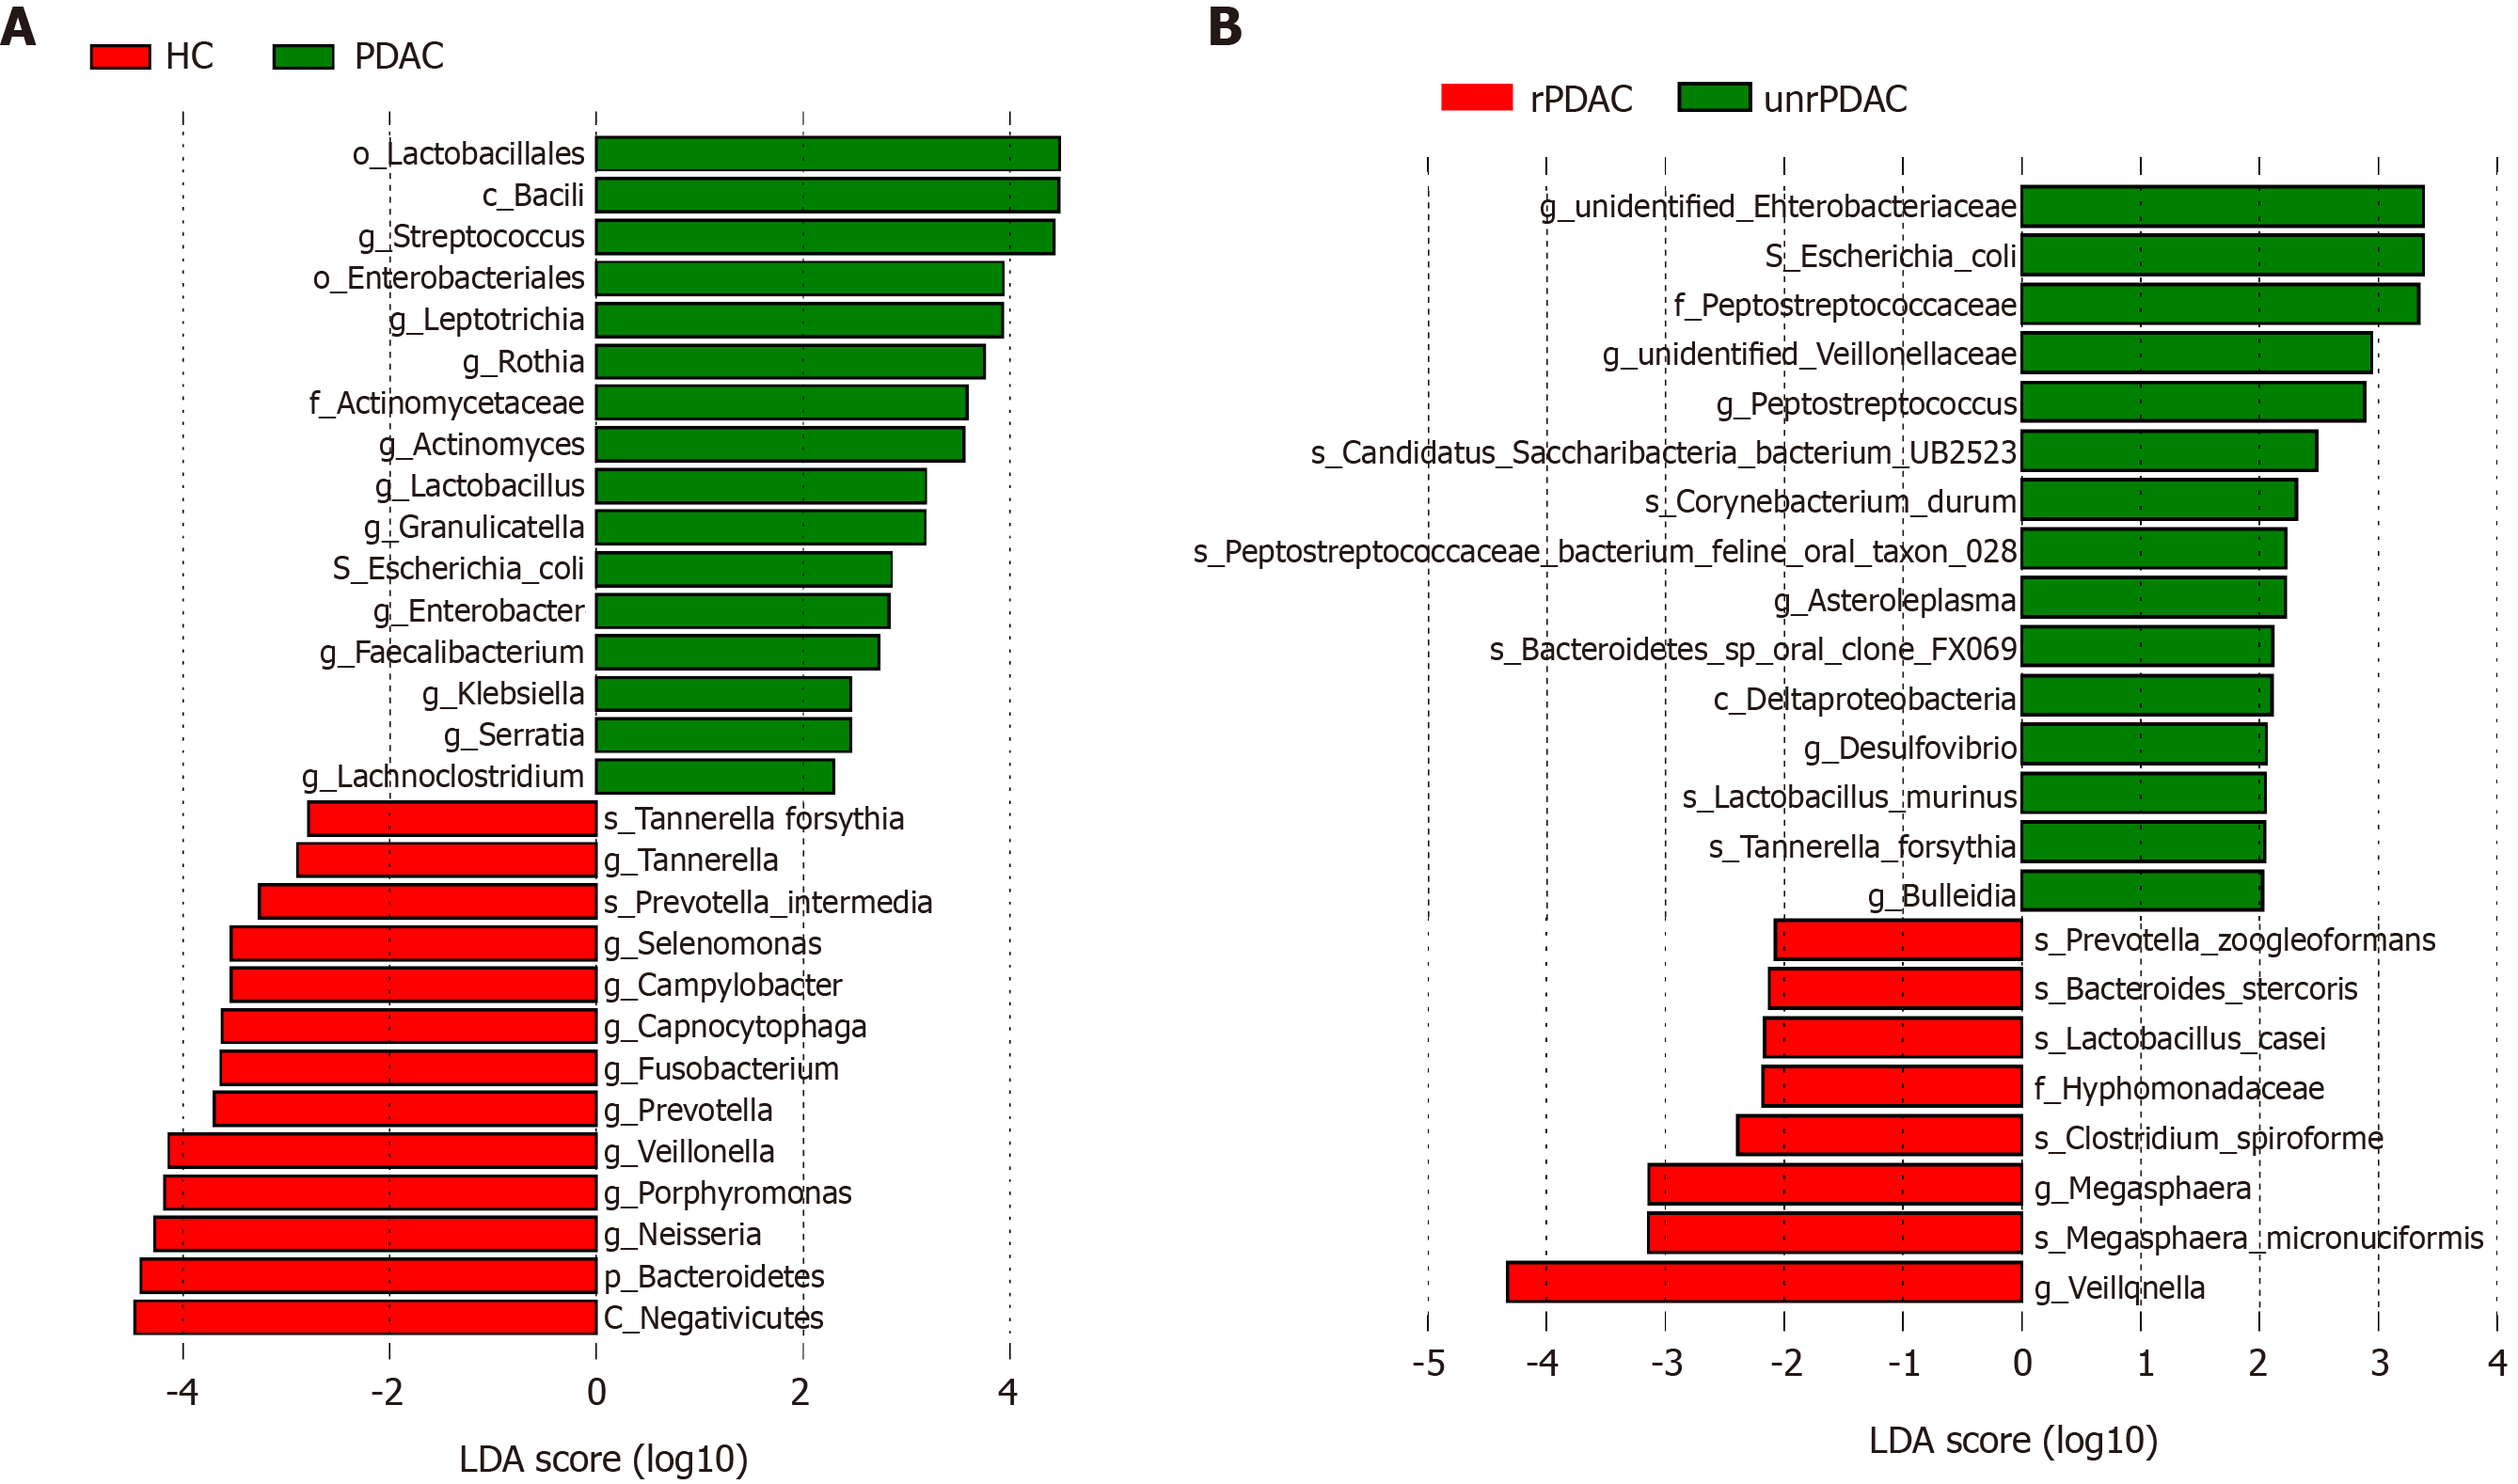
Figure 2 Linear discriminant analysis effect size and latent dirichlet allocation analysis based on operational taxonomic units.
A: Shows a list of specific oral bacteria that enable discrimination between pancreatic adenocarcinoma (PDAC) patients and healthy controls (HC). Differences in oral microbial communities between PDAC patients and HC. The horizontal line with red and green denotes the means of the HC and PDAC groups, respectively; B: Resectable PDAC (rPDAC) and unresectable PDAC (unrPDAC). Differences in oral microbial communities between rPDAC group and unrPDAC. The horizontal line with red and green denotes the means of the rPDAC and unrPDAC groups, respectively.
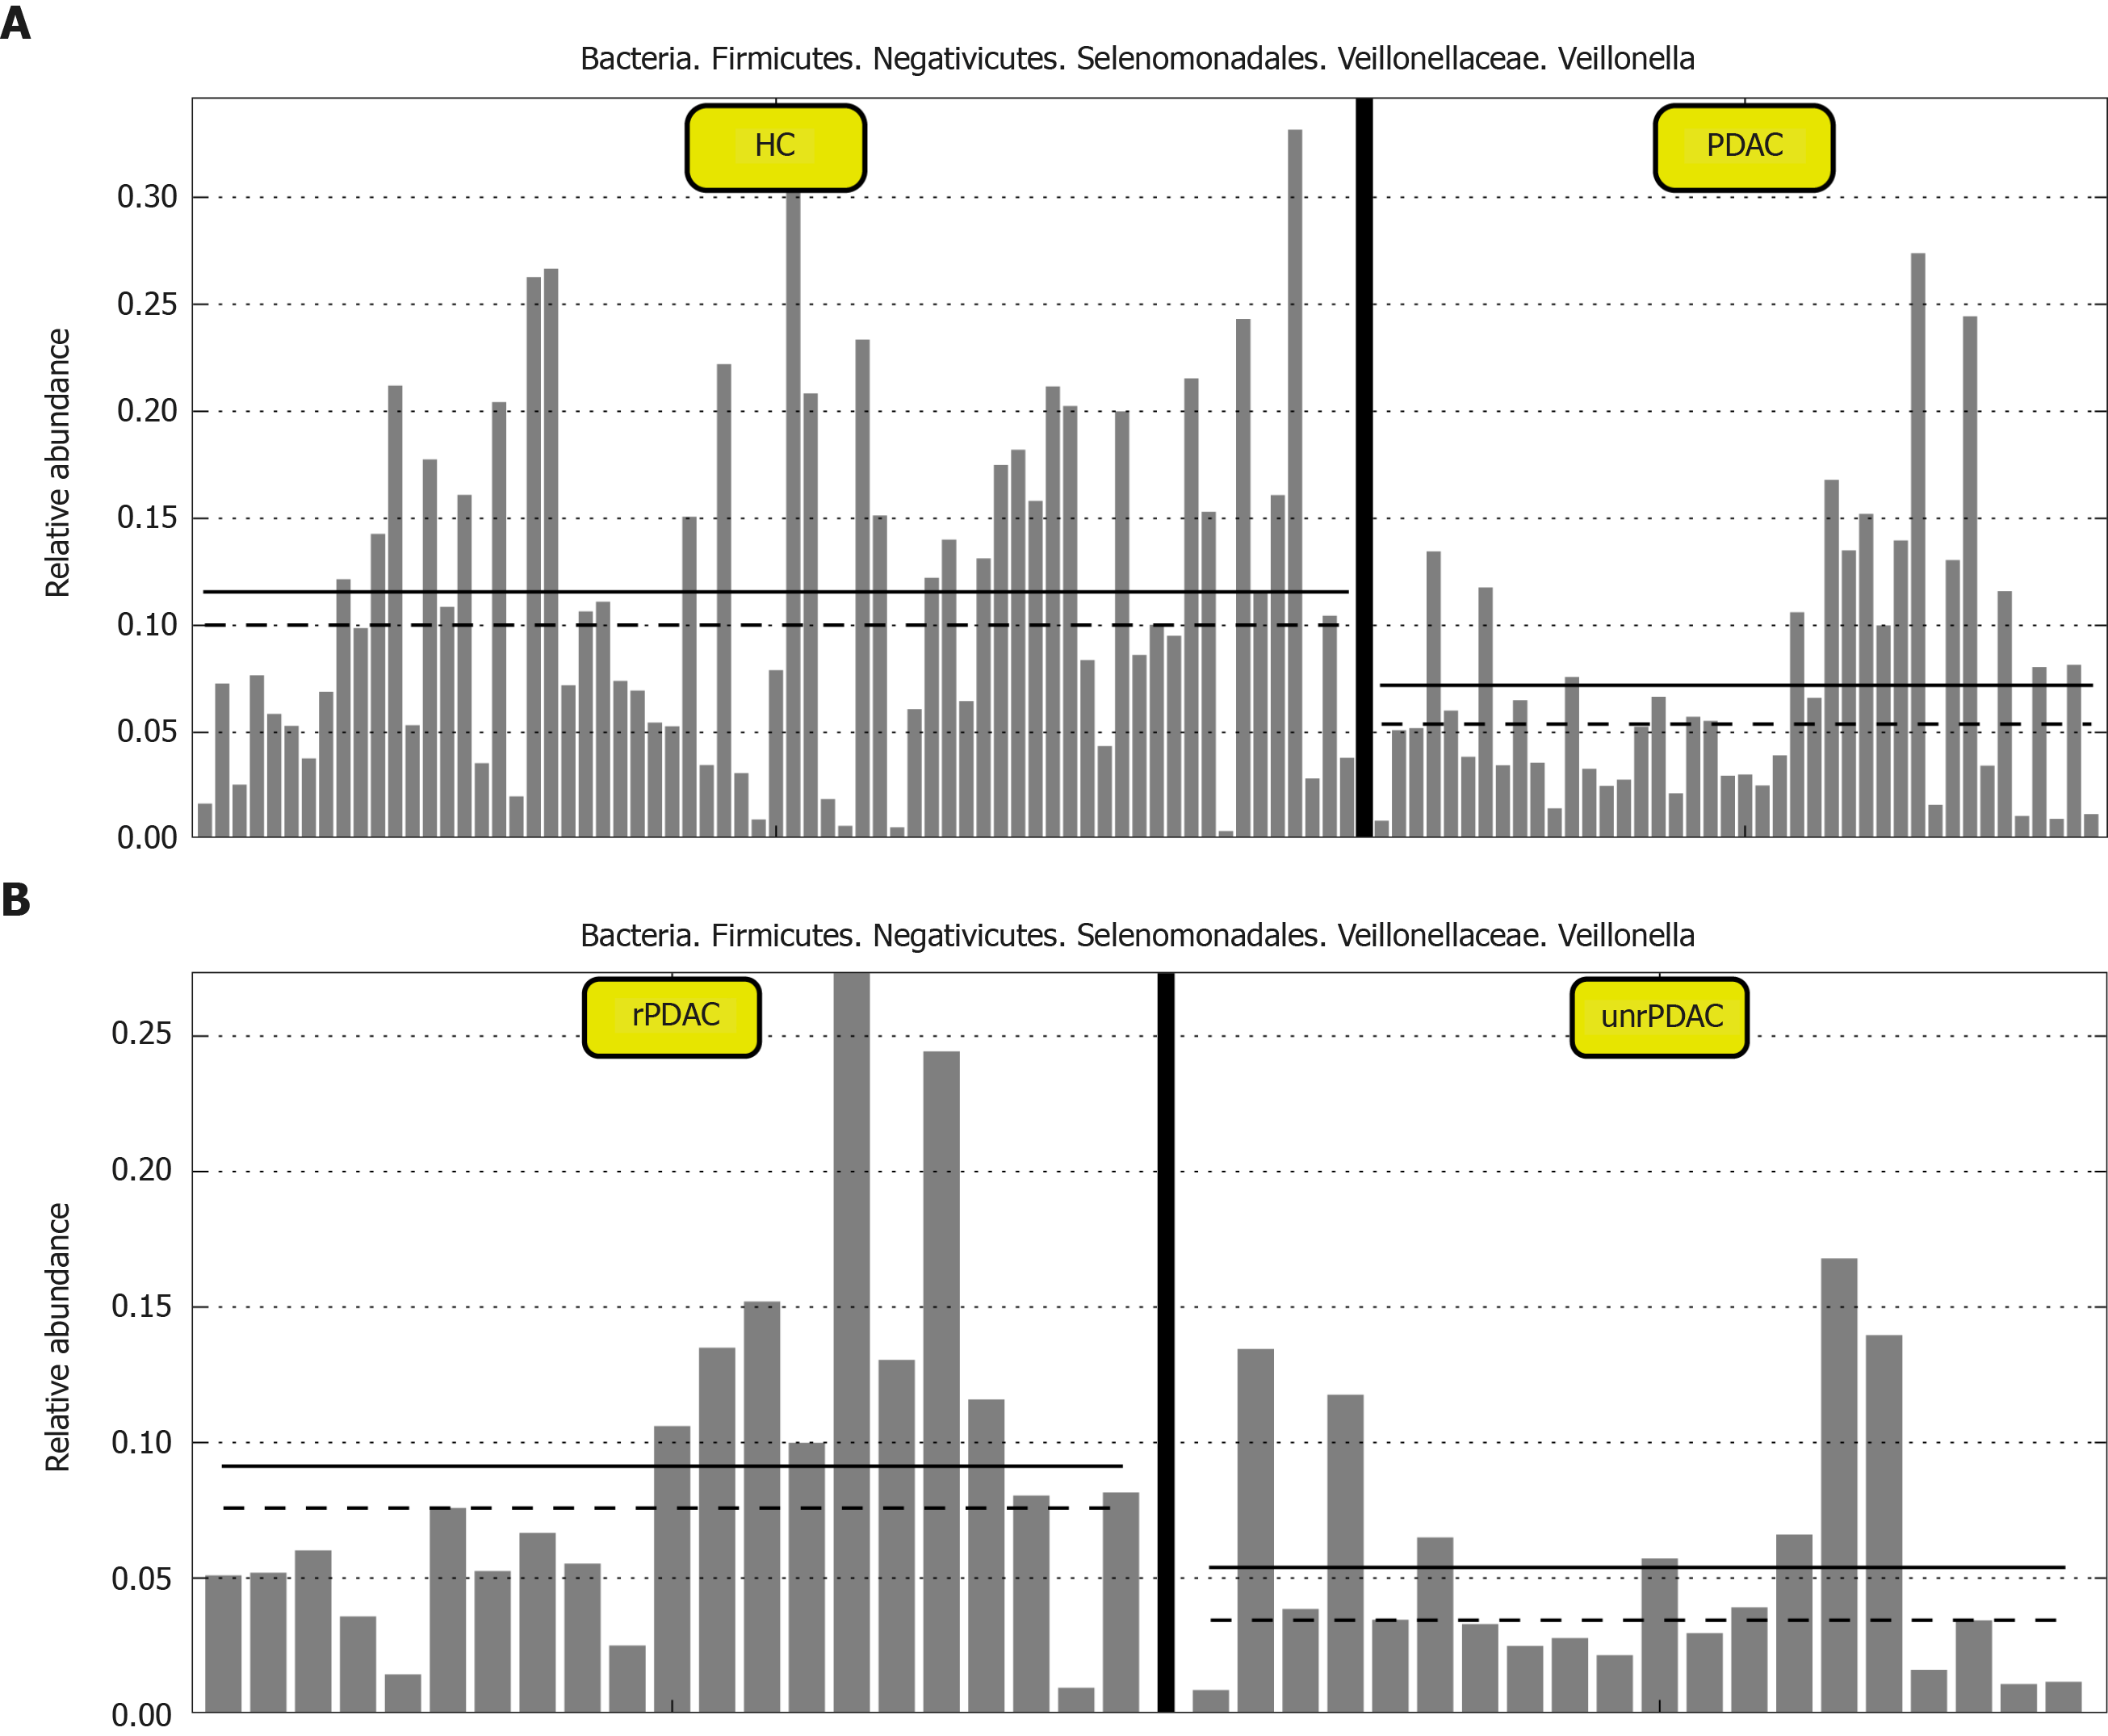
Figure 3 The abundance of Veillonella in different groups.
The relative abundance of Veillonella in pancreatic adenocarcinoma (PDAC) patients is shown by the straight, and dotted lines plot the means and medians of the relative abundance. The abundance of Veillonella showed a gradual decline in saliva samples from healthy people, resectable PDAC (rPDAC), and unresectable PDAC (unrPDAC). HC: Healthy controls.
- Citation: Wei AL, Li M, Li GQ, Wang X, Hu WM, Li ZL, Yuan J, Liu HY, Zhou LL, Li K, Li A, Fu MR. Oral microbiome and pancreatic cancer. World J Gastroenterol 2020; 26(48): 7679-7692
- URL: https://www.wjgnet.com/1007-9327/full/v26/i48/7679.htm
- DOI: https://dx.doi.org/10.3748/wjg.v26.i48.7679


