©The Author(s) 2020.
World J Gastroenterol. Nov 28, 2020; 26(44): 7046-7060
Published online Nov 28, 2020. doi: 10.3748/wjg.v26.i44.7046
Published online Nov 28, 2020. doi: 10.3748/wjg.v26.i44.7046
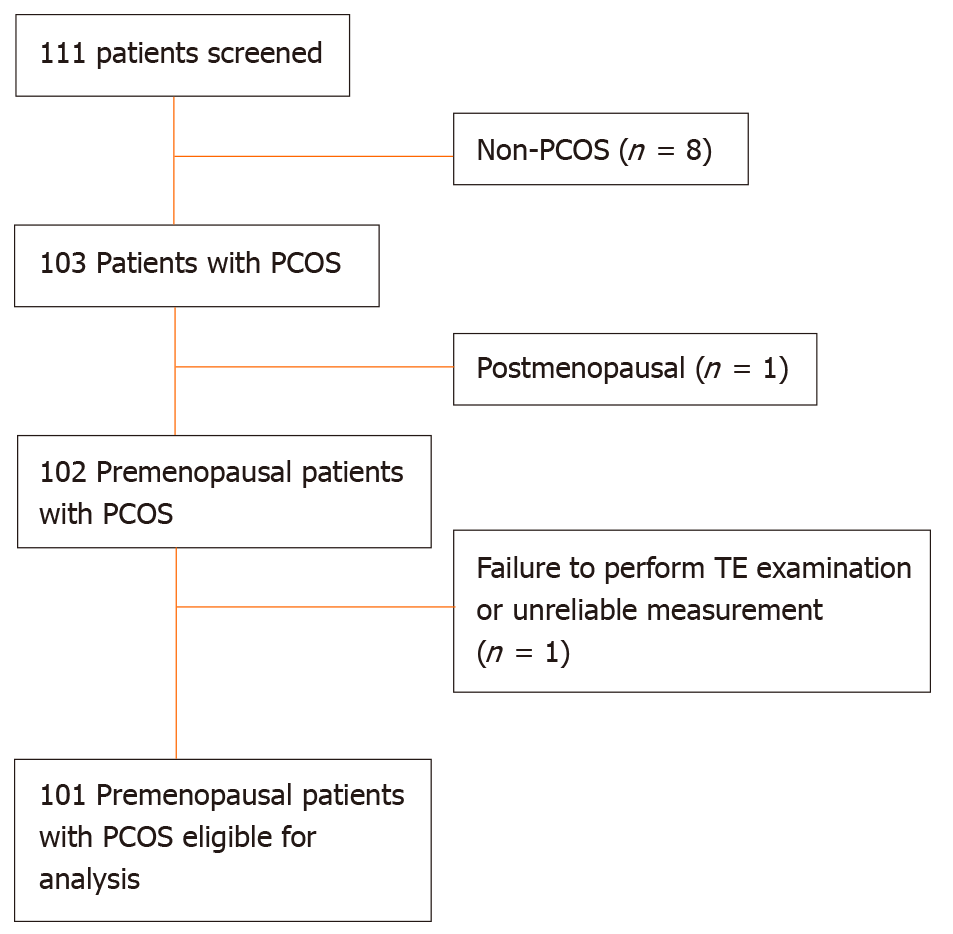
Figure 1 Flow chart displaying the selection of participants in the study cohort.
PCOS: Polycystic ovary syndrome; TE: Transient elastography.
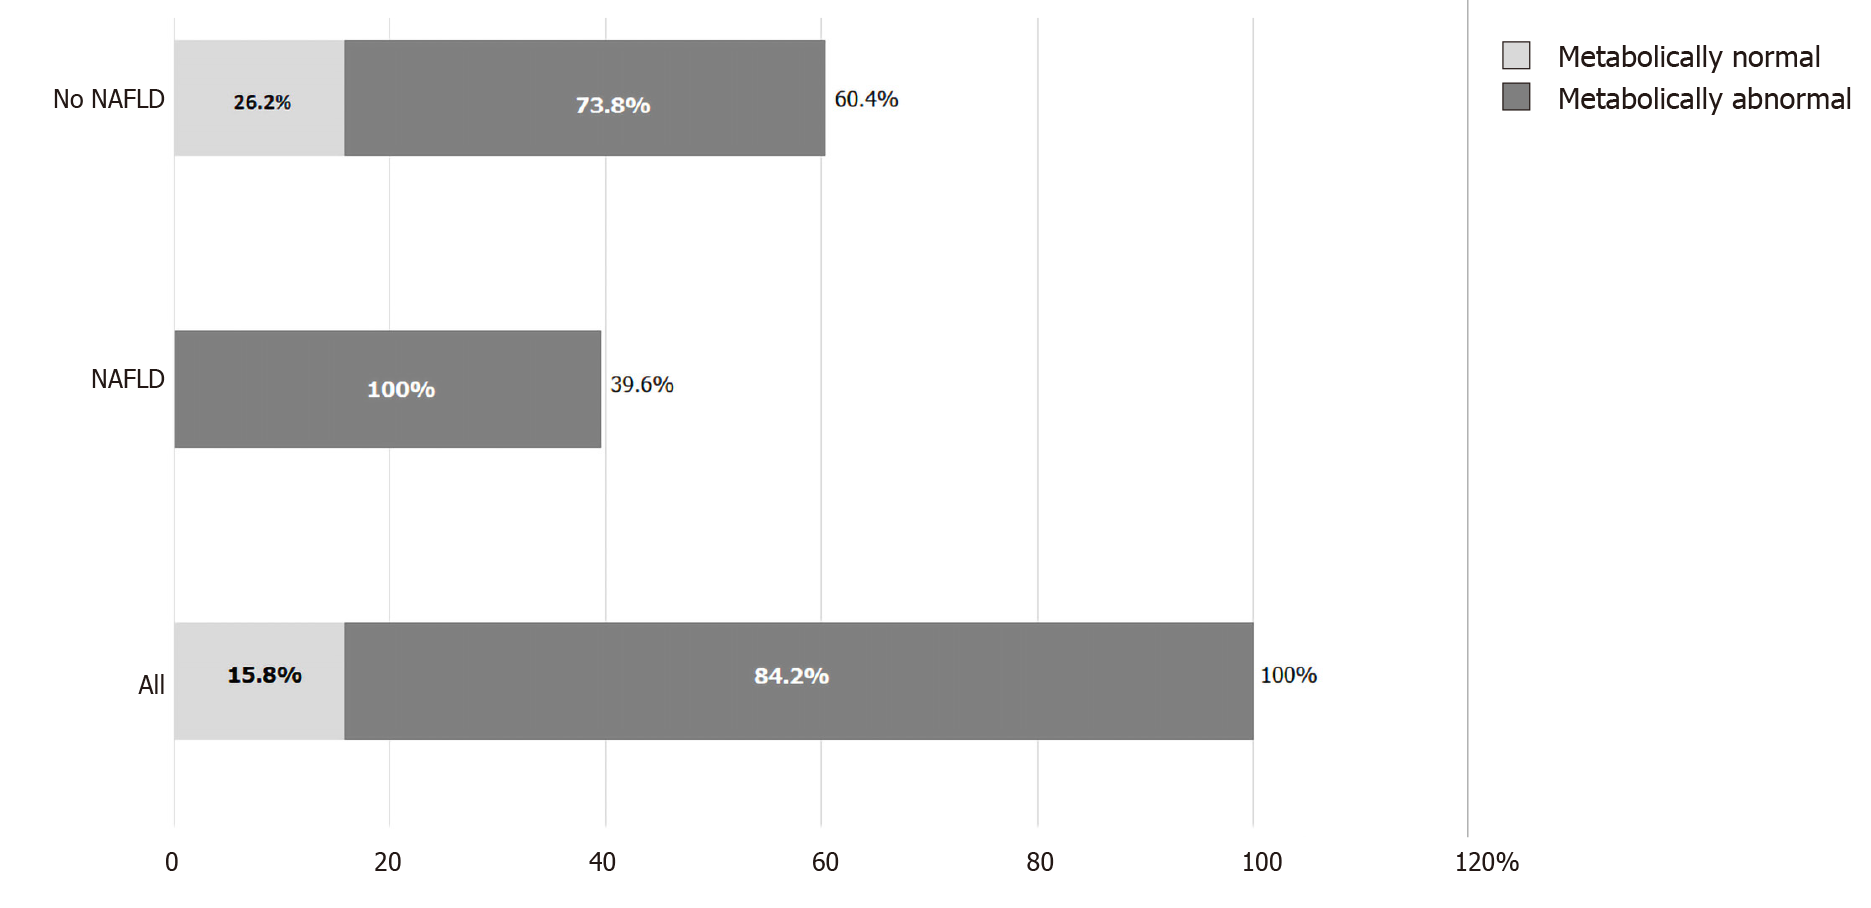
Figure 2 Distribution of metabolically normal and abnormal patients by nonalcoholic fatty liver disease category.
NAFLD: Nonalcoholic fatty liver disease.
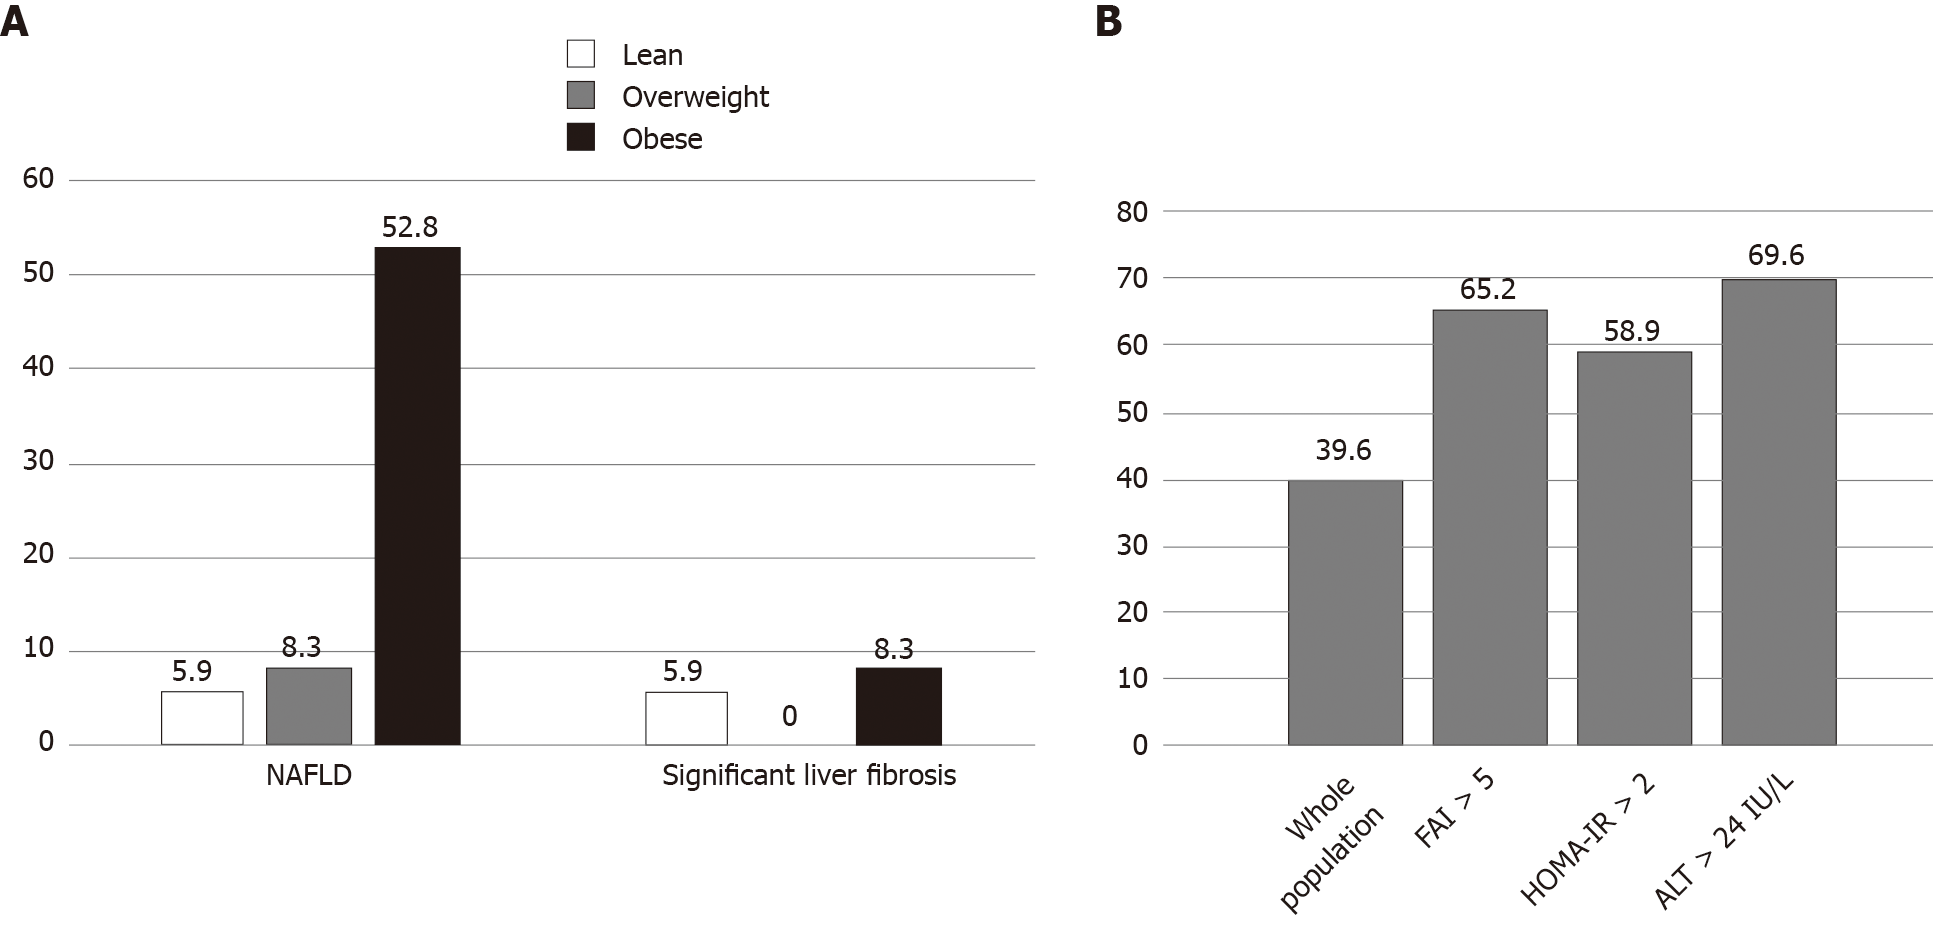
Figure 3 Prevalence of nonalcoholic fatty liver disease and significant liver fibrosis.
A: Prevalence of nonalcoholic fatty liver disease (NAFLD), severe NAFLD and significant liver fibrosis according to body mass index category; and B: Prevalence of NAFLD according to patients’ characteristics. NAFLD: Nonalcoholic fatty liver disease; ALT: Alanine aminotransferase; HOMA-IR: Homeostasis model for assessment of insulin resistance.
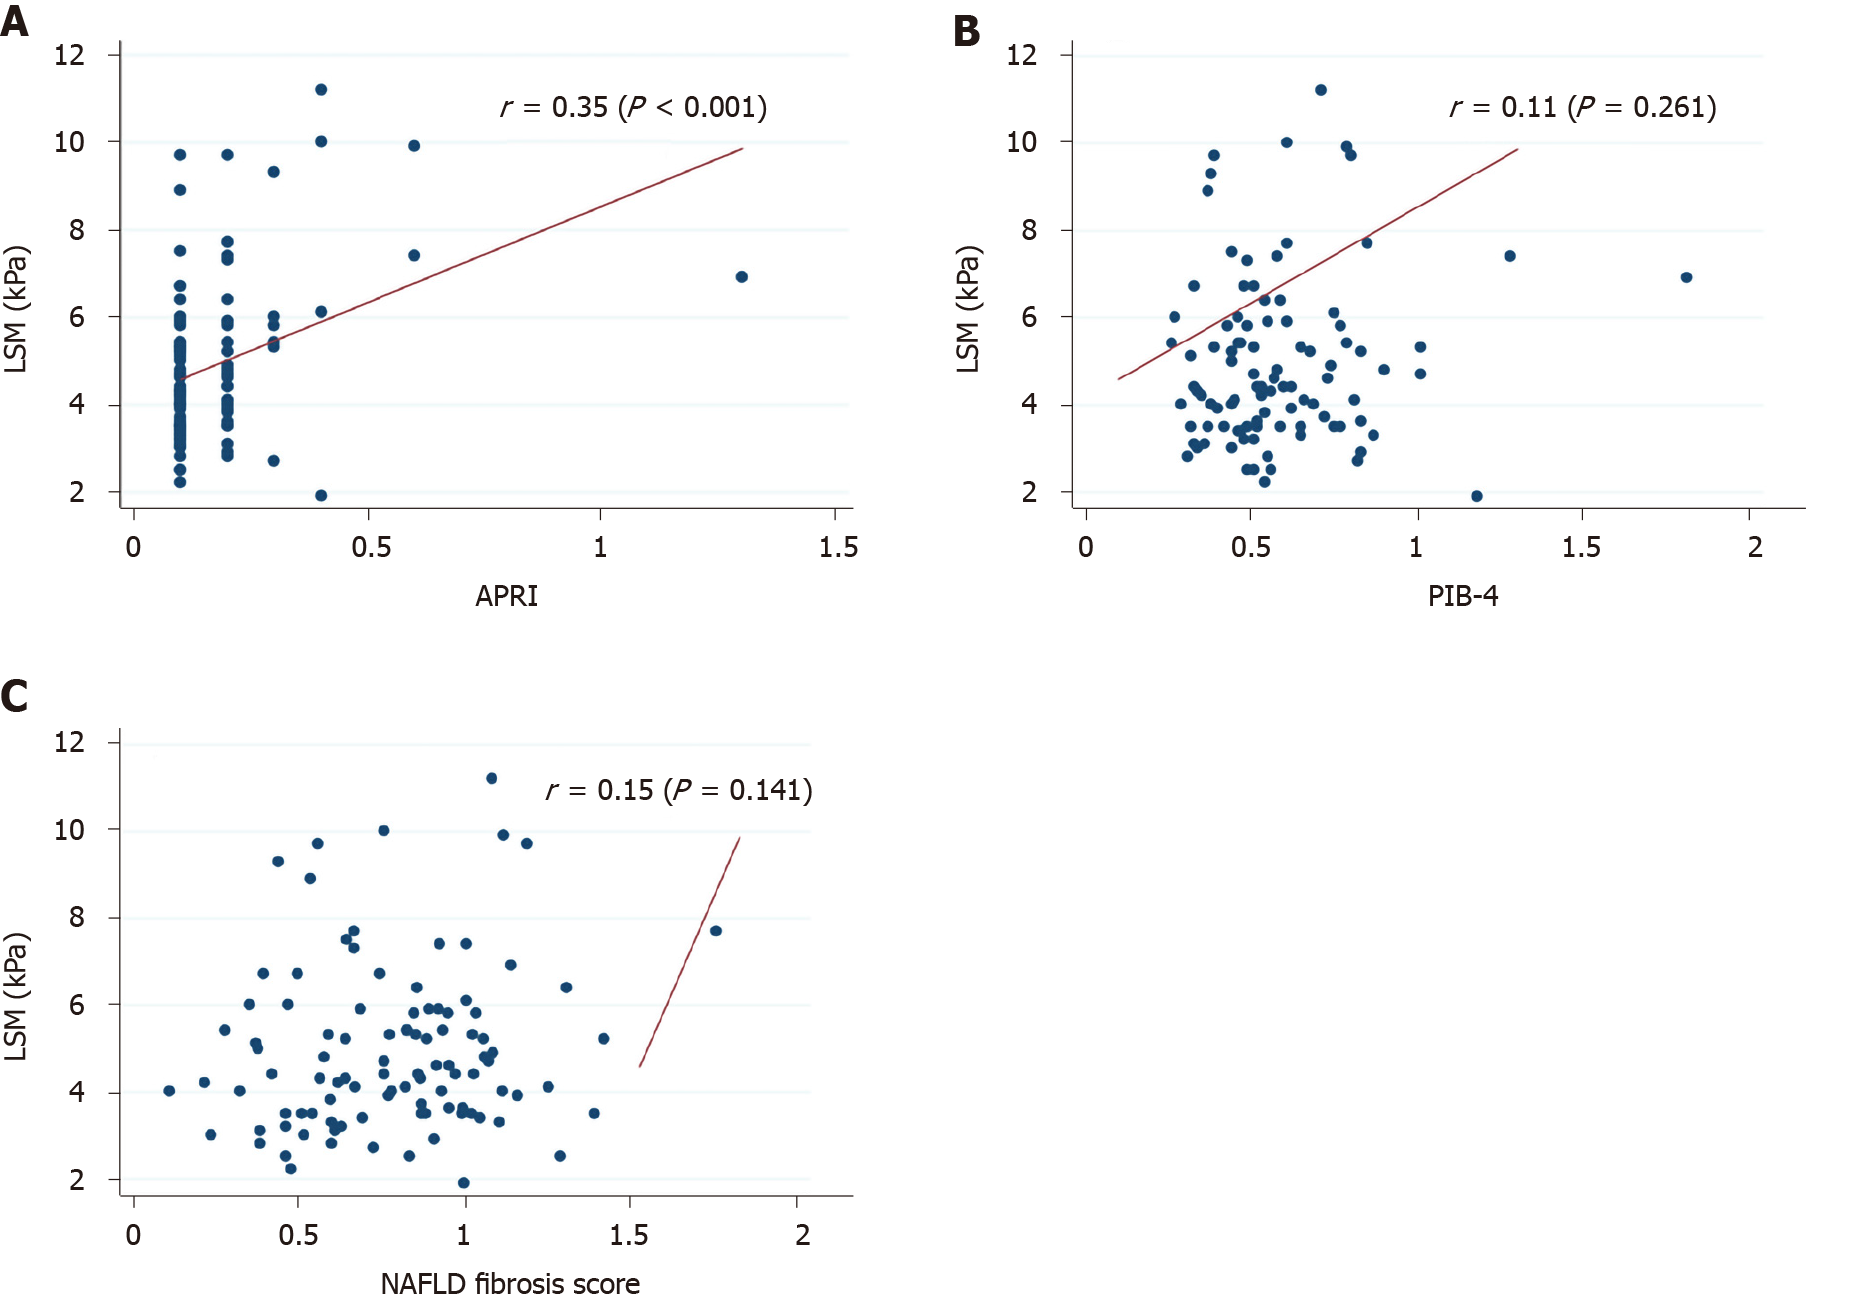
Figure 4 Scatterplot depicting the correlation between liver stiffness measurement.
A: Aspartate aminotransferase-to-Platelets Ratio Index; B: Fibrosis-4; and C: Nonalcoholic fatty liver disease fibrosis score. NAFLD: Nonalcoholic fatty liver disease; APRI: aspartate aminotransferase-to-Platelets Ratio Index; FIB-4: Fibrosis-4.
Figure 5 Area under the curve of body mass index, free androgen index and alanine aminotransferase for prediction of nonalcoholic fatty liver disease.
BMI: Body mass index; ALT: Alanine aminotransferase; AUC: Area under the curve; FAI: Free androgen index.
- Citation: Shengir M, Krishnamurthy S, Ghali P, Deschenes M, Wong P, Chen T, Sebastiani G. Prevalence and predictors of nonalcoholic fatty liver disease in South Asian women with polycystic ovary syndrome. World J Gastroenterol 2020; 26(44): 7046-7060
- URL: https://www.wjgnet.com/1007-9327/full/v26/i44/7046.htm
- DOI: https://dx.doi.org/10.3748/wjg.v26.i44.7046


