Copyright
©The Author(s) 2020.
World J Gastroenterol. Oct 21, 2020; 26(39): 6074-6086
Published online Oct 21, 2020. doi: 10.3748/wjg.v26.i39.6074
Published online Oct 21, 2020. doi: 10.3748/wjg.v26.i39.6074
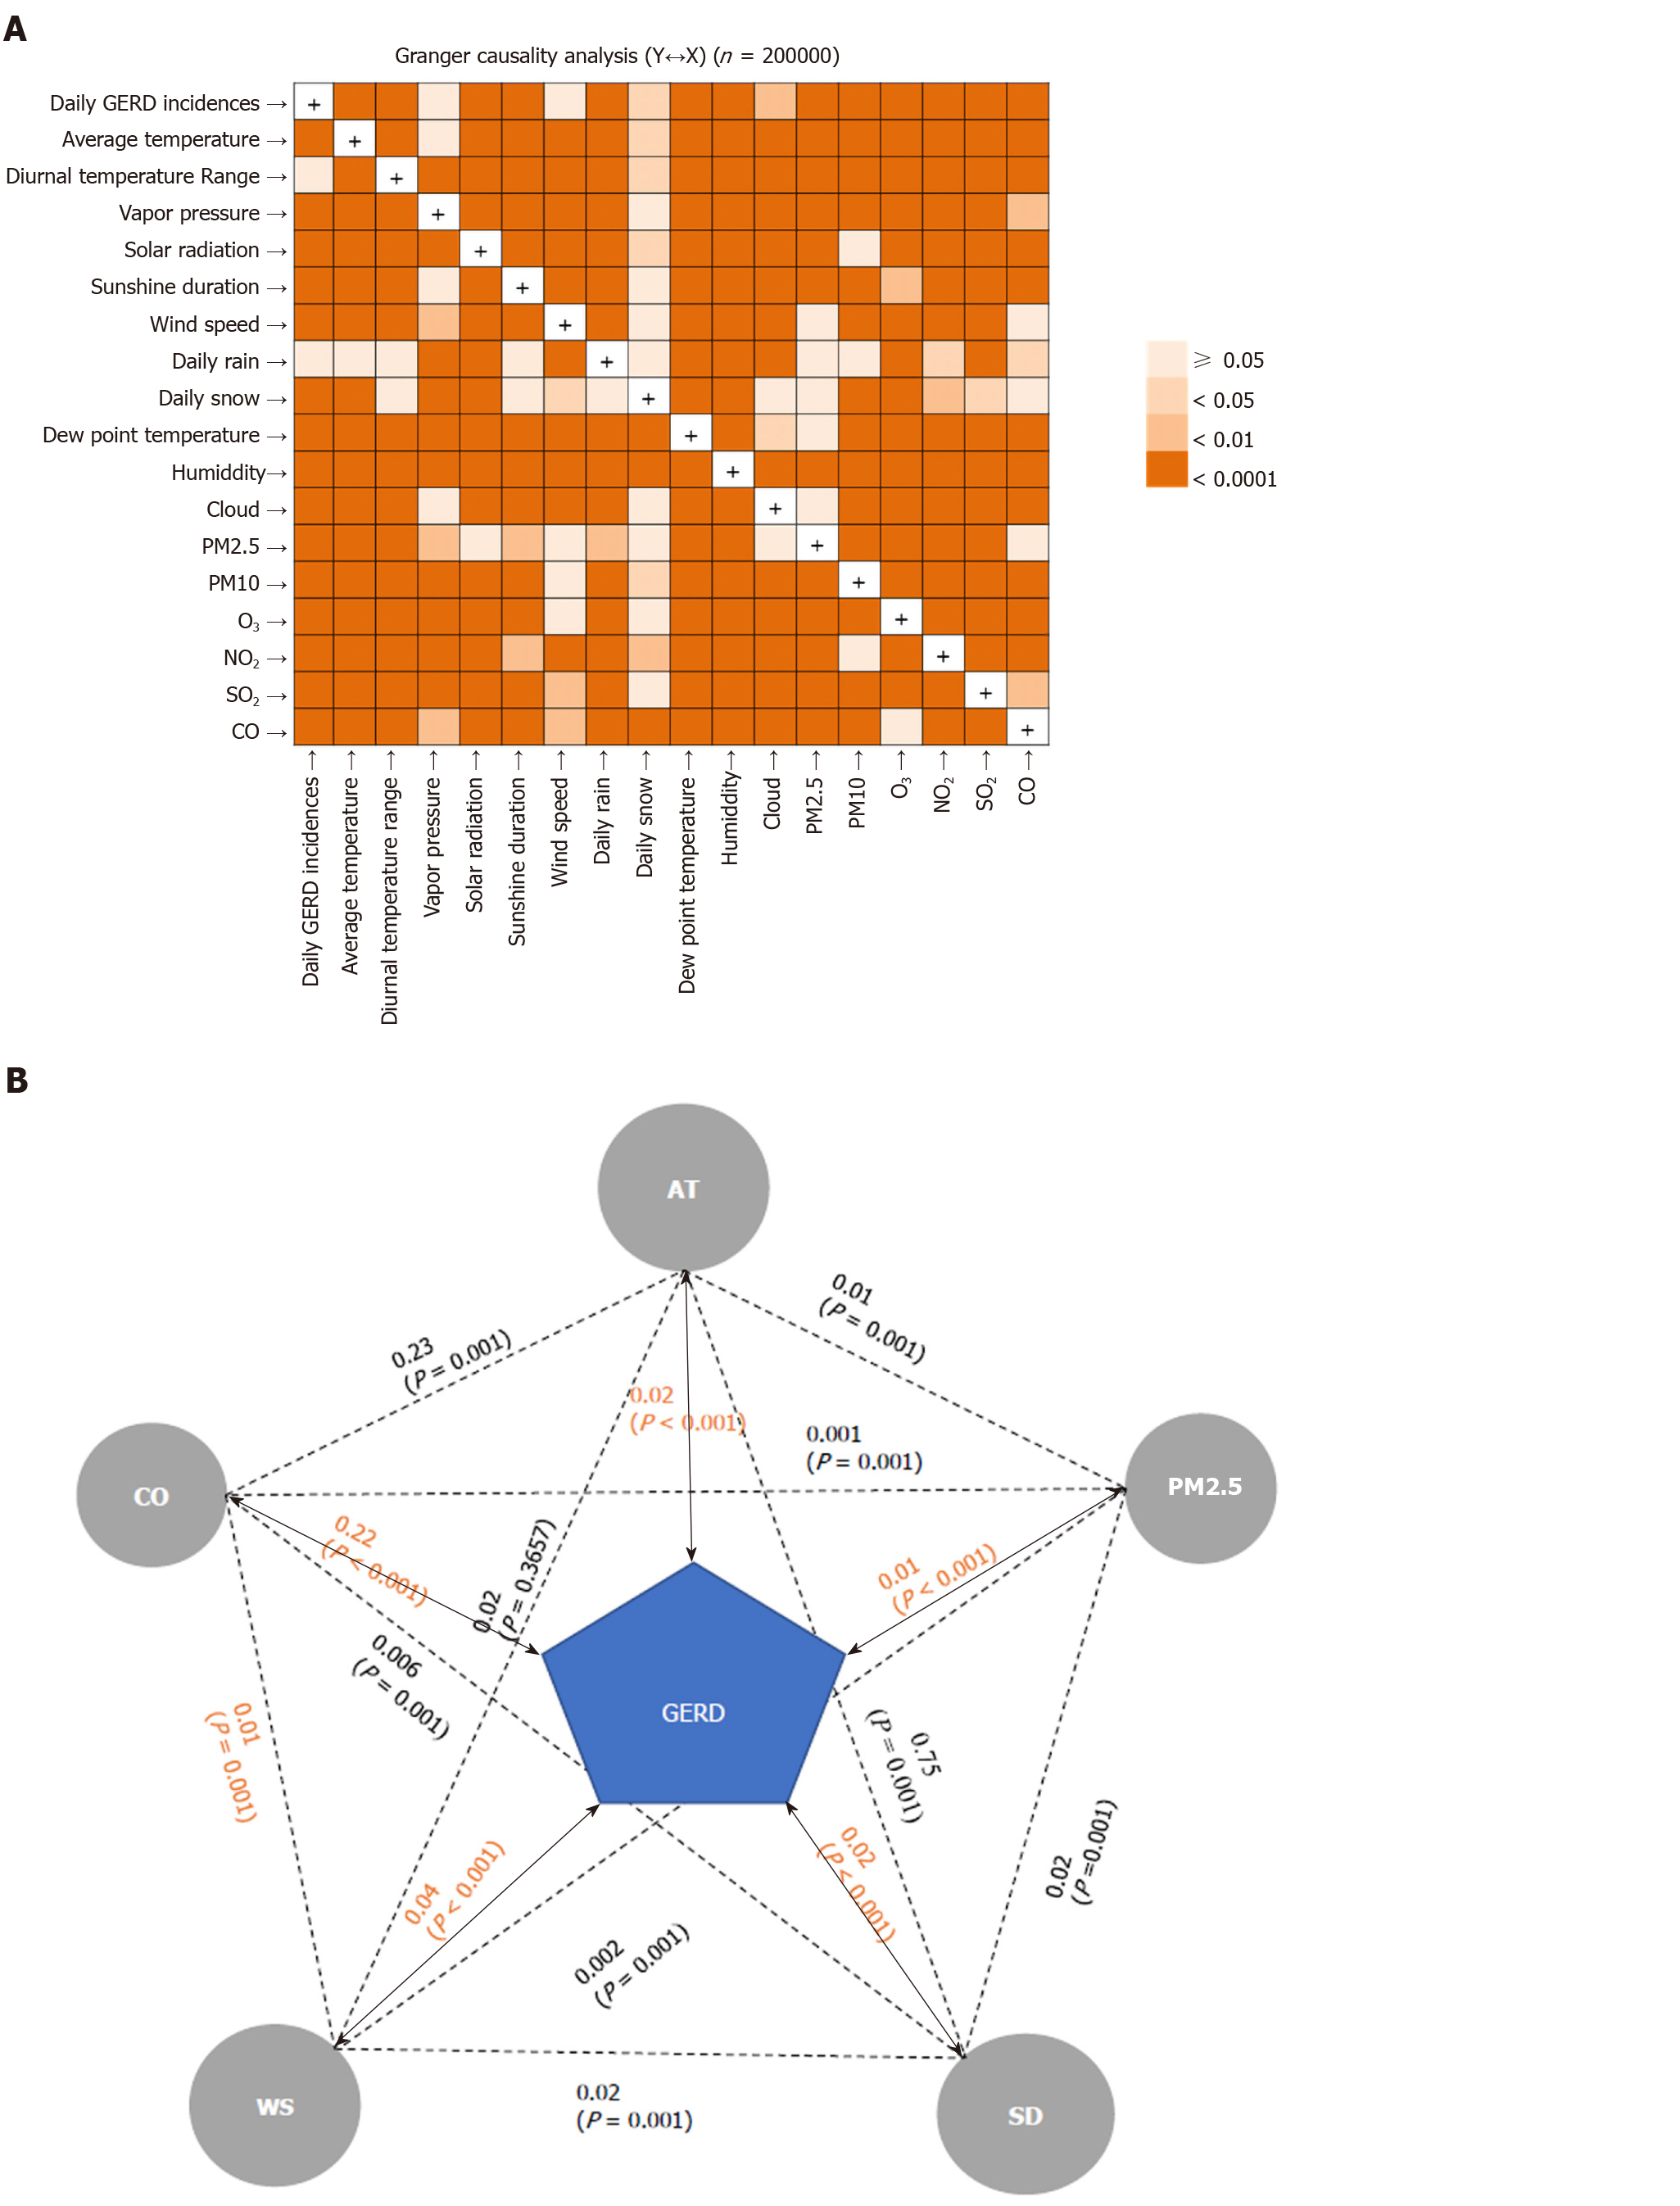
Figure 1 Granger causality test of the relationship between meteorological factors and air pollutants and GERD-related medical utilization.
A: Various meteorological factors and air pollutants (MFAPs) show a direct or indirect association with GERD-related medical utilization; B: Relationship between the five selected MFAPs and GERD-related medical utilization. All variables were significantly correlated except AT and WS. The five selected MFAPs were significantly correlated to GERD-related medical utilization. MFAPs: Meteorological factors and air pollutants; GERD: Gastroesophageal reflux disease; WS: Wind speed; SD: Sunshine duration; AT: Average temperature; CO: Carbon monoxide; PM2.5: Particulate matter with a diameter ≤ 2.5 µm.
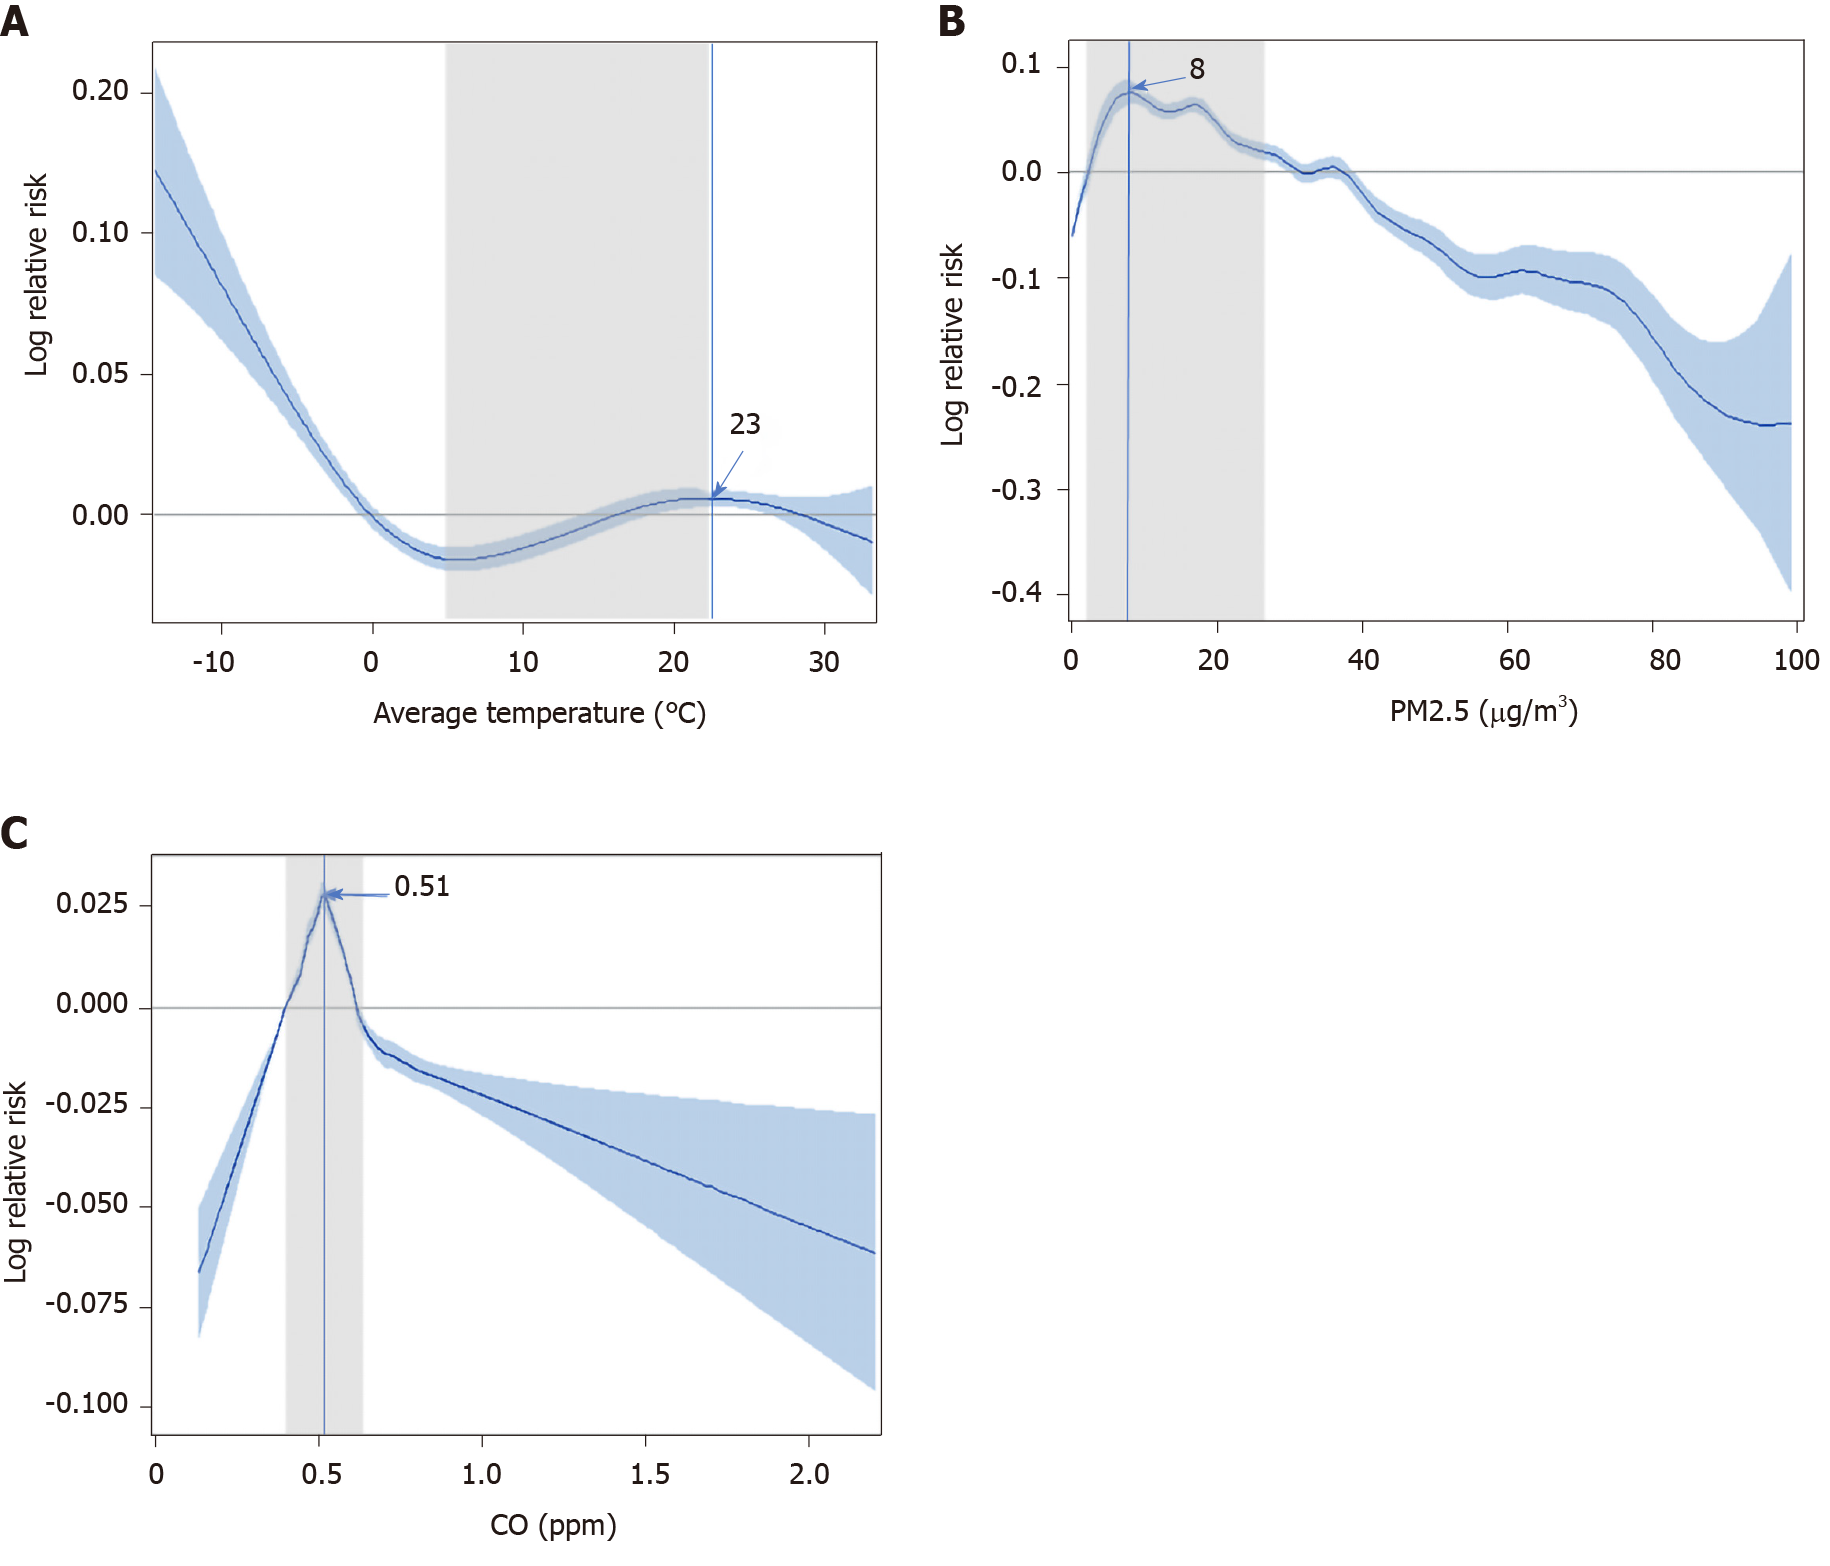
Figure 2 Prediction model of gastroesophageal reflux disease -related medical utilization using a univariate generalized additive Poisson regression model.
A: Gastroesophageal reflux disease (GERD)-related medical utilizations with AT; B: GERD-related medical utilizations as with particulate matter with a diameter ≤ 2.5 µm levels ≤ 40 μg/m3; C: GERD-related medical utilizations in the range of the IQR for carbon monoxide. CO: Carbon monoxide; PM2.5: Particulate matter with a diameter ≤ 2.5 µm; ppm: Parts-per-million.
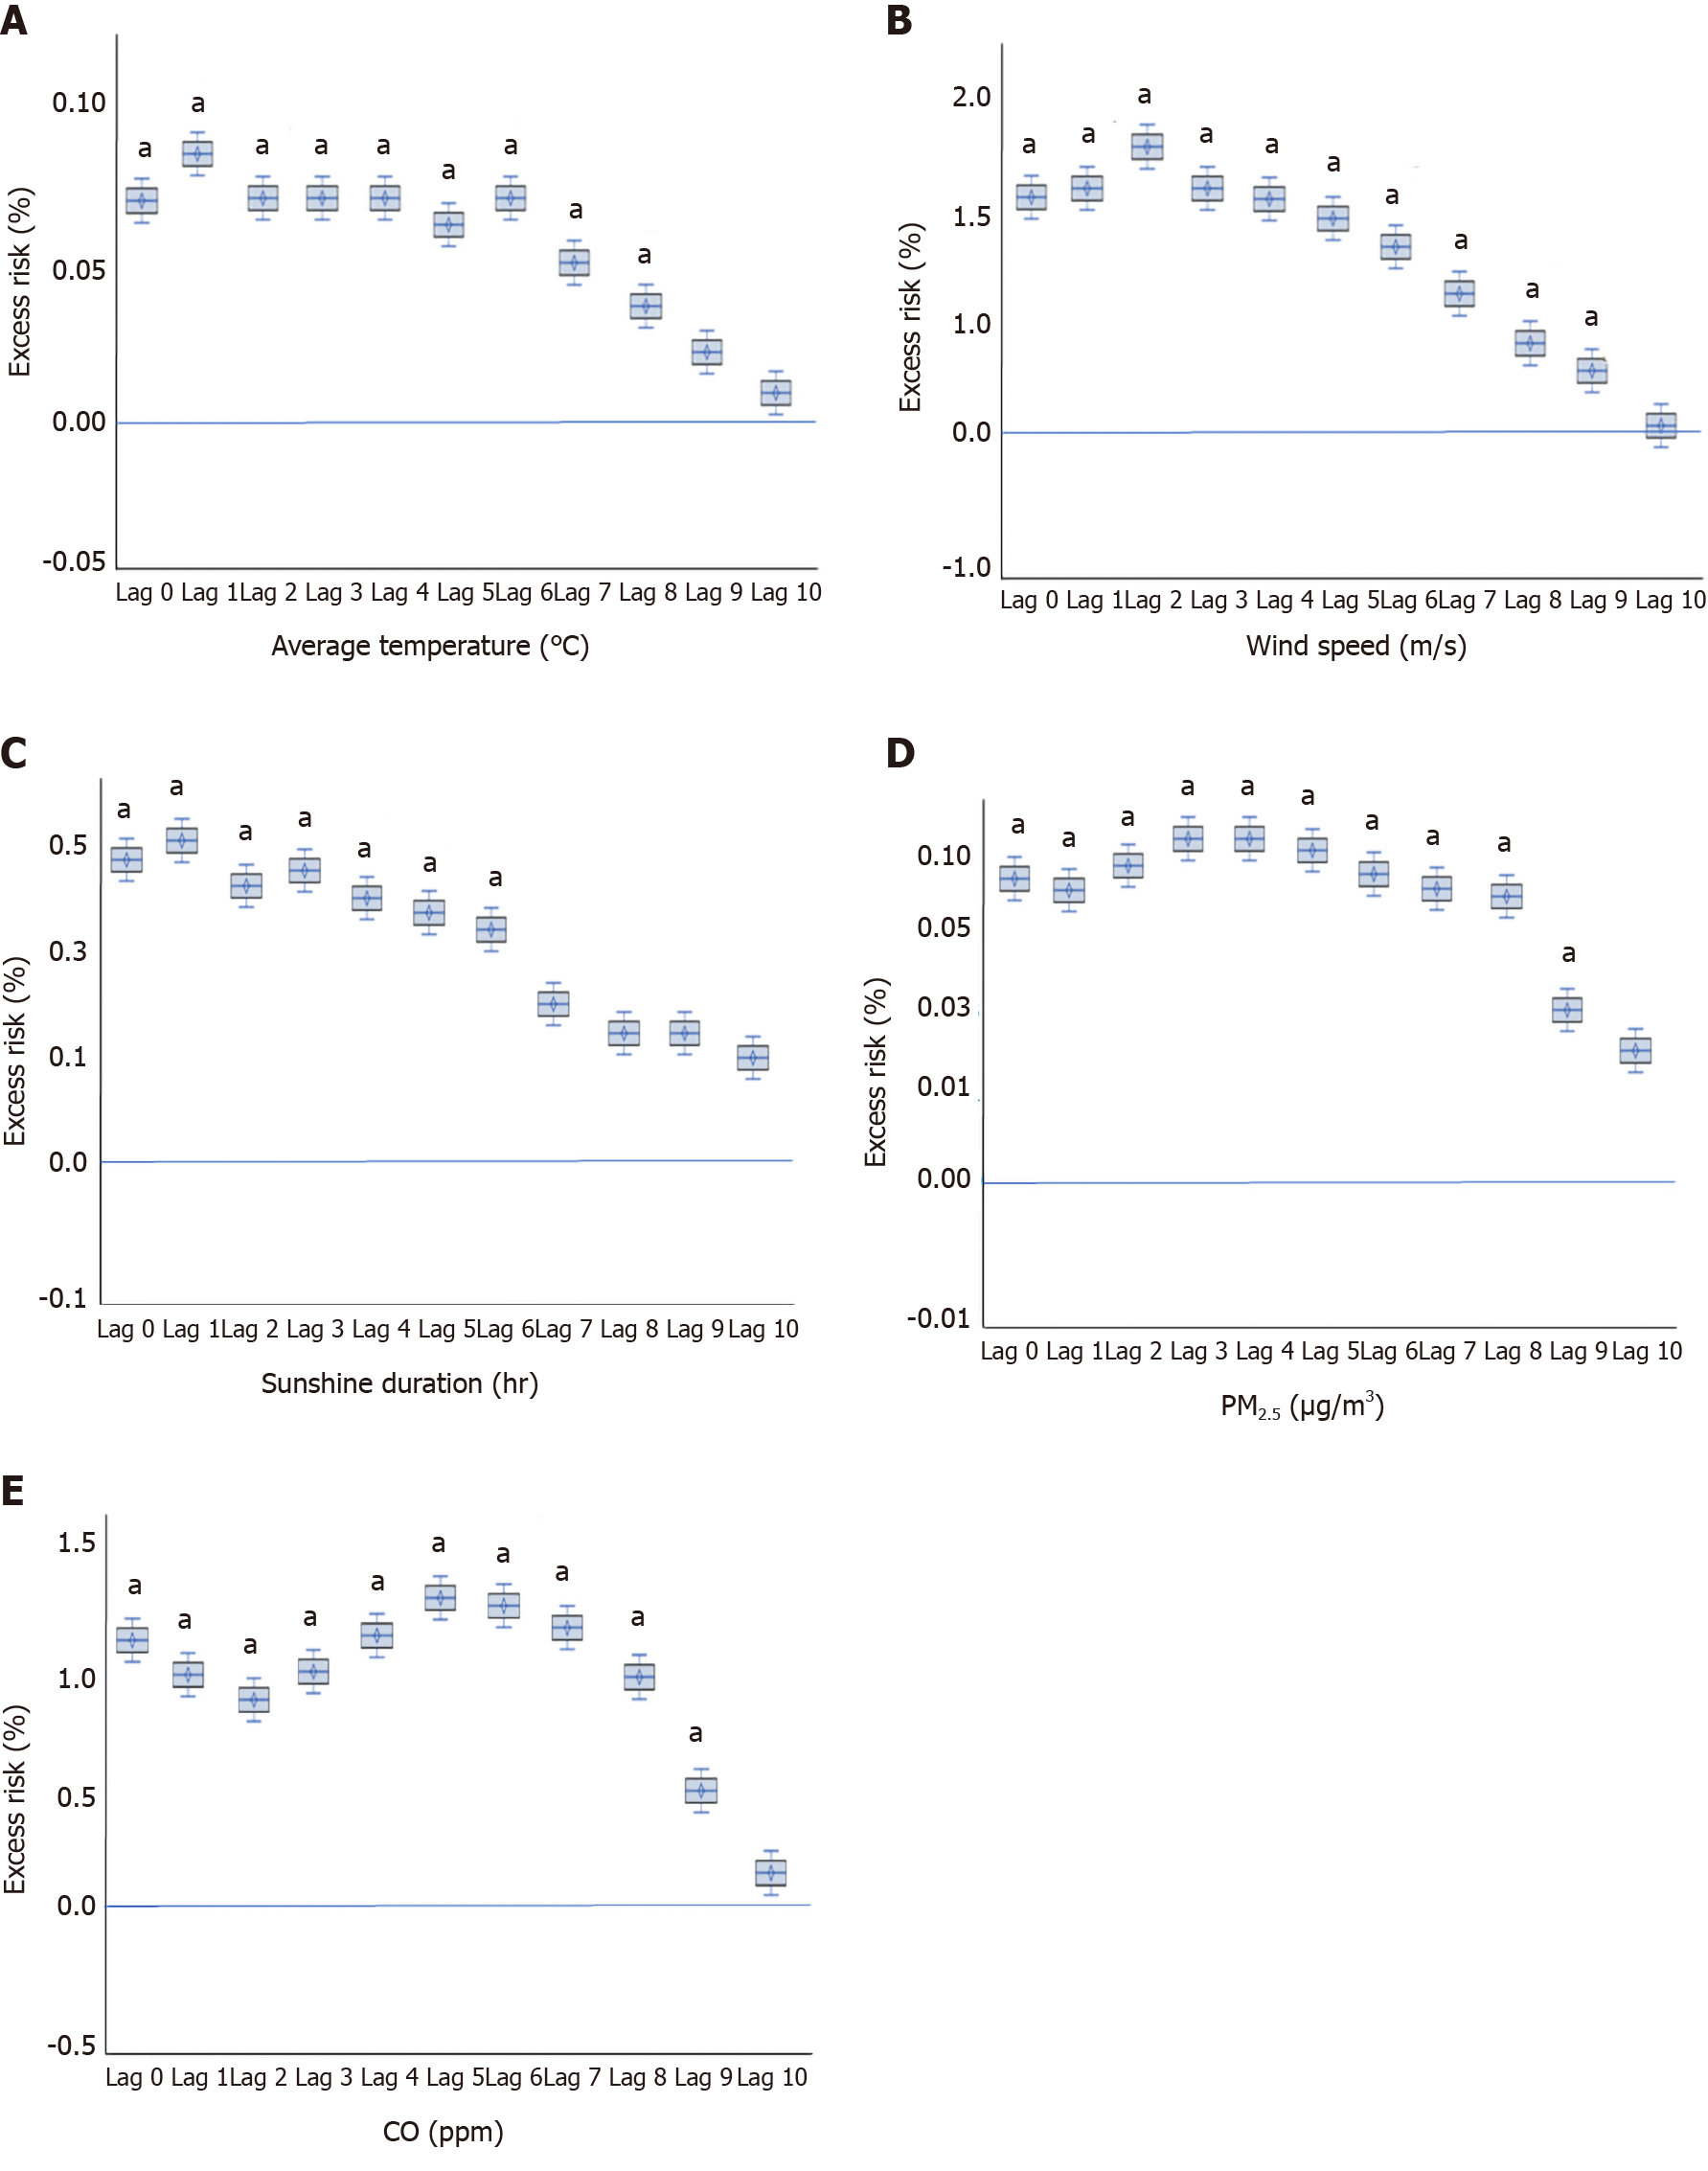
Figure 3 Time lag for exposure in multivariate analyses.
A: Excess risk was significant after exposure up until 8 d for average temperature; B: Excess risk was significant after exposure up until 9 d for wind speed; C: Excess risk was significant after exposure up until 6 d for sunshine duration; D: Excess risk was significant after exposure up until 9 d for particulate matter with a diameter ≤ 2.5 µm; E: Excess risk was significant after exposure up until 9 d for carbon monoxide. aP < 0.05. CO: Carbon monoxide; PM2.5: Particulate matter with a diameter ≤ 2.5 µm; ppm: Parts-per-million.
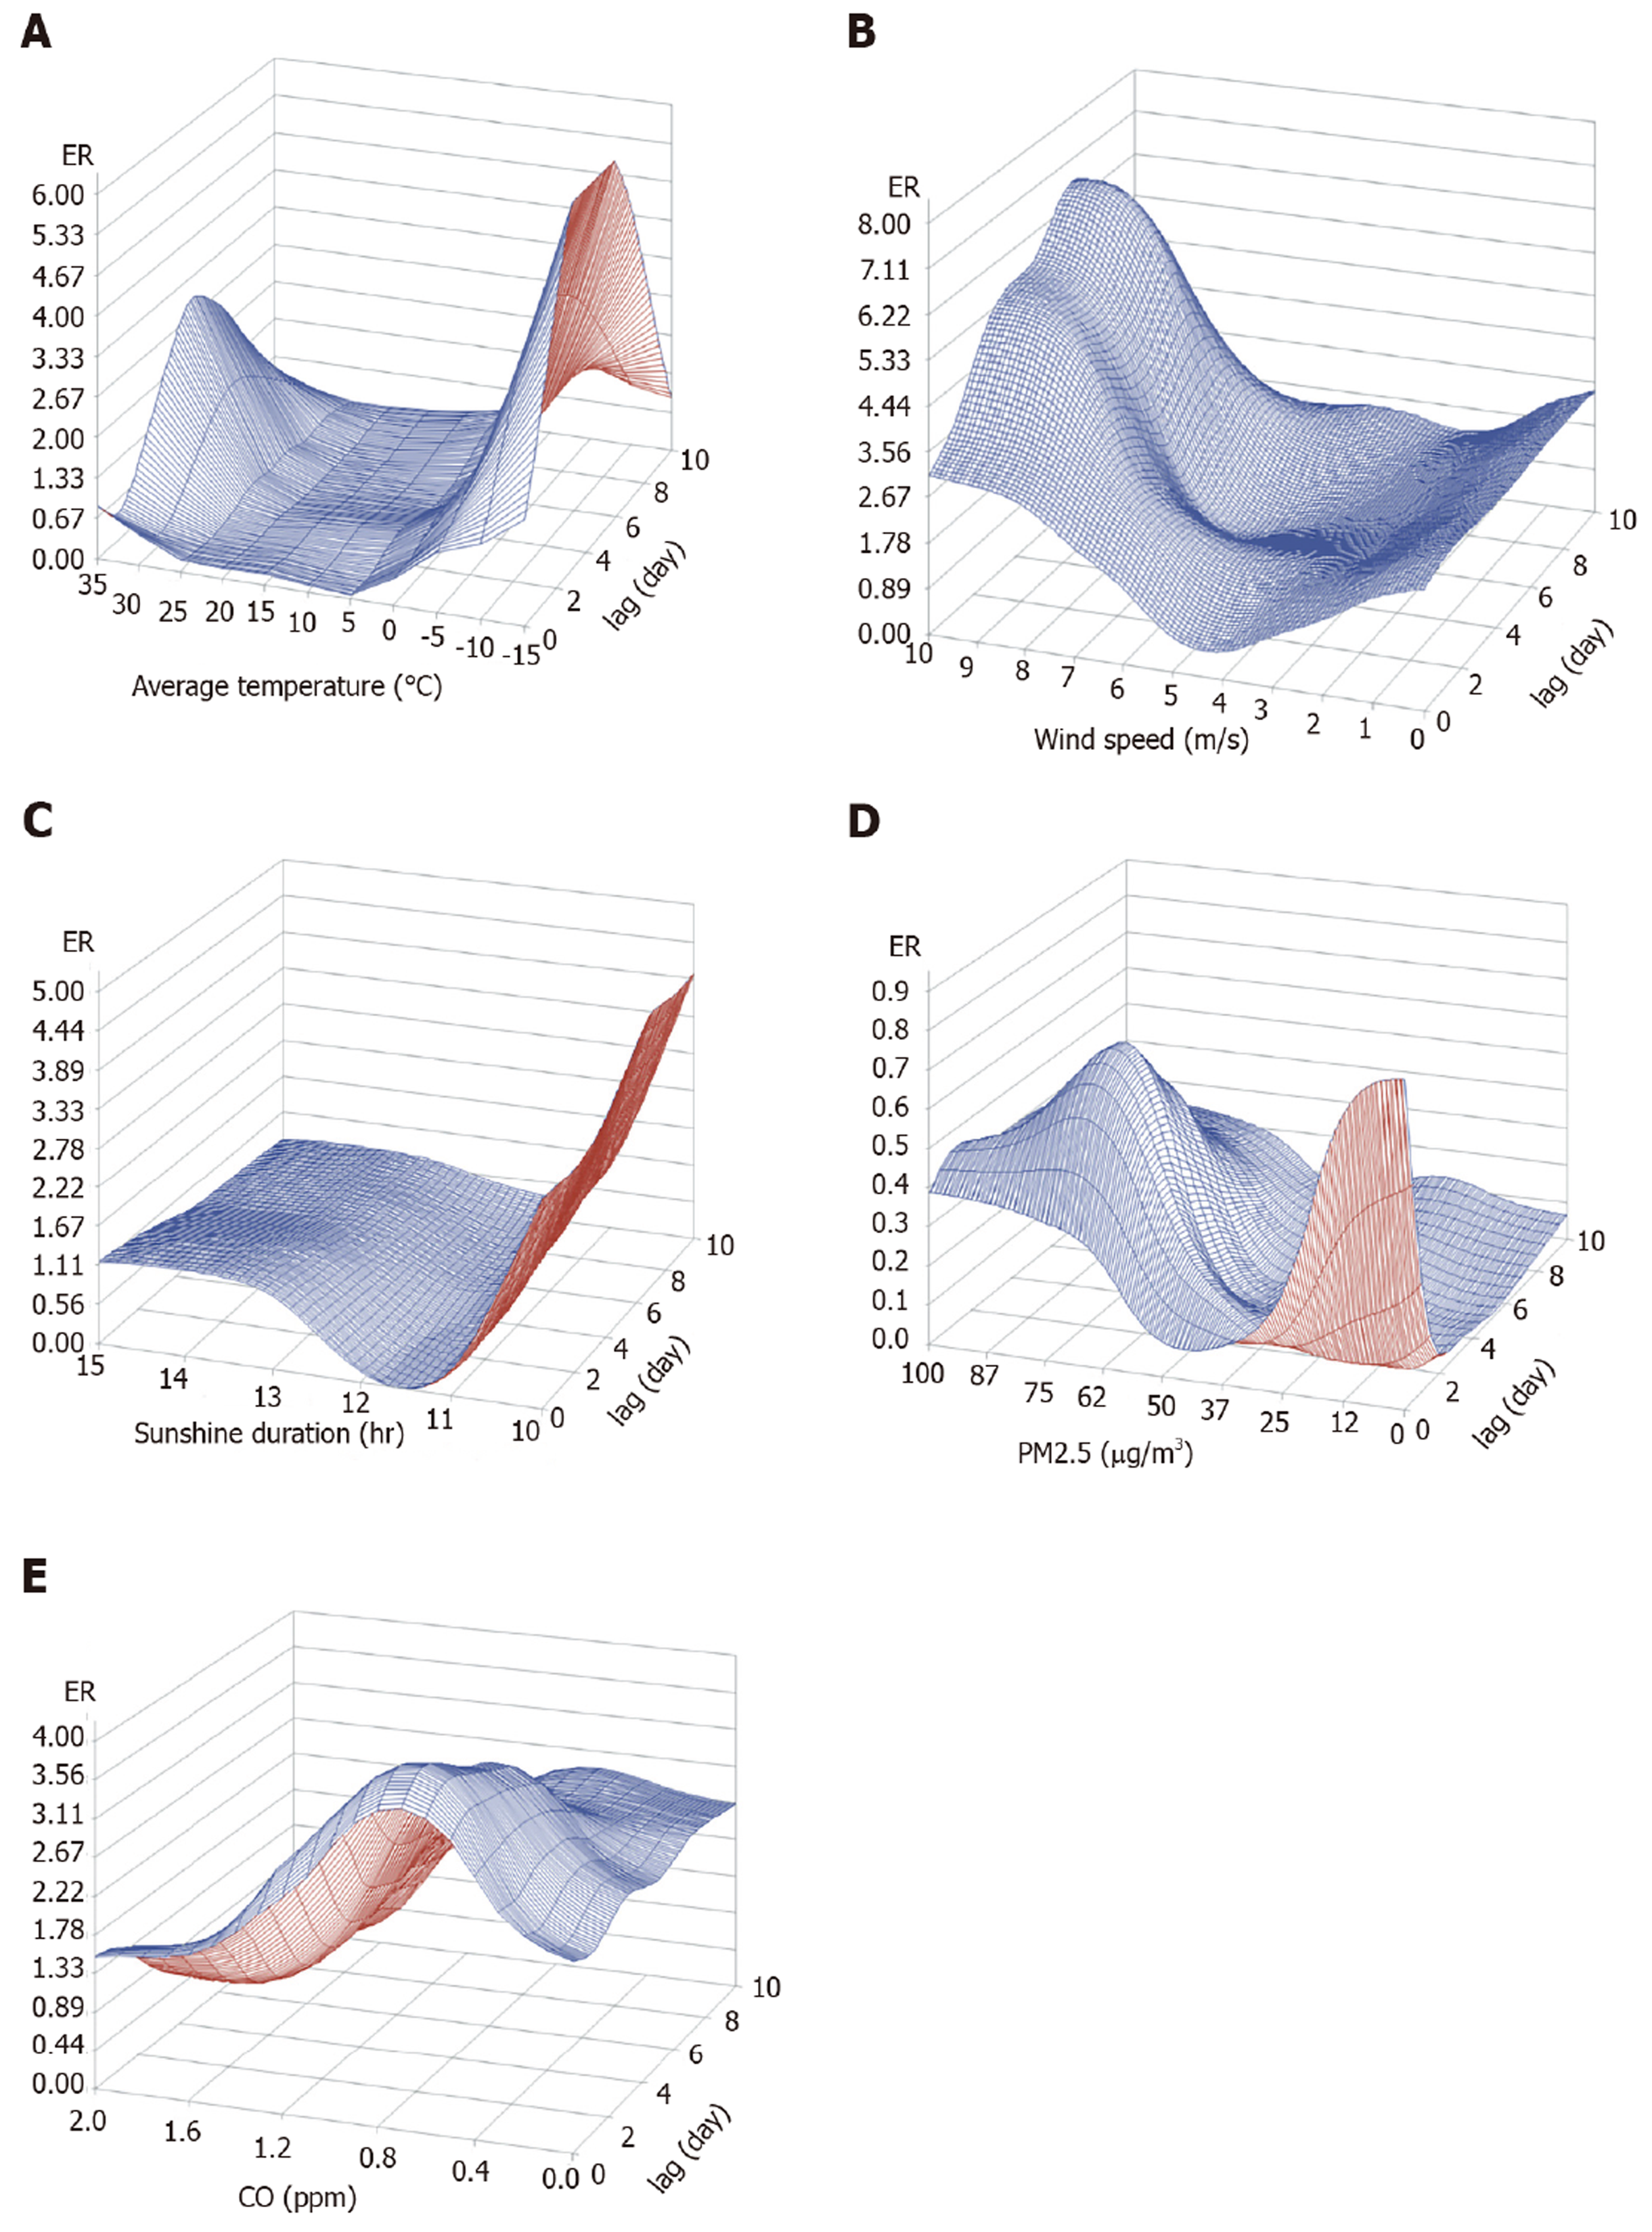
Figure 4 Three-dimensional graph of the prediction model.
Each graph shows excess risk according to factor and time lag. A: Average temperature; B: Wind speed; C: Sunshine duration; D: Particulate matter with a diameter ≤ 2.5 µm; E: Carbon monoxide. CO: Carbon monoxide; PM2.5: Particulate matter with a diameter ≤ 2.5 µm; ppm: Parts-per-million.
- Citation: Seo HS, Hong J, Jung J. Relationship of meteorological factors and air pollutants with medical care utilization for gastroesophageal reflux disease in urban area. World J Gastroenterol 2020; 26(39): 6074-6086
- URL: https://www.wjgnet.com/1007-9327/full/v26/i39/6074.htm
- DOI: https://dx.doi.org/10.3748/wjg.v26.i39.6074


