Copyright
©The Author(s) 2020.
World J Gastroenterol. Aug 21, 2020; 26(31): 4607-4623
Published online Aug 21, 2020. doi: 10.3748/wjg.v26.i31.4607
Published online Aug 21, 2020. doi: 10.3748/wjg.v26.i31.4607
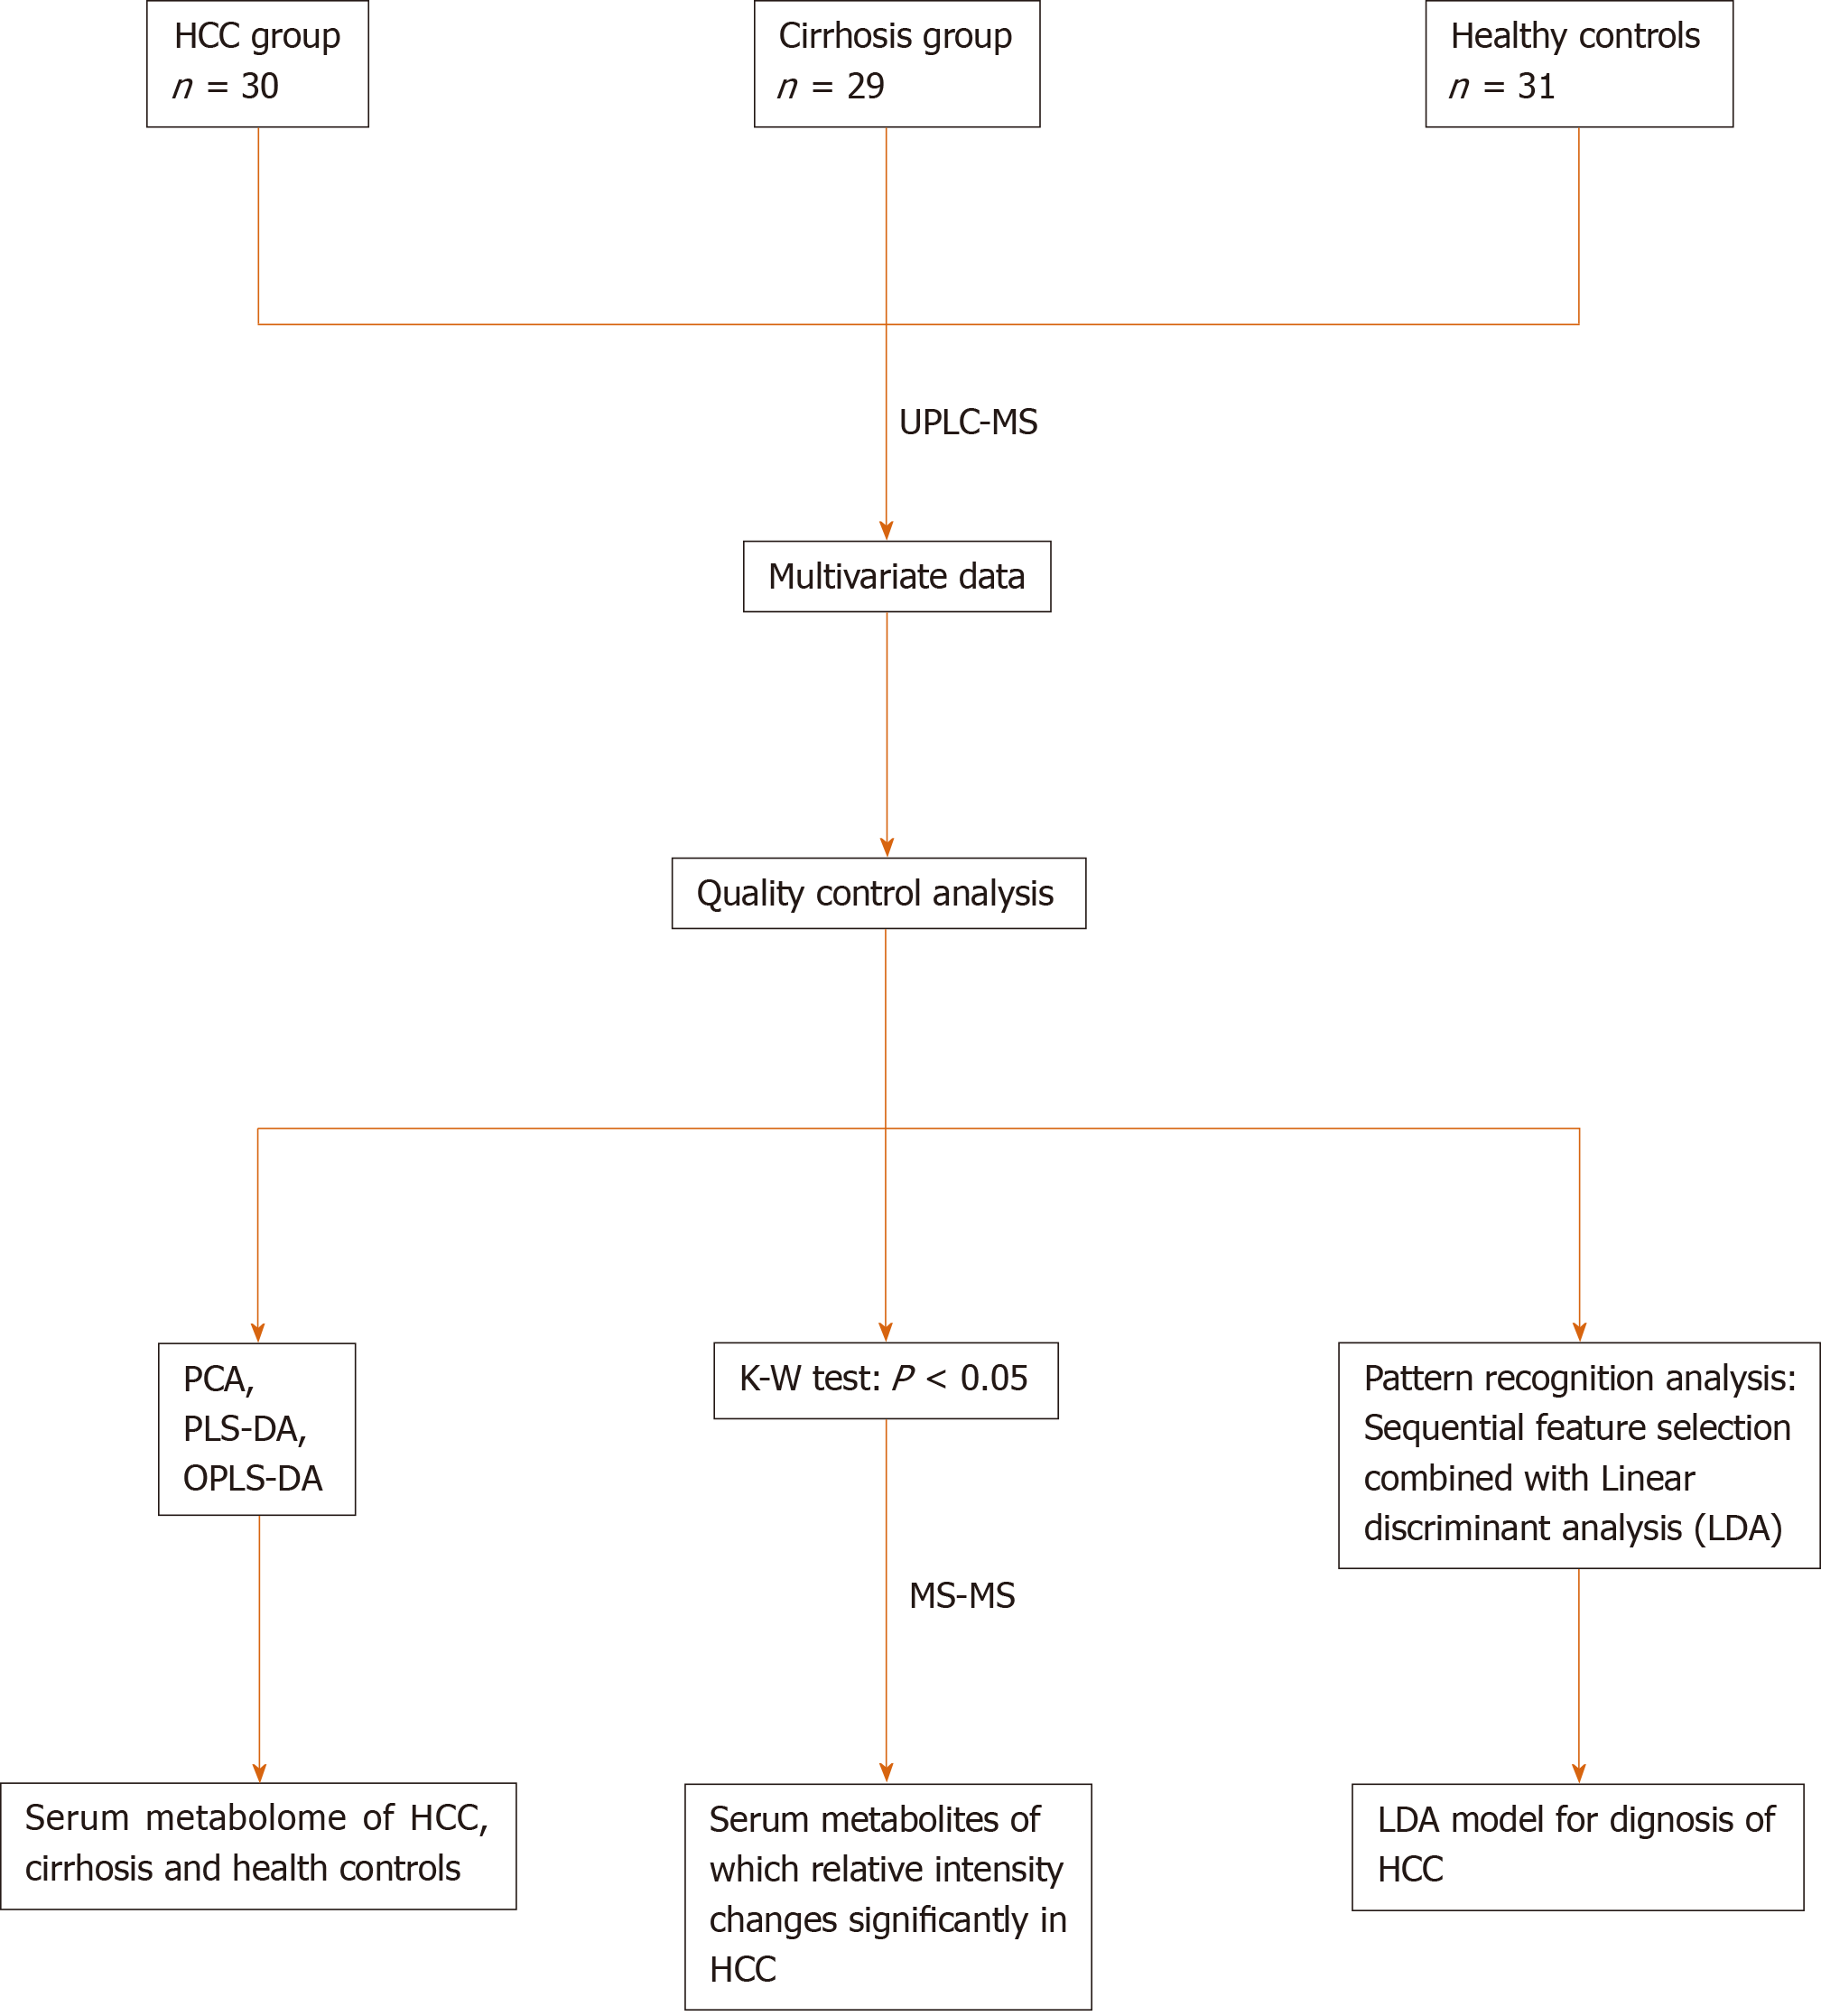
Figure 1 Road map of data analysis.
Road map of data analysis. Ordinary multivariate statistical analysis (principal component analysis, partial least squares discriminant analysis, and orthogonal partial least squares discriminant analysis) were used to describe the metabolome of the three groups. Pattern recognition analysis based on sequential feature selection combined with linear discriminant analysis were used to diagnose hepatocellular carcinoma. The Kruskal–Wallis test was used to identify differences in metabolites. PCA: Principal component analysis; PLS-DA: Partial least squares discriminant analysis; OPLS-DA: Orthogonal partial least squares discriminant analysis; LDA: Linear discriminant analysis; HCC: Hepatocellular carcinoma.
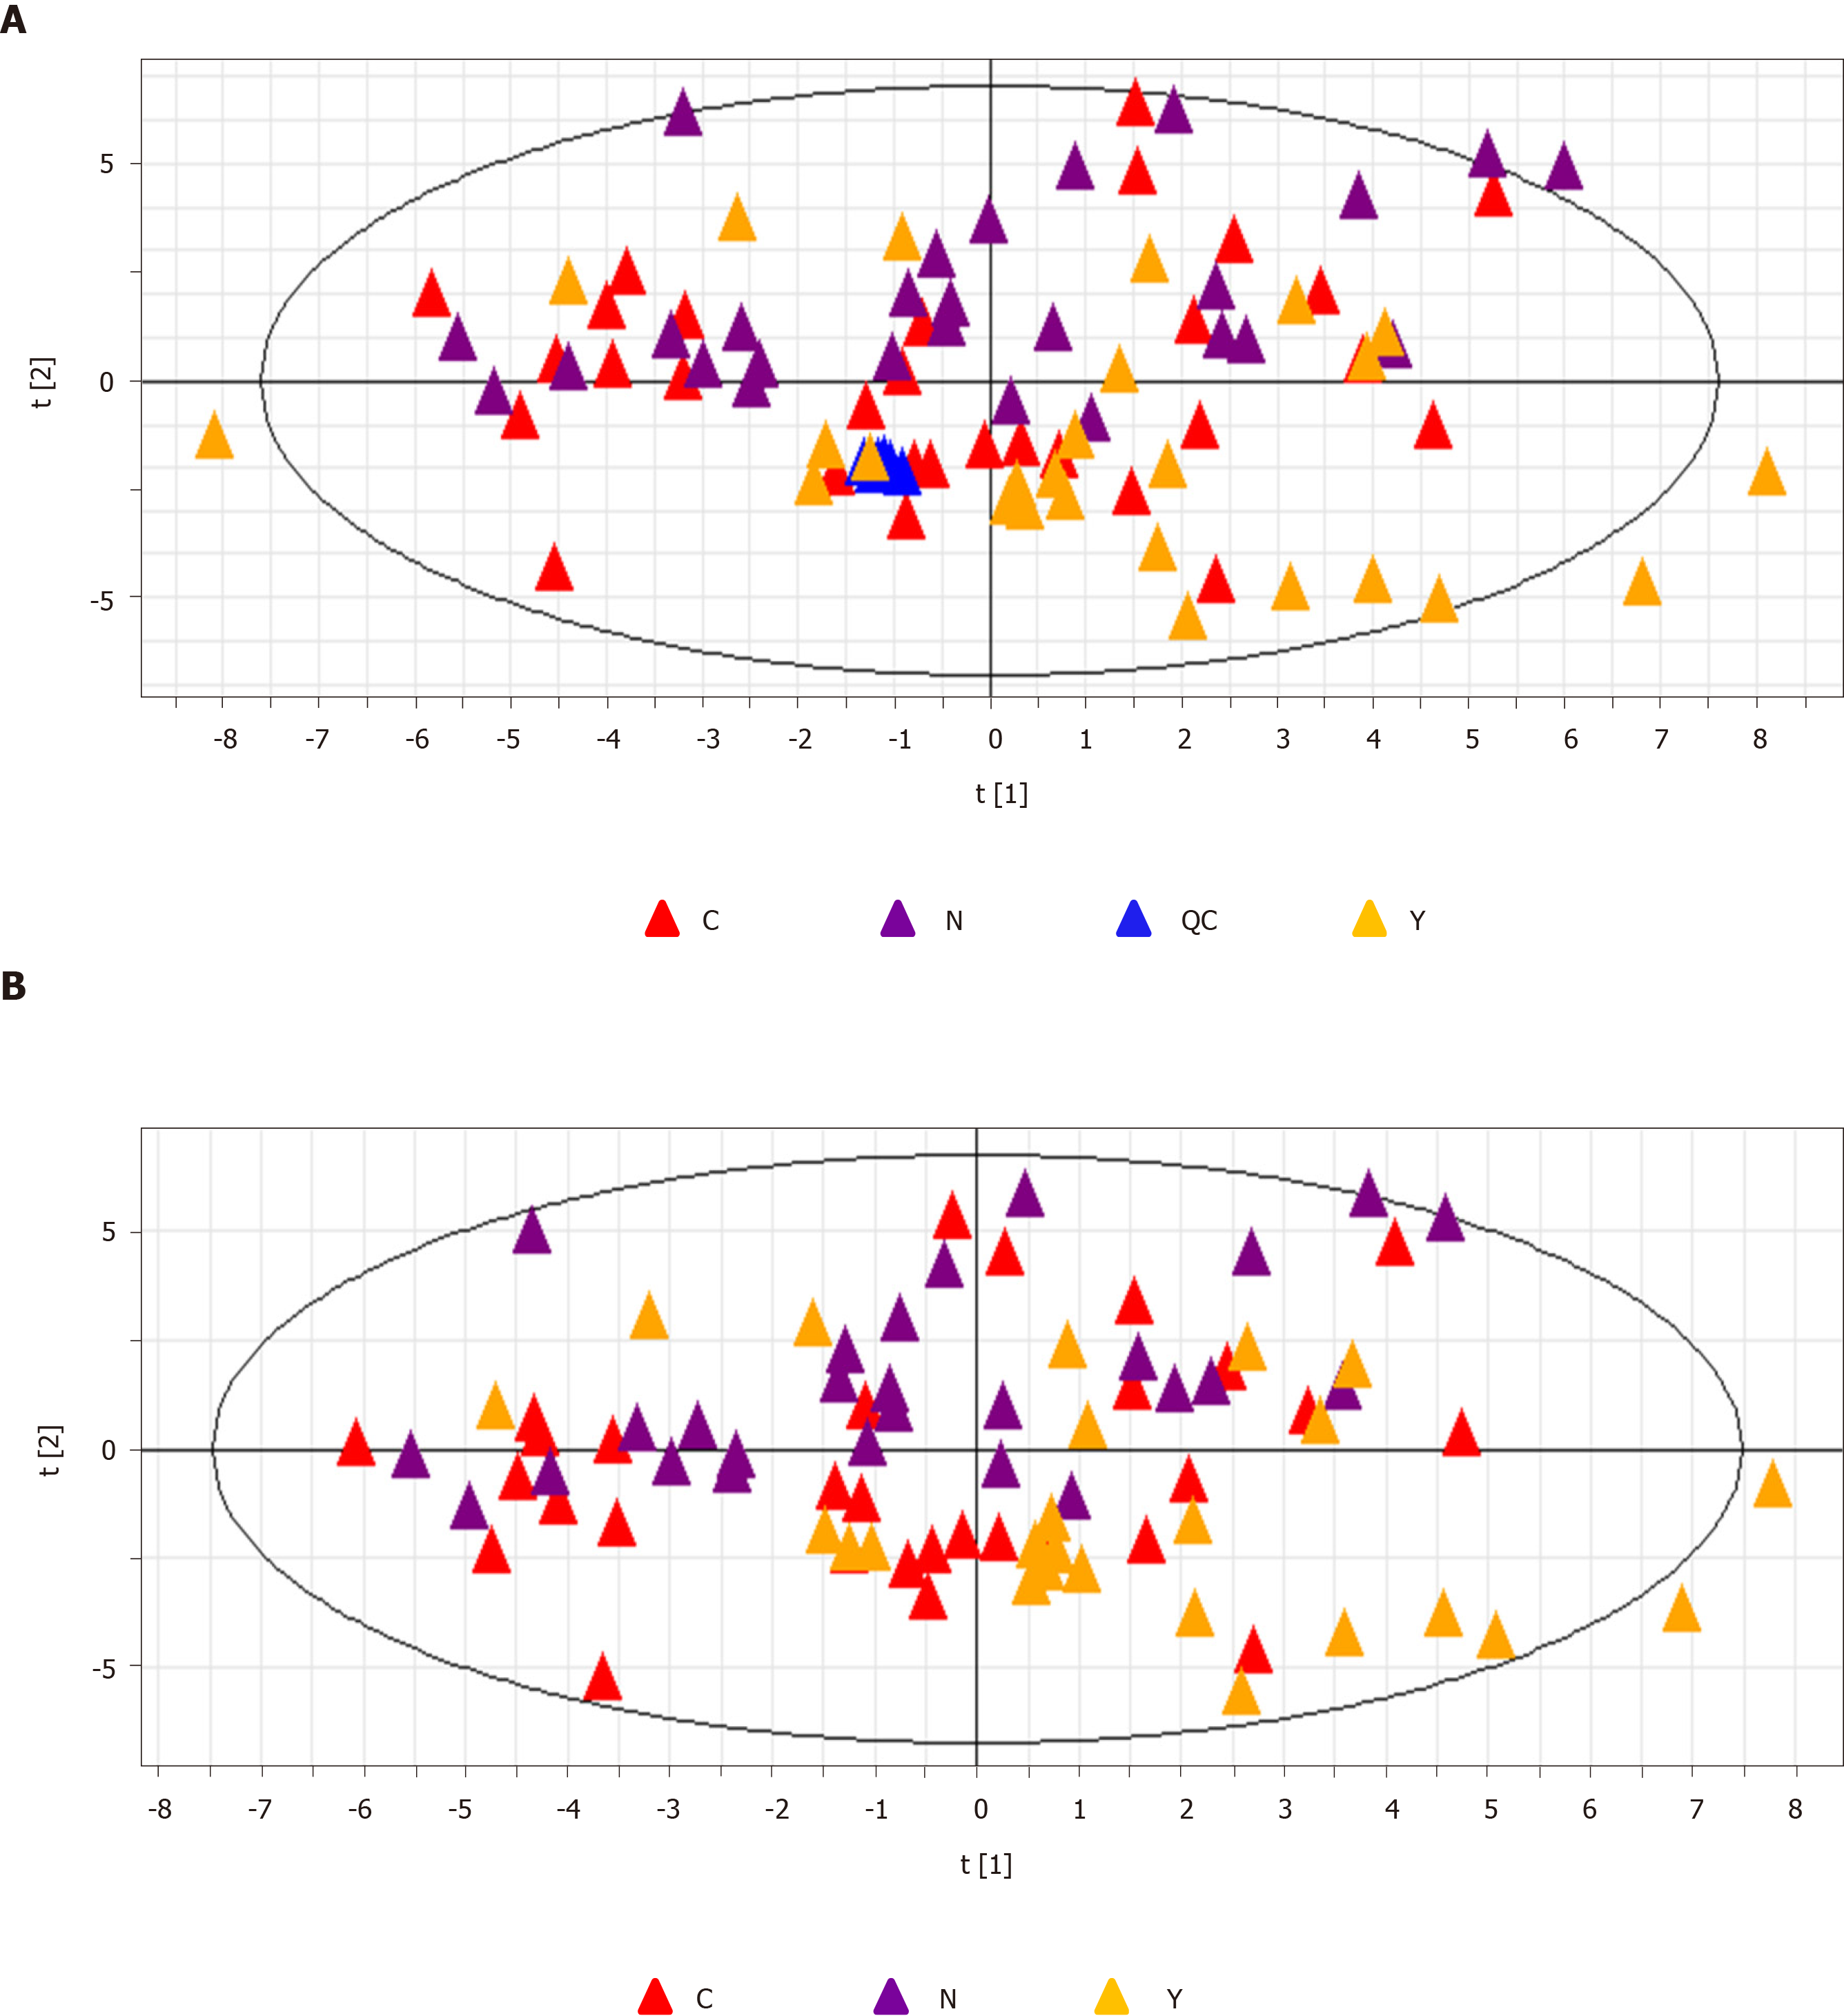
Figure 2 Principal component analysis.
A: The principal component analysis score plot of all samples including quality control samples. R2X = 0.134 cum, Q2 = 0.106 cum; and B: The principal component analysis score plot of all three groups, hepatocellular carcinoma group (C group) cirrhosis group (Y group), and healthy controls (N group). R2X = 0.139 cum, Q2 = 0.103 cum. QC: Quality control; PCA: Principal component analysis; HCC: Hepatocellular carcinoma.
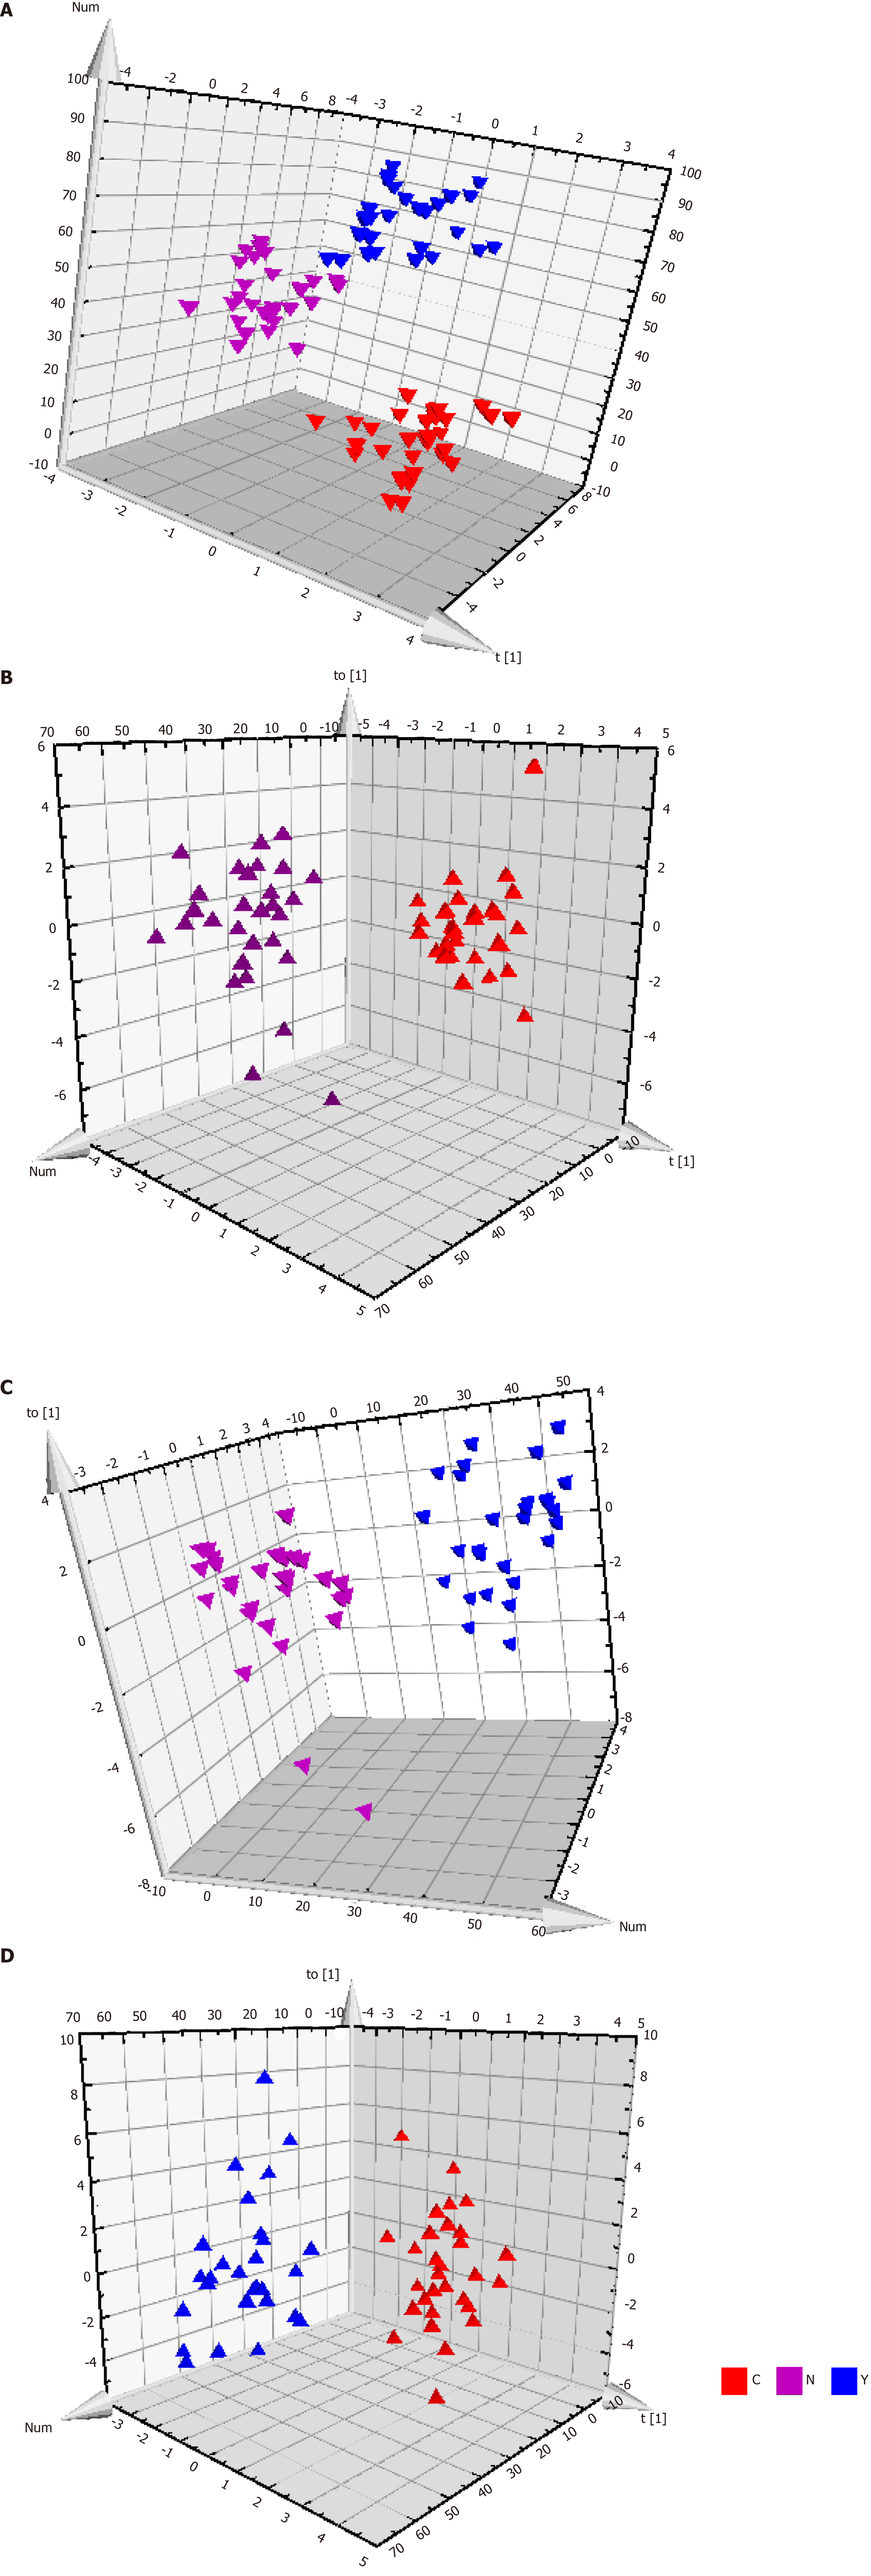
Figure 3 Metabolic profiles of serum from hepatocellular carcinoma patients, cirrhosis patients and healthy controls.
A: The orthogonal partial least squares discriminant analysis (OPLS-DA) score plot for all the three groups. Model efficiency: R2X = 0.370 cum, R2Y = 0.838 cum, Q2 = 0.467 cum; B: The OPLS-DA score plot of C group and N group. R2X = 0.187 cum, R2Y = 0.790 cum, Q2 = 0.603 cum; C: The OPLS-DA score plot of Y group and N group. R2X = 0.559 cum, R2Y = 0.962 cum, Q2 = 0.696 cum; and D: The OPLS-DA score plot of C group and Y group. R2X = 0.274 cum, R2Y = 0.812 cum, Q2 = 0.358 cum. OPLS-DA: Orthogonal partial least squares discriminant analysis.
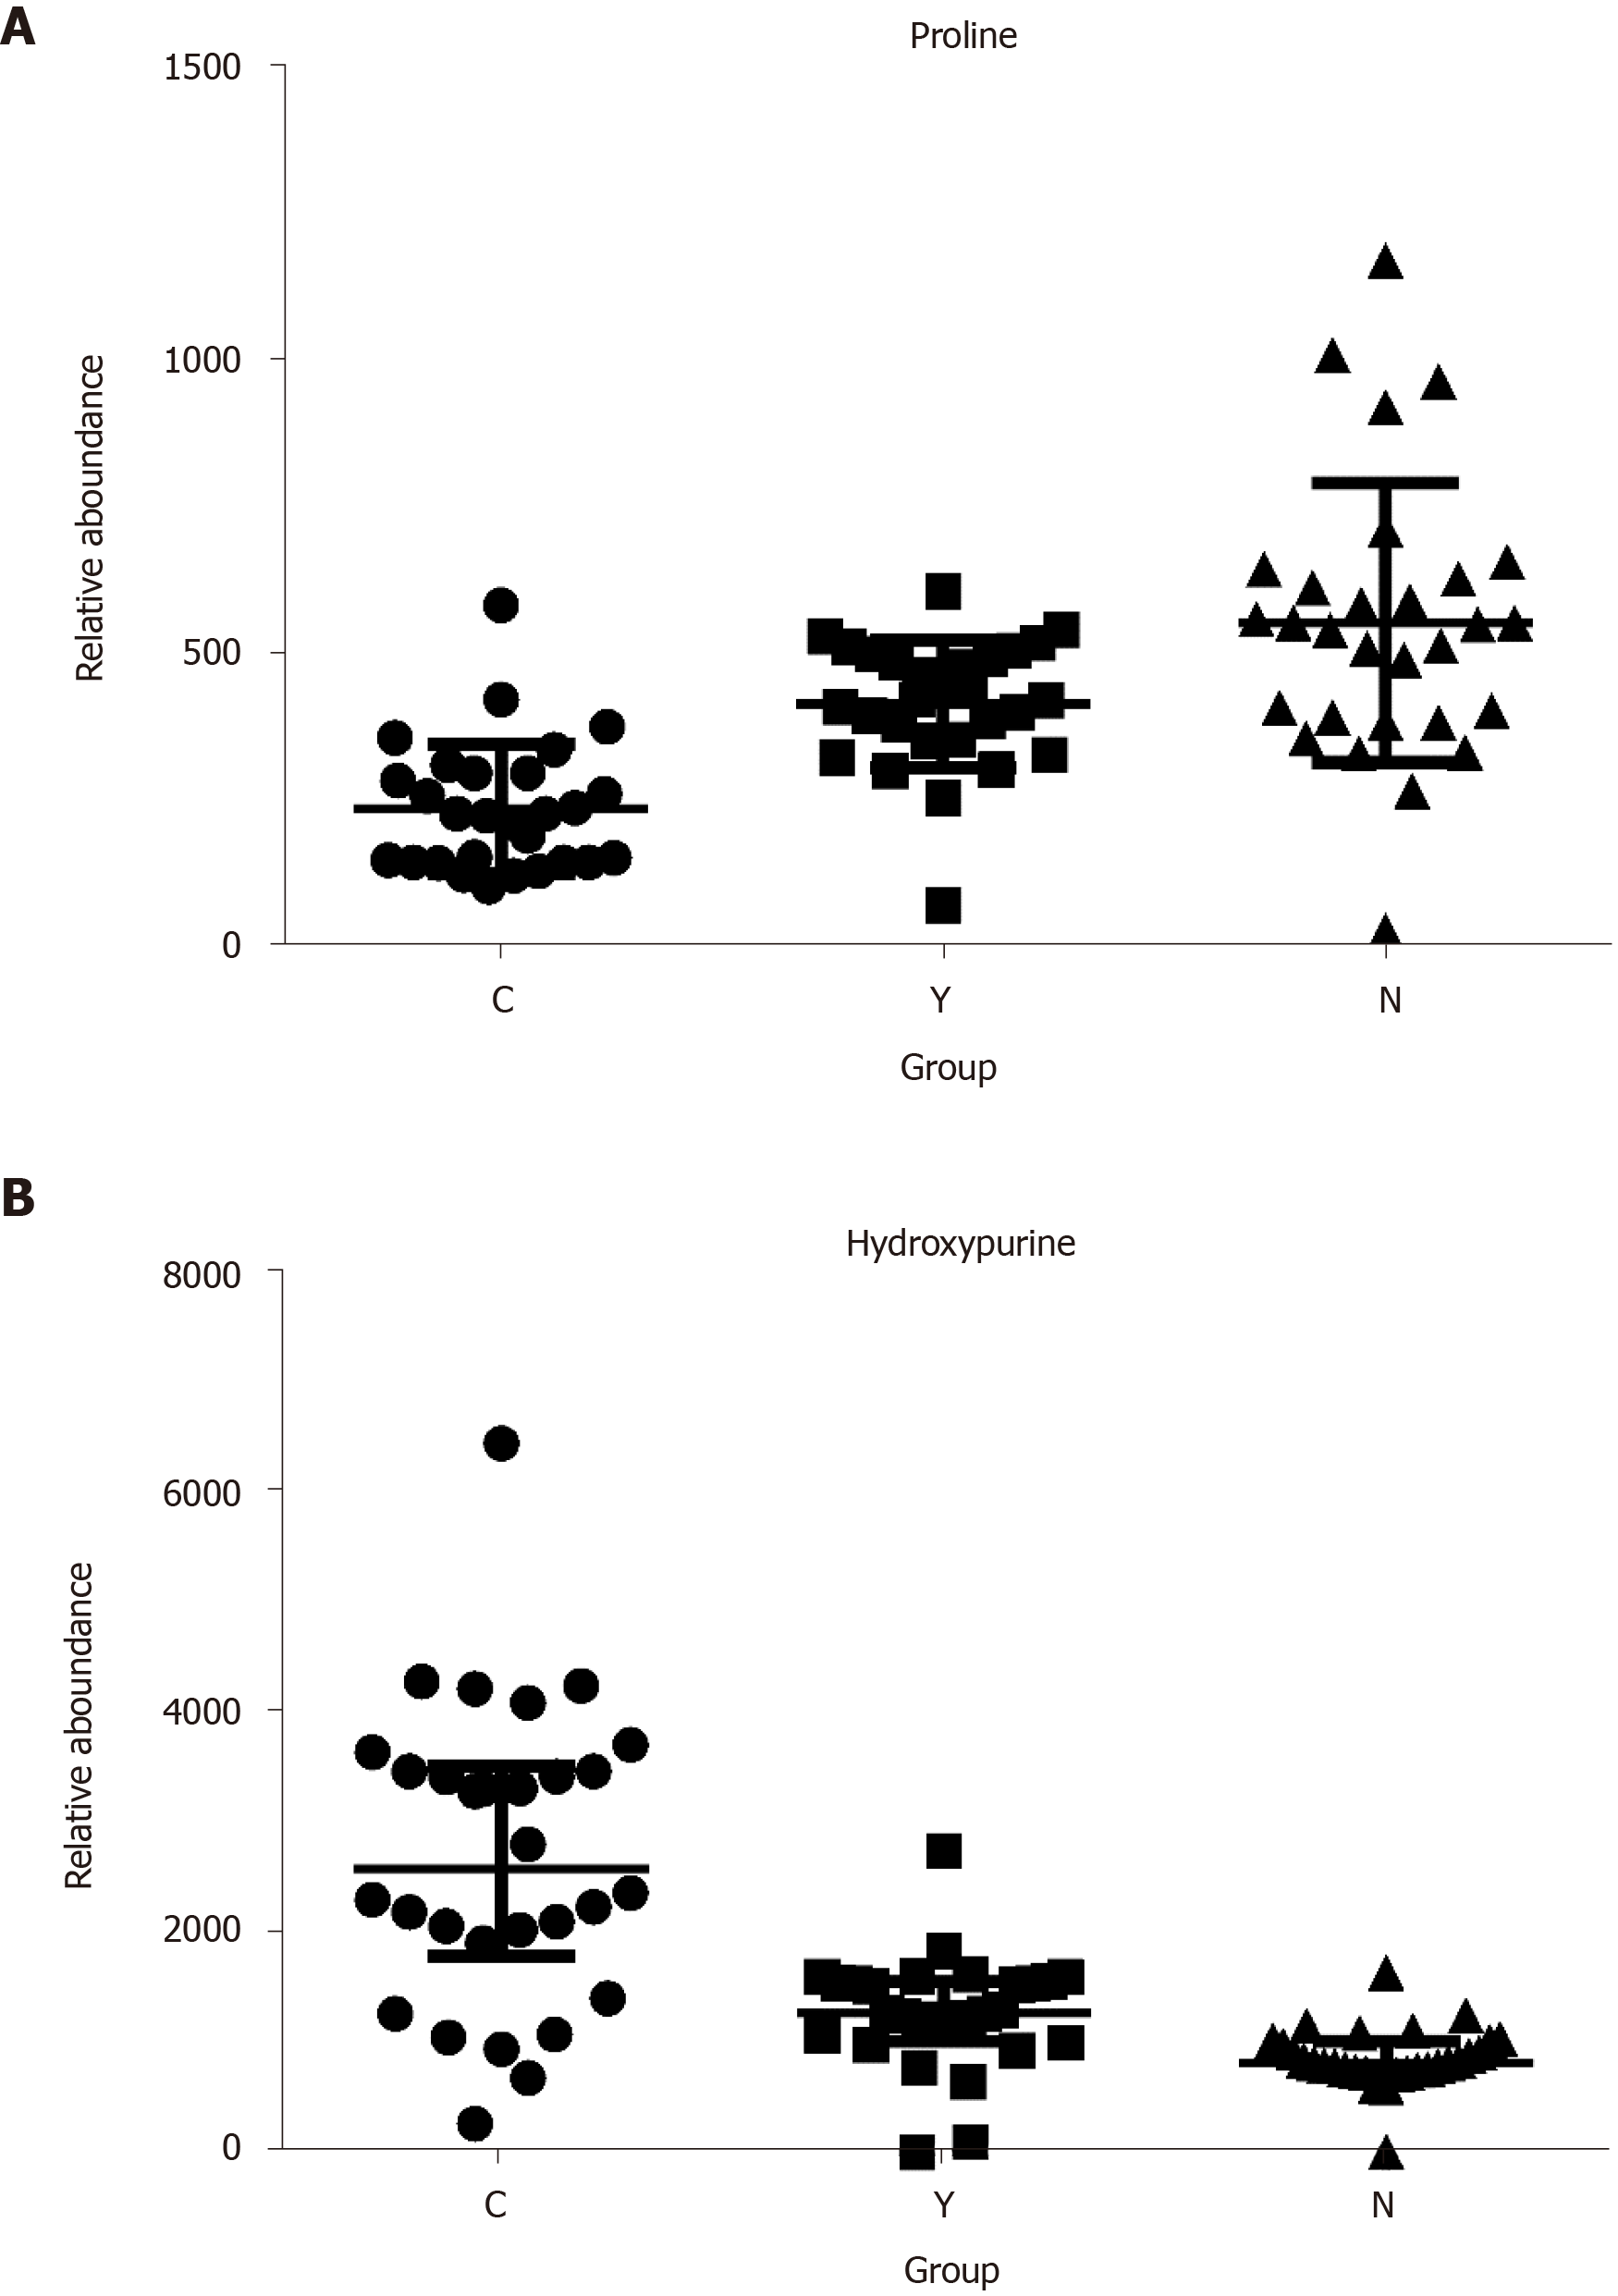
Figure 4 The relative abundance of proline and hydroxypurine in hepatocellular carcinoma patients, cirrhosis patients and healthy controls.
A: Proline; B: Hydroxypurine. P < 0.05 in Kruskal-Wallis test in all three comparisons (C vs N, Y vs N, and C vs Y) of each metabolite.
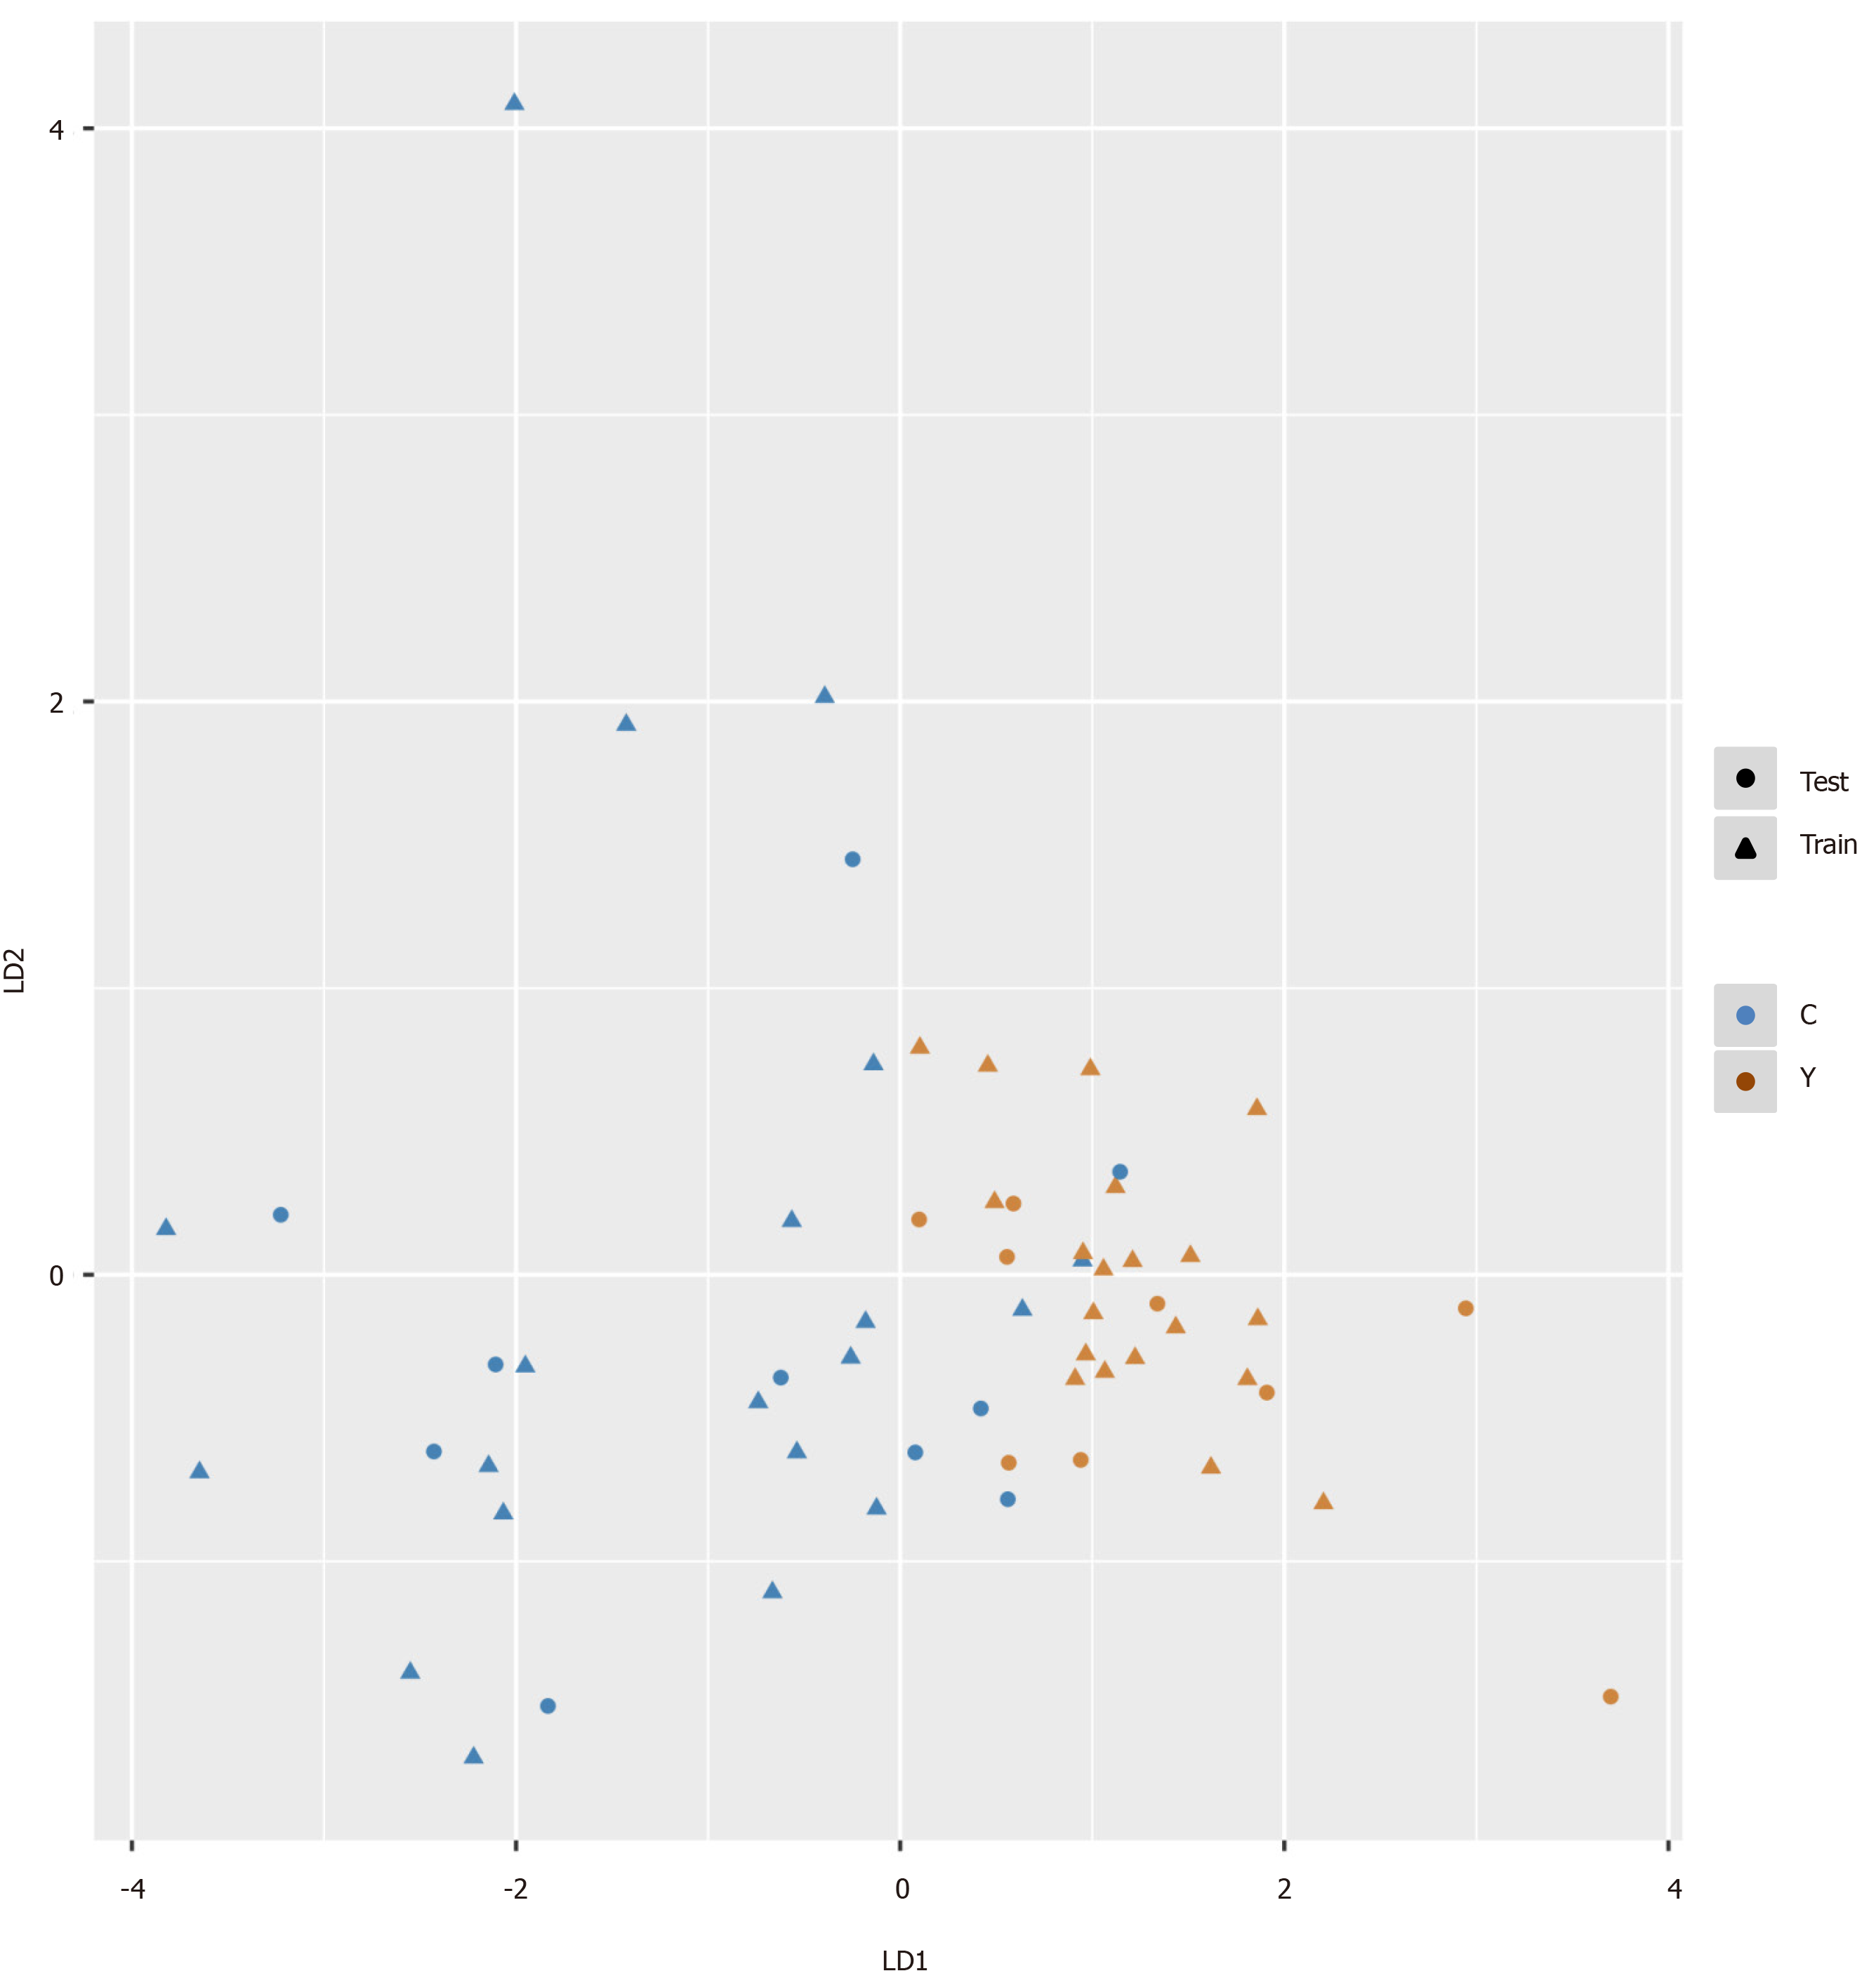
Figure 5 Pattern recognition for the diagnosis of hepatocellular carcinoma.
Pattern recognition analysis based on sequential feature selection combined with linear discriminant analysis (LDA) was used to find the most suitable biomarkers for discriminating hepatocellular carcinoma patients from cirrhosis patients in the training set. The validation set was used to confirm the reliability of the model. Hydroxypurine and proline were included in the LDA model. Function 1 and function 2 are the first two eigenvectors. Hepatocellular carcinoma samples and cirrhosis samples demonstrated different distributions in the LDA plot.
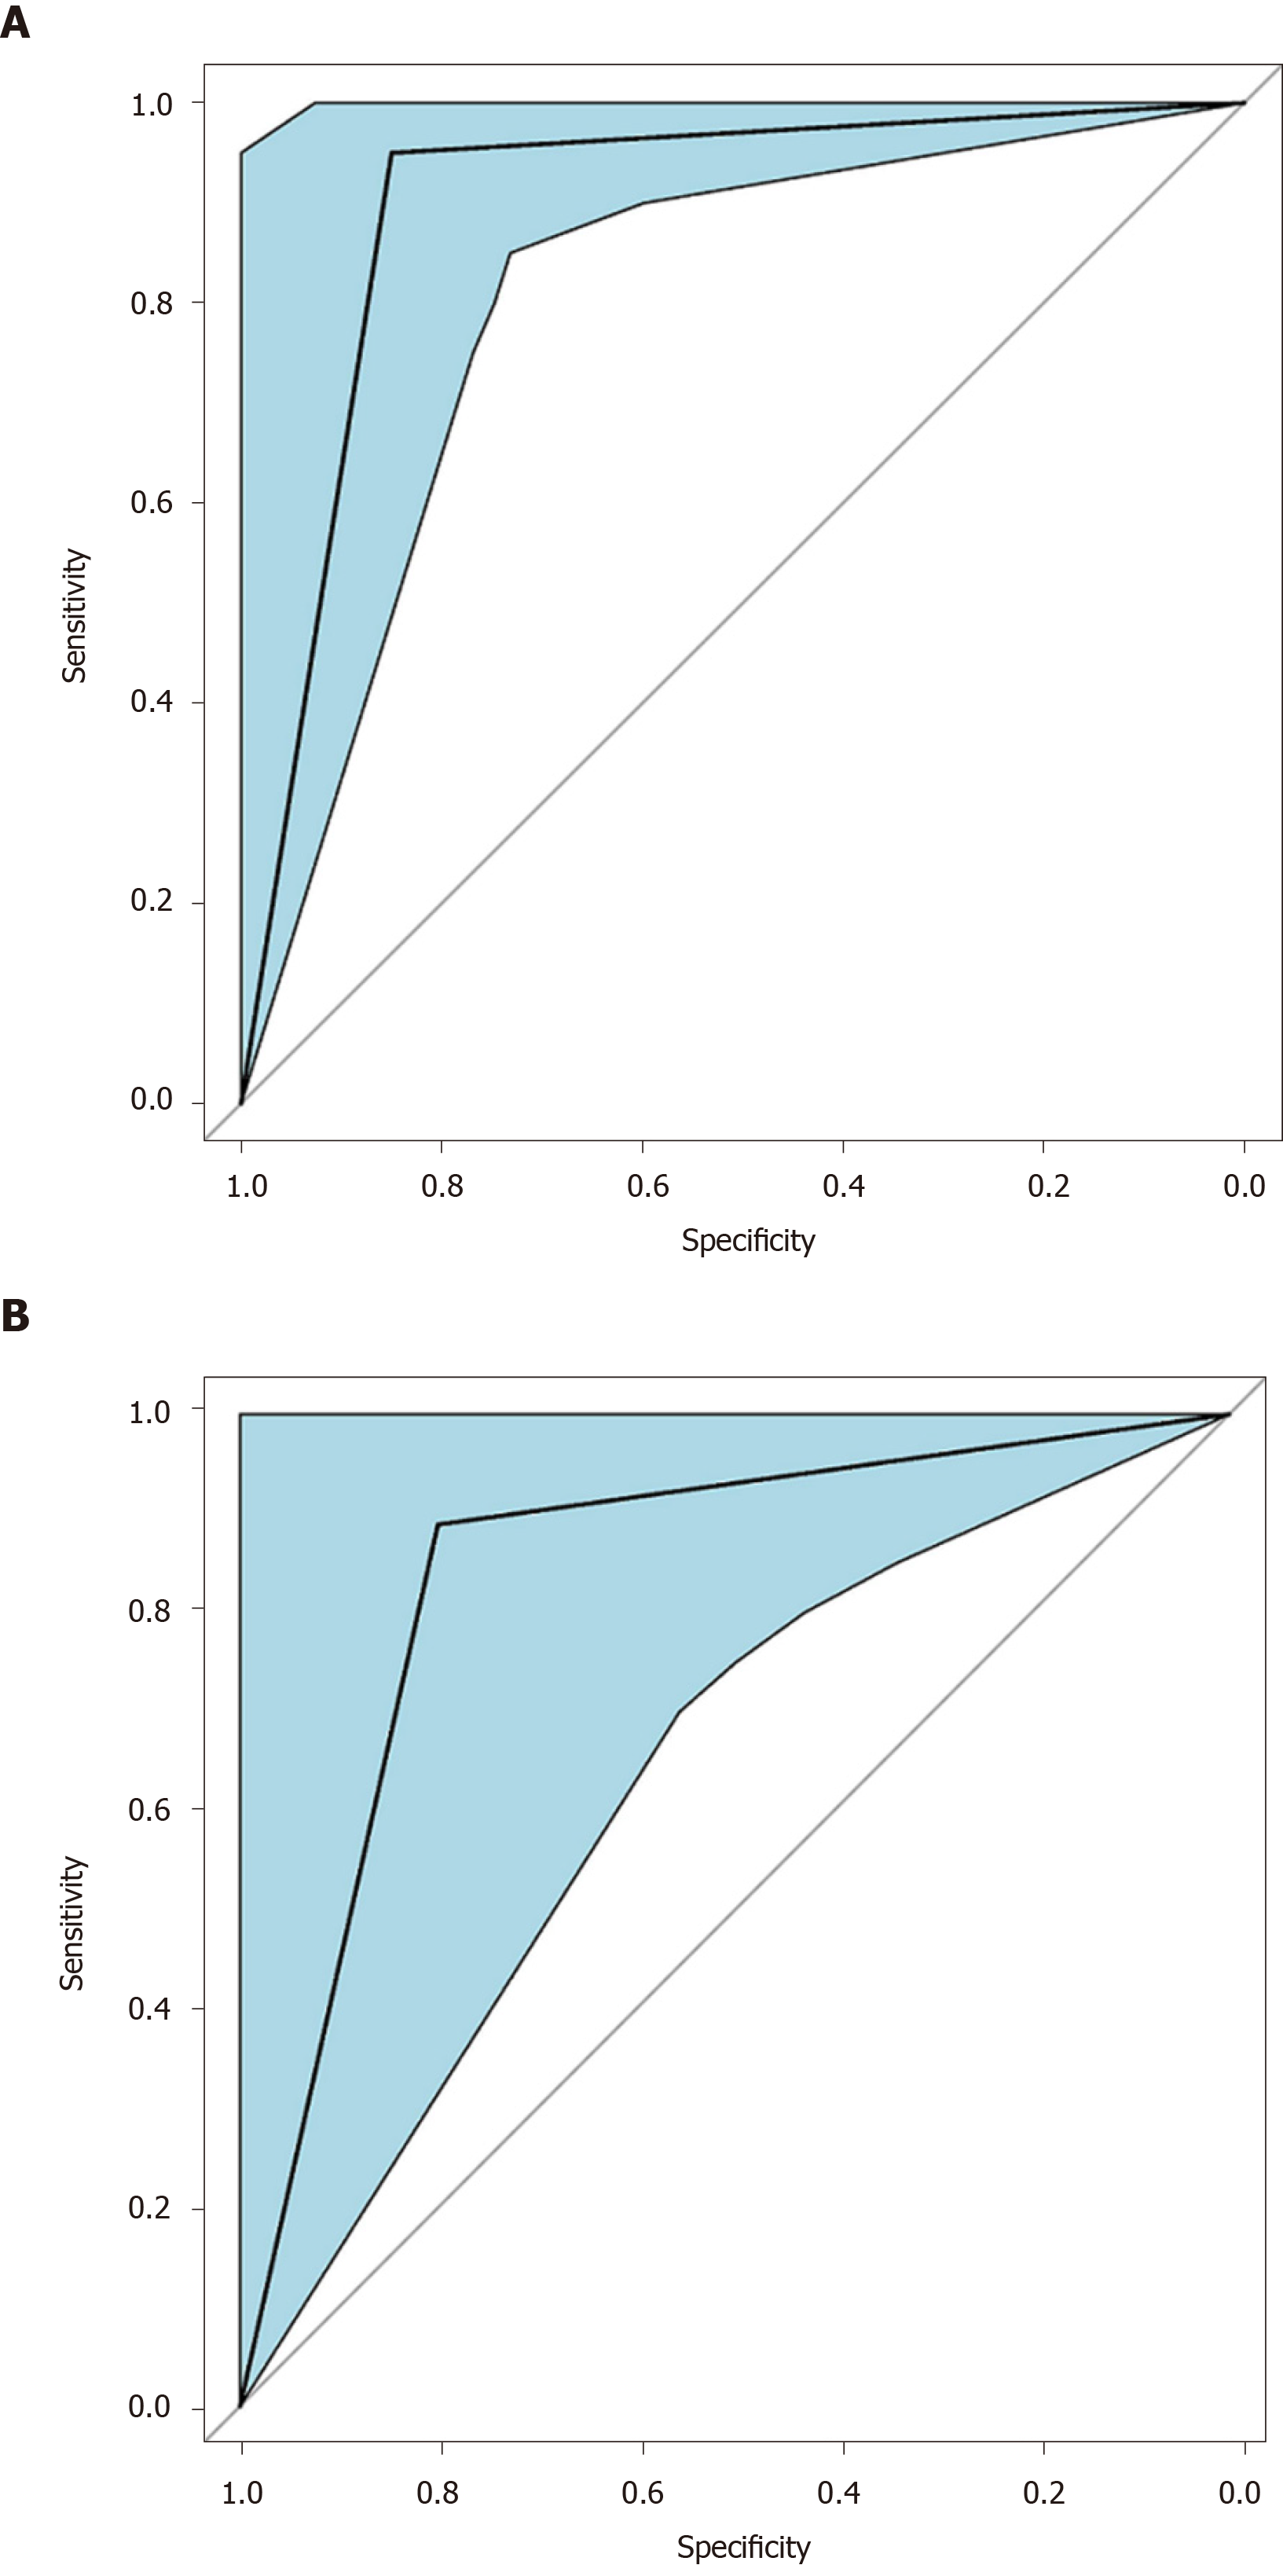
Figure 6 Receiver operating characteristic curve of the pattern recognition diagnostic model.
A: Receiver operating characteristic curve for the training set of the linear discriminant analysis model. Area under the curve for the training set was 0.90 (95%CI: 0.81-0.99); B: Receiver operating characteristic for the validation (test) set of the linear discriminant analysis model. Area under the curve for the validation set was 0.84 (95%CI: 0.67-1.00).
- Citation: Zhou PC, Sun LQ, Shao L, Yi LZ, Li N, Fan XG. Establishment of a pattern recognition metabolomics model for the diagnosis of hepatocellular carcinoma. World J Gastroenterol 2020; 26(31): 4607-4623
- URL: https://www.wjgnet.com/1007-9327/full/v26/i31/4607.htm
- DOI: https://dx.doi.org/10.3748/wjg.v26.i31.4607


