Copyright
©The Author(s) 2020.
World J Gastroenterol. Jun 14, 2020; 26(22): 2967-2986
Published online Jun 14, 2020. doi: 10.3748/wjg.v26.i22.2967
Published online Jun 14, 2020. doi: 10.3748/wjg.v26.i22.2967
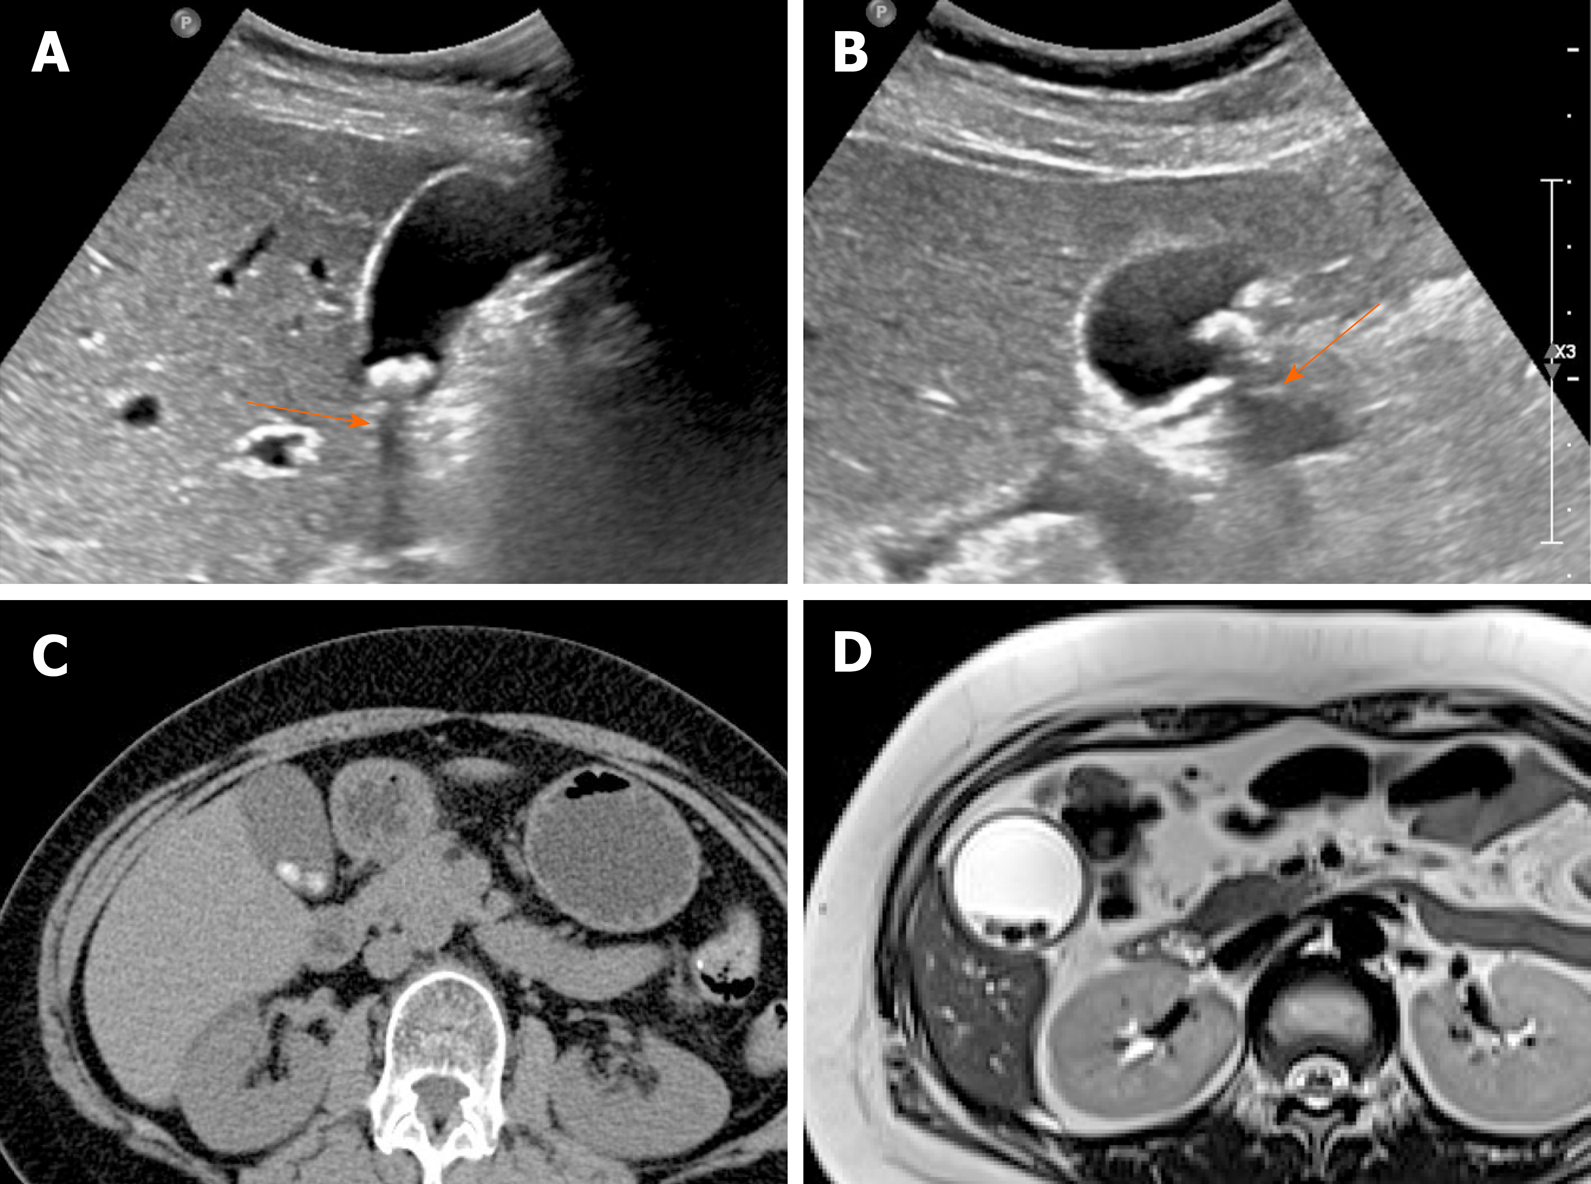
Figure 1 Gallstones.
A, B: Typical echogenic lesions of gallbladder with posterior acoustic shadowing (arrows), that move in dependent manner during supine (A) to lateral decubitus (B) positional shift on ultrasound; C, D: Calcified lesions visible on precontrast computed tomography scan (C), appearing as low signal intensity on T2-weighted image (D).
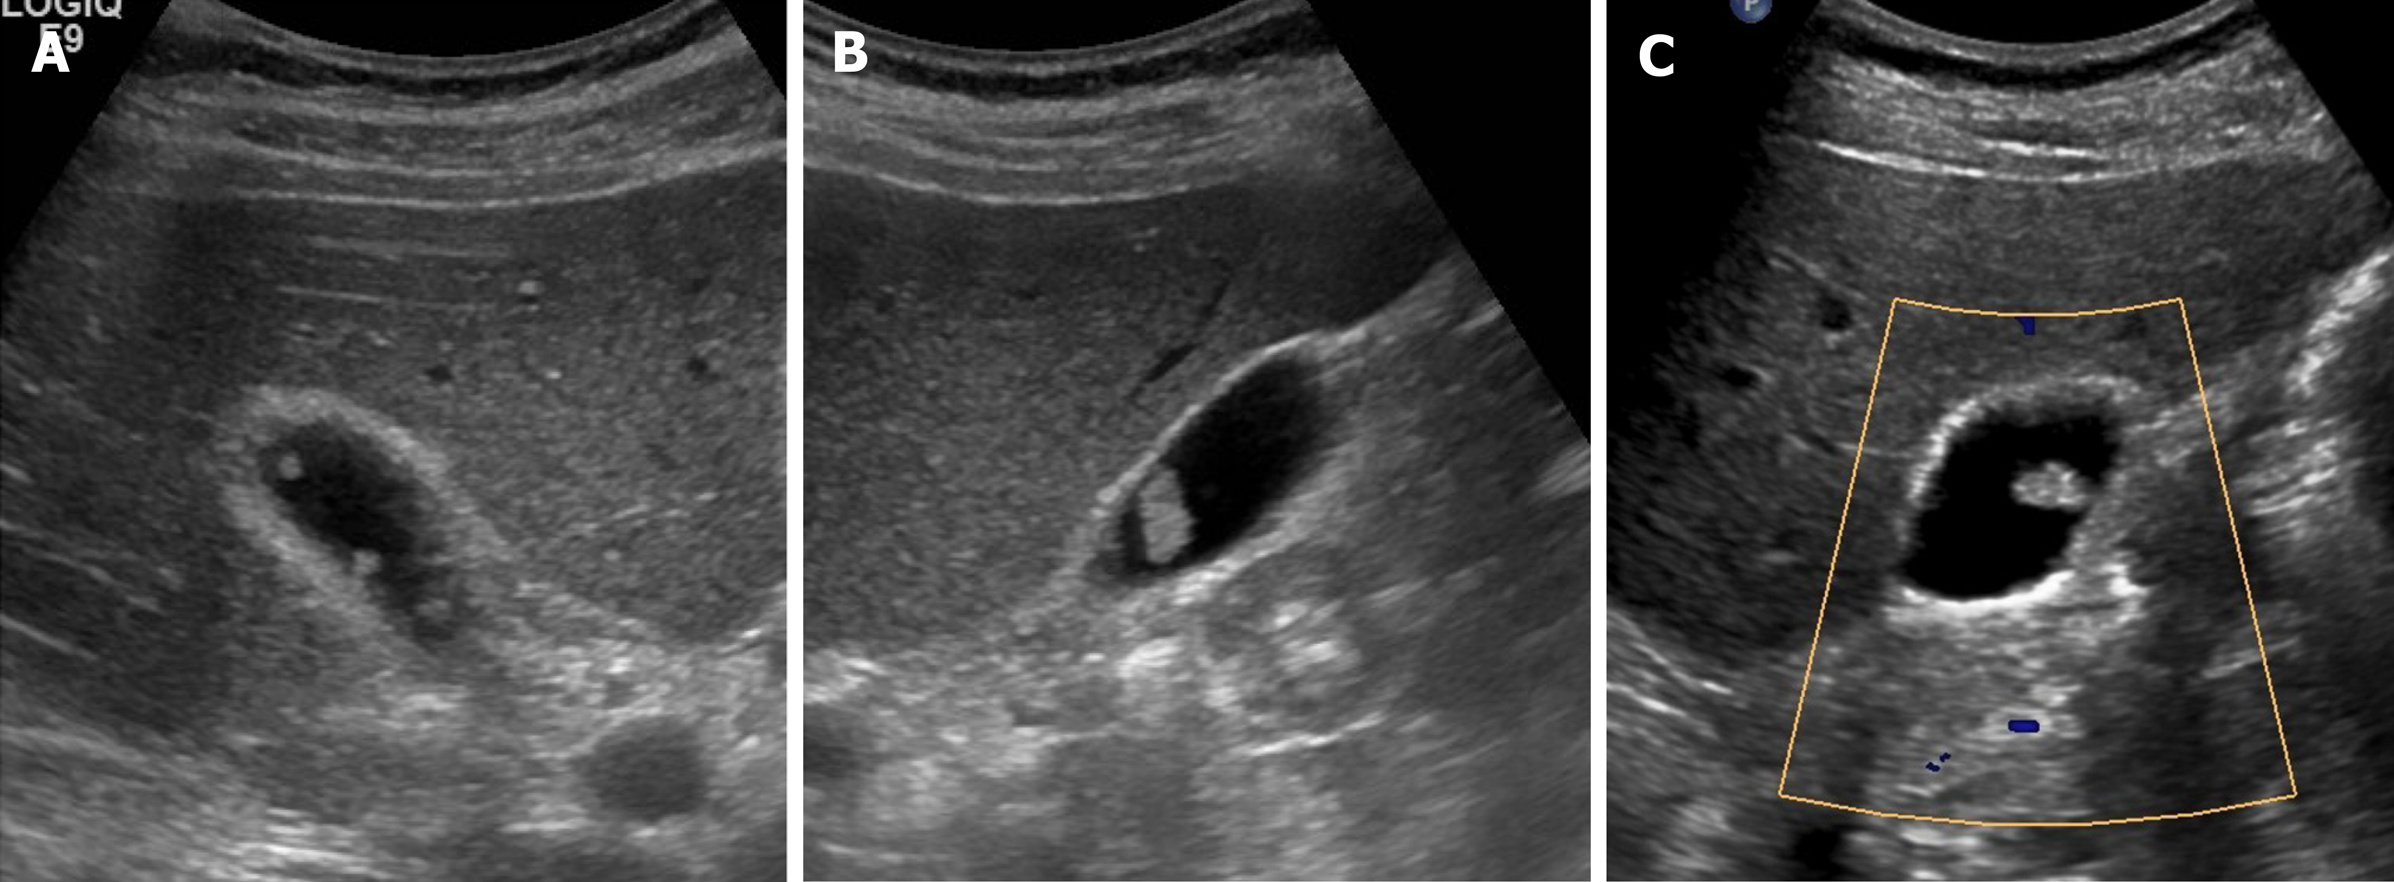
Figure 2 Cholesterol polyps.
A-C: Multiple, tiny, smooth, and hyperechoic intraluminal polypoid lesions attached to gallbladder wall, without posterior acoustic shadowing on ultrasound; internal vascularity of largest cholesterol polyp not evident by color Doppler ultrasound (C).
Figure 3 Gallbladder adenoma.
A: Single, echogenic, intraluminal polypoid lesion within distal body of gallbladder on ultrasound (US); B: Internal vascular core (arrow) demonstrable by color Doppler US; C: Homogeneous hyperenhancement of polypoid lesion on contrast-enhanced US using Sonovue, with intact gallbladder wall and no evidence of invasion [cholecystectomy performed due to size (> 2.5 cm) and adenoma confirmed].
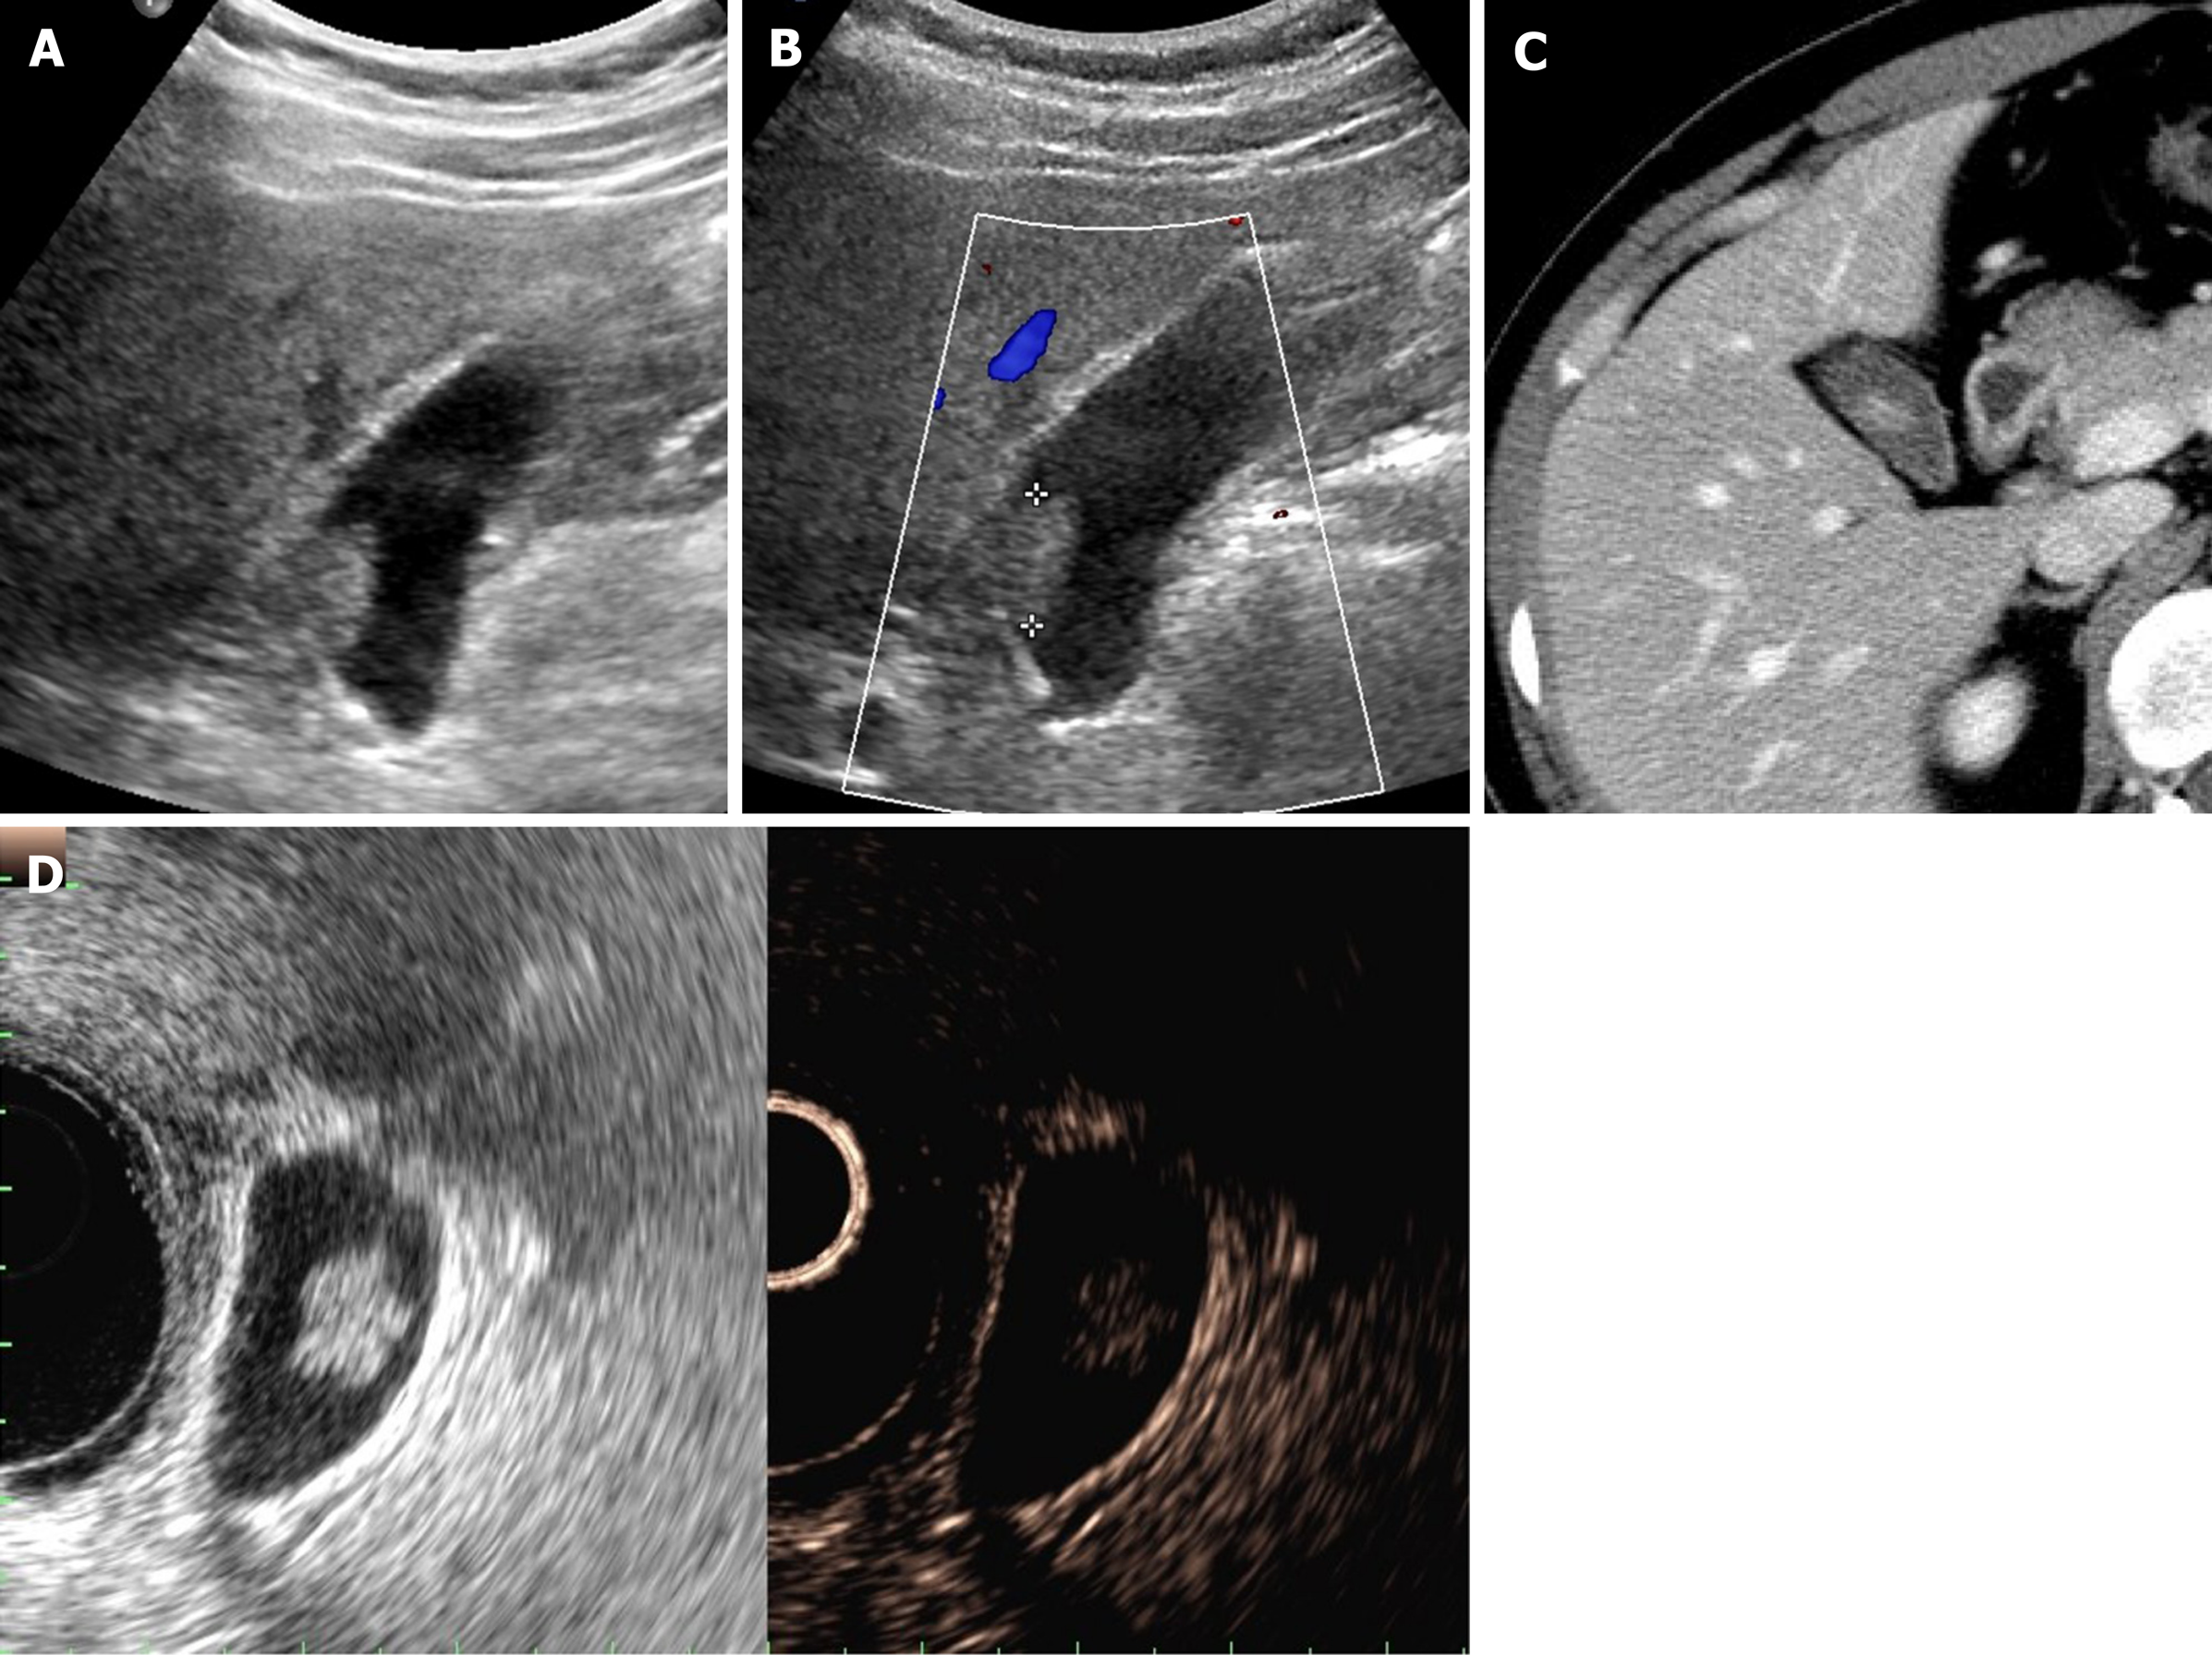
Figure 4 Cholesterol polyp.
A: Single, echogenic, broad-based, mass-like lesion in proximal body of gallbladder on ultrasound; B: Internal vascularity not evident by color Doppler ultrasound; C: Small enhancing intraluminal lesion of gallbladder on computed tomography; D: no broad base, and mosaic pattern of weak enhancement revealed by contrast-enhanced endoscopic ultrasound using Sonovue (lesion confirmed as cholesterol polyp).
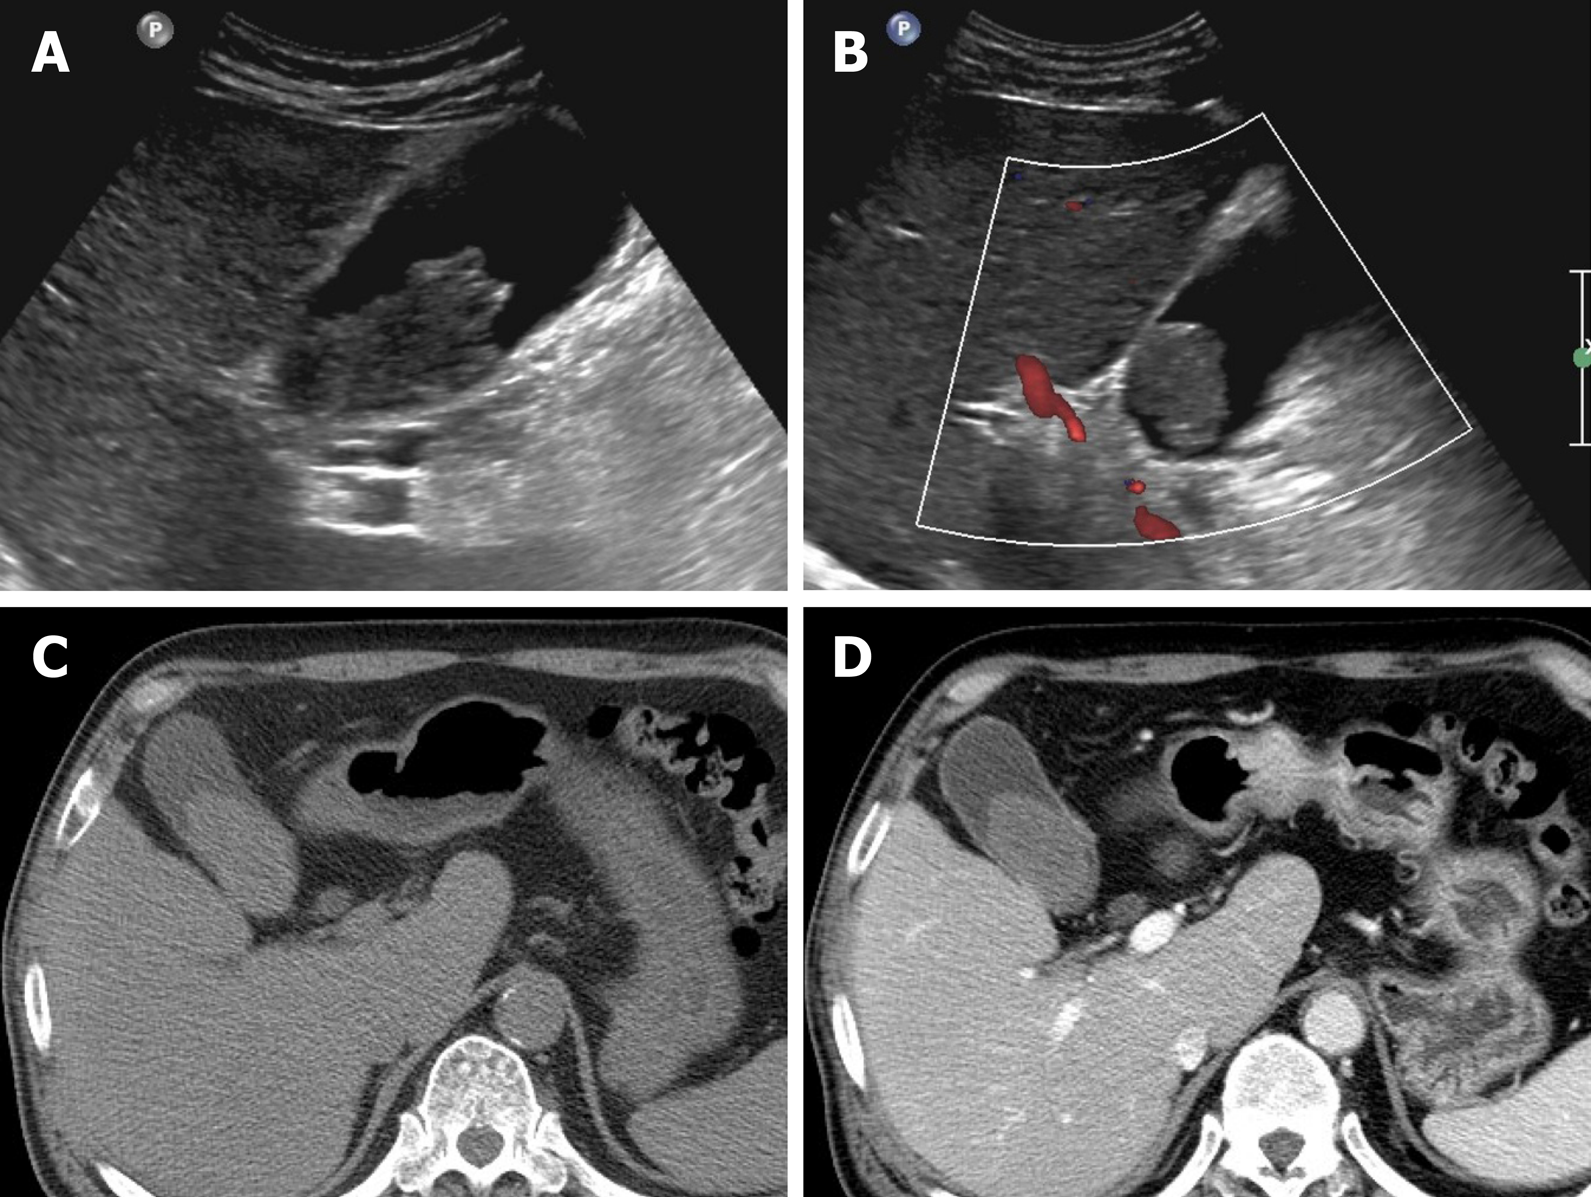
Figure 5 Sludge ball.
A, B: Ultrasound imaging of movable intraluminal echogenic mass-like gallbladder lesion, without posterior acoustic shadowing, internal vascularity absent by color Doppler ultrasound (B); C, D: high-attenuated intraluminal mass on precontrast computed tomography (C), with no enhancement on post-contrast computed tomography (D).
Figure 6 Tumefactive sludge.
A, B: Heterogeneous mixed echogenic mass occupying gallbladder on ultrasound; C: Hyperintensity (arrow) on T1-weighted image; D: Mild hyperintensity (arrow) on T2-weighted image. This lesion disappeared in follow-up images (not shown).
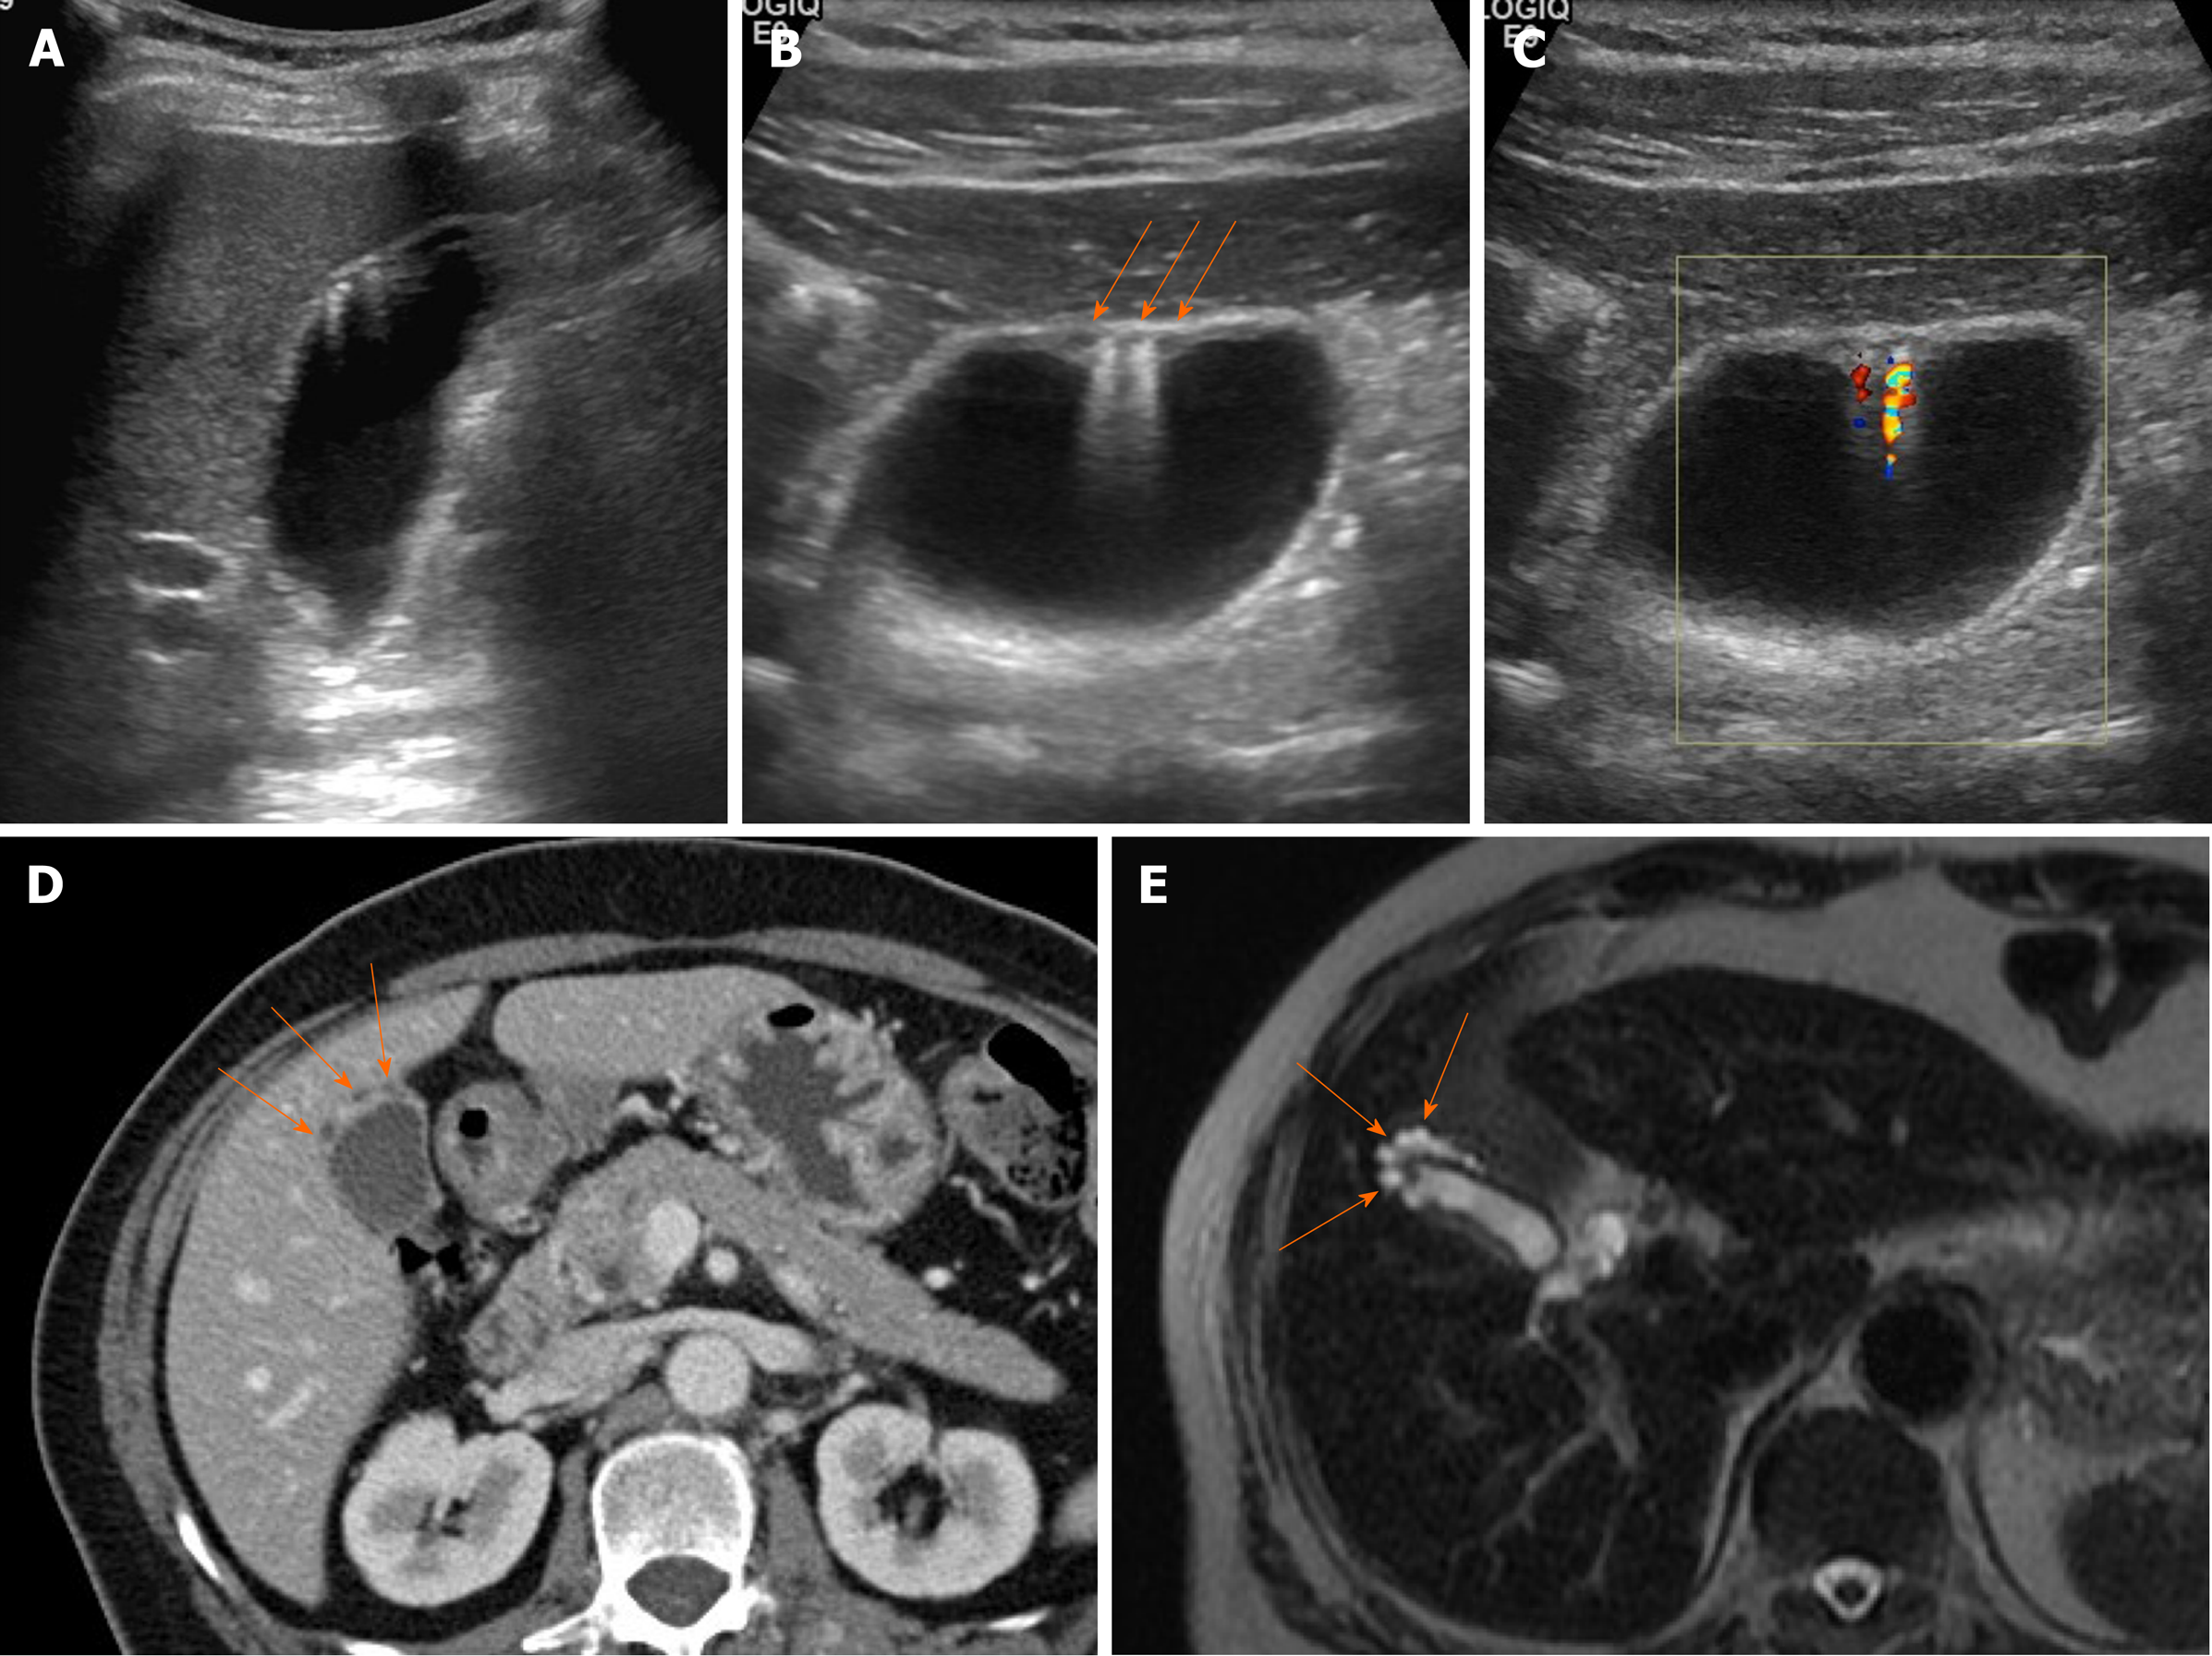
Figure 7 Segmental adenomyomatosis.
A: Mild segmental thickening of fundal gallbladder wall, with comet-tail artifacts on conventional ultrasound (US); B, C: High-resolution US (using high-frequency probe) showing small anechoic cystic inclusions (arrows) of thickened gallbladder wall (Rokitansky-Aschoff sinuses) and comet-tail artifacts, superior to conventional US (B); twinkling artifacts observed on color Doppler US (C); D, E: Same intramural cystic spaces (arrows) and wall thickening of adenomyomatosis seen by computed tomography (C) and magnetic resonance imaging (D).
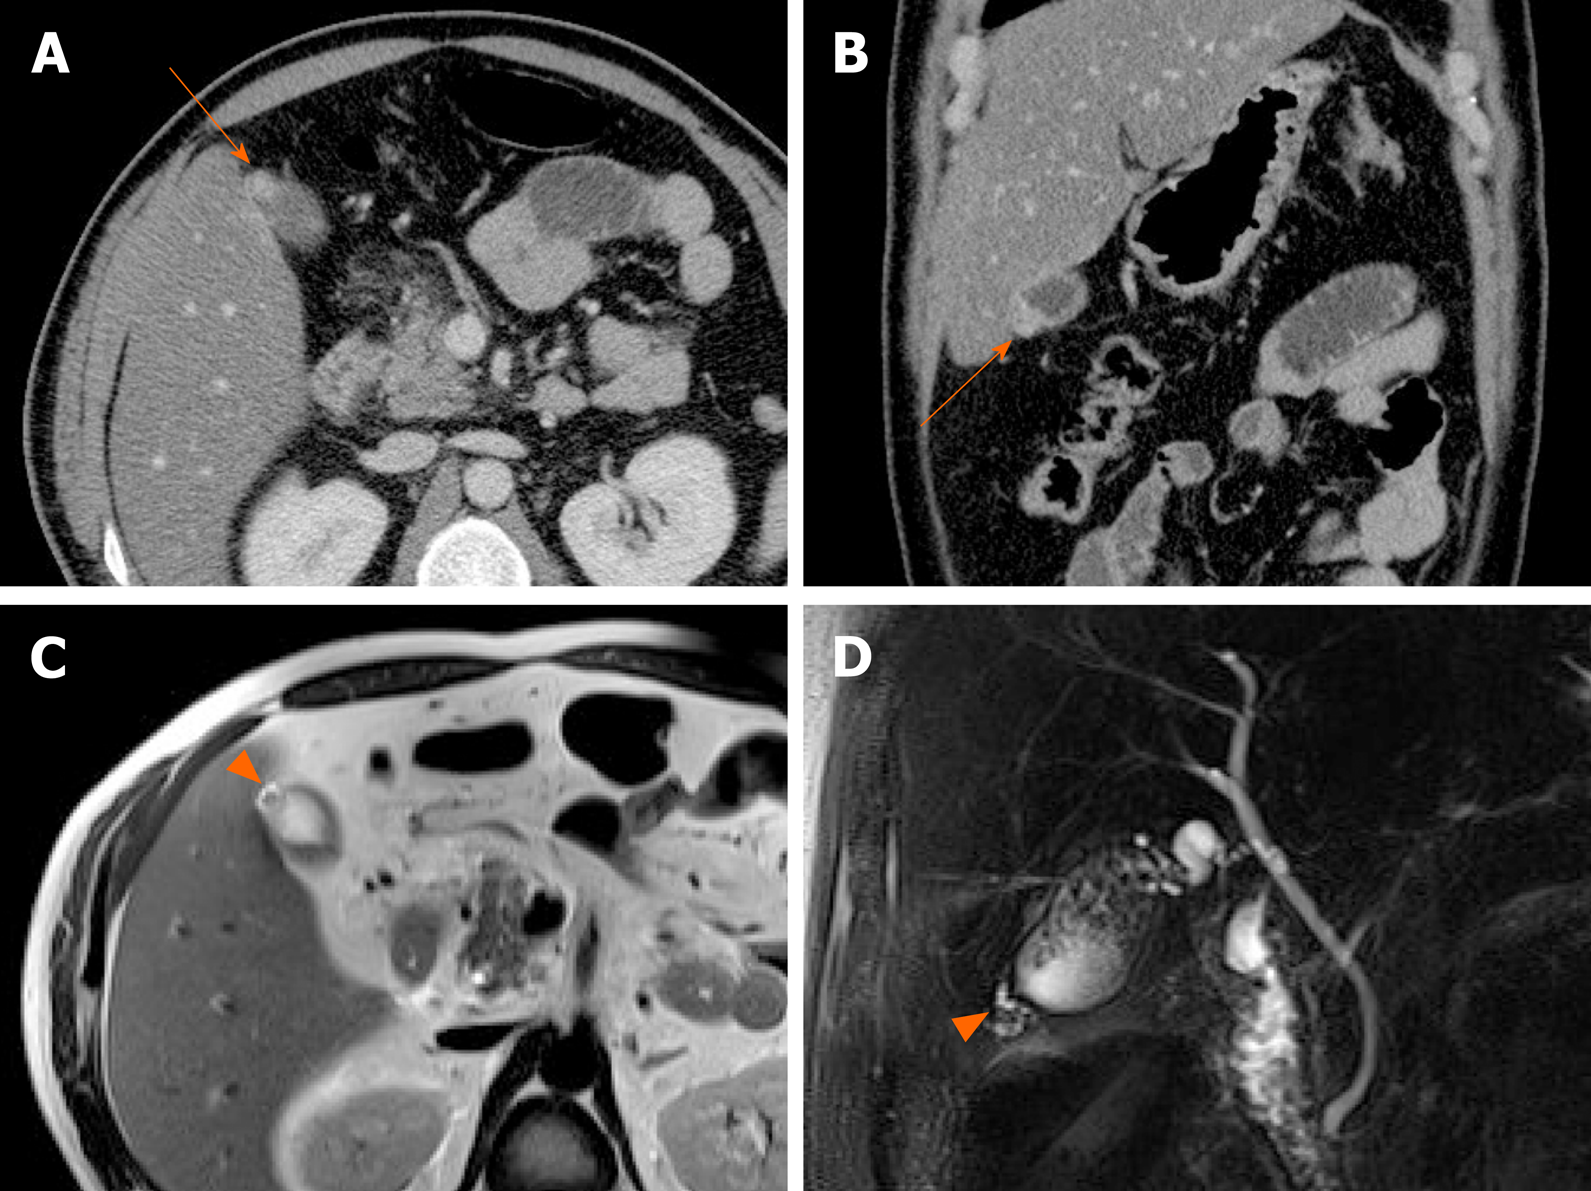
Figure 8 Fundal adenomyomatosis.
A, B: Oval-shaped nodular enhancing mural thickening (arrow) of fundus, with no observable cystic invaginations in axial and coronal computed tomography scans; C, D: Tiny intramural cysts clearly demonstrated within focally thickened fundal wall (arrowhead) on T2-weighted image (C) and magnetic resonance cholangiopancreatography (D), so-called “pearl necklace sign” of adenomyomatosis.
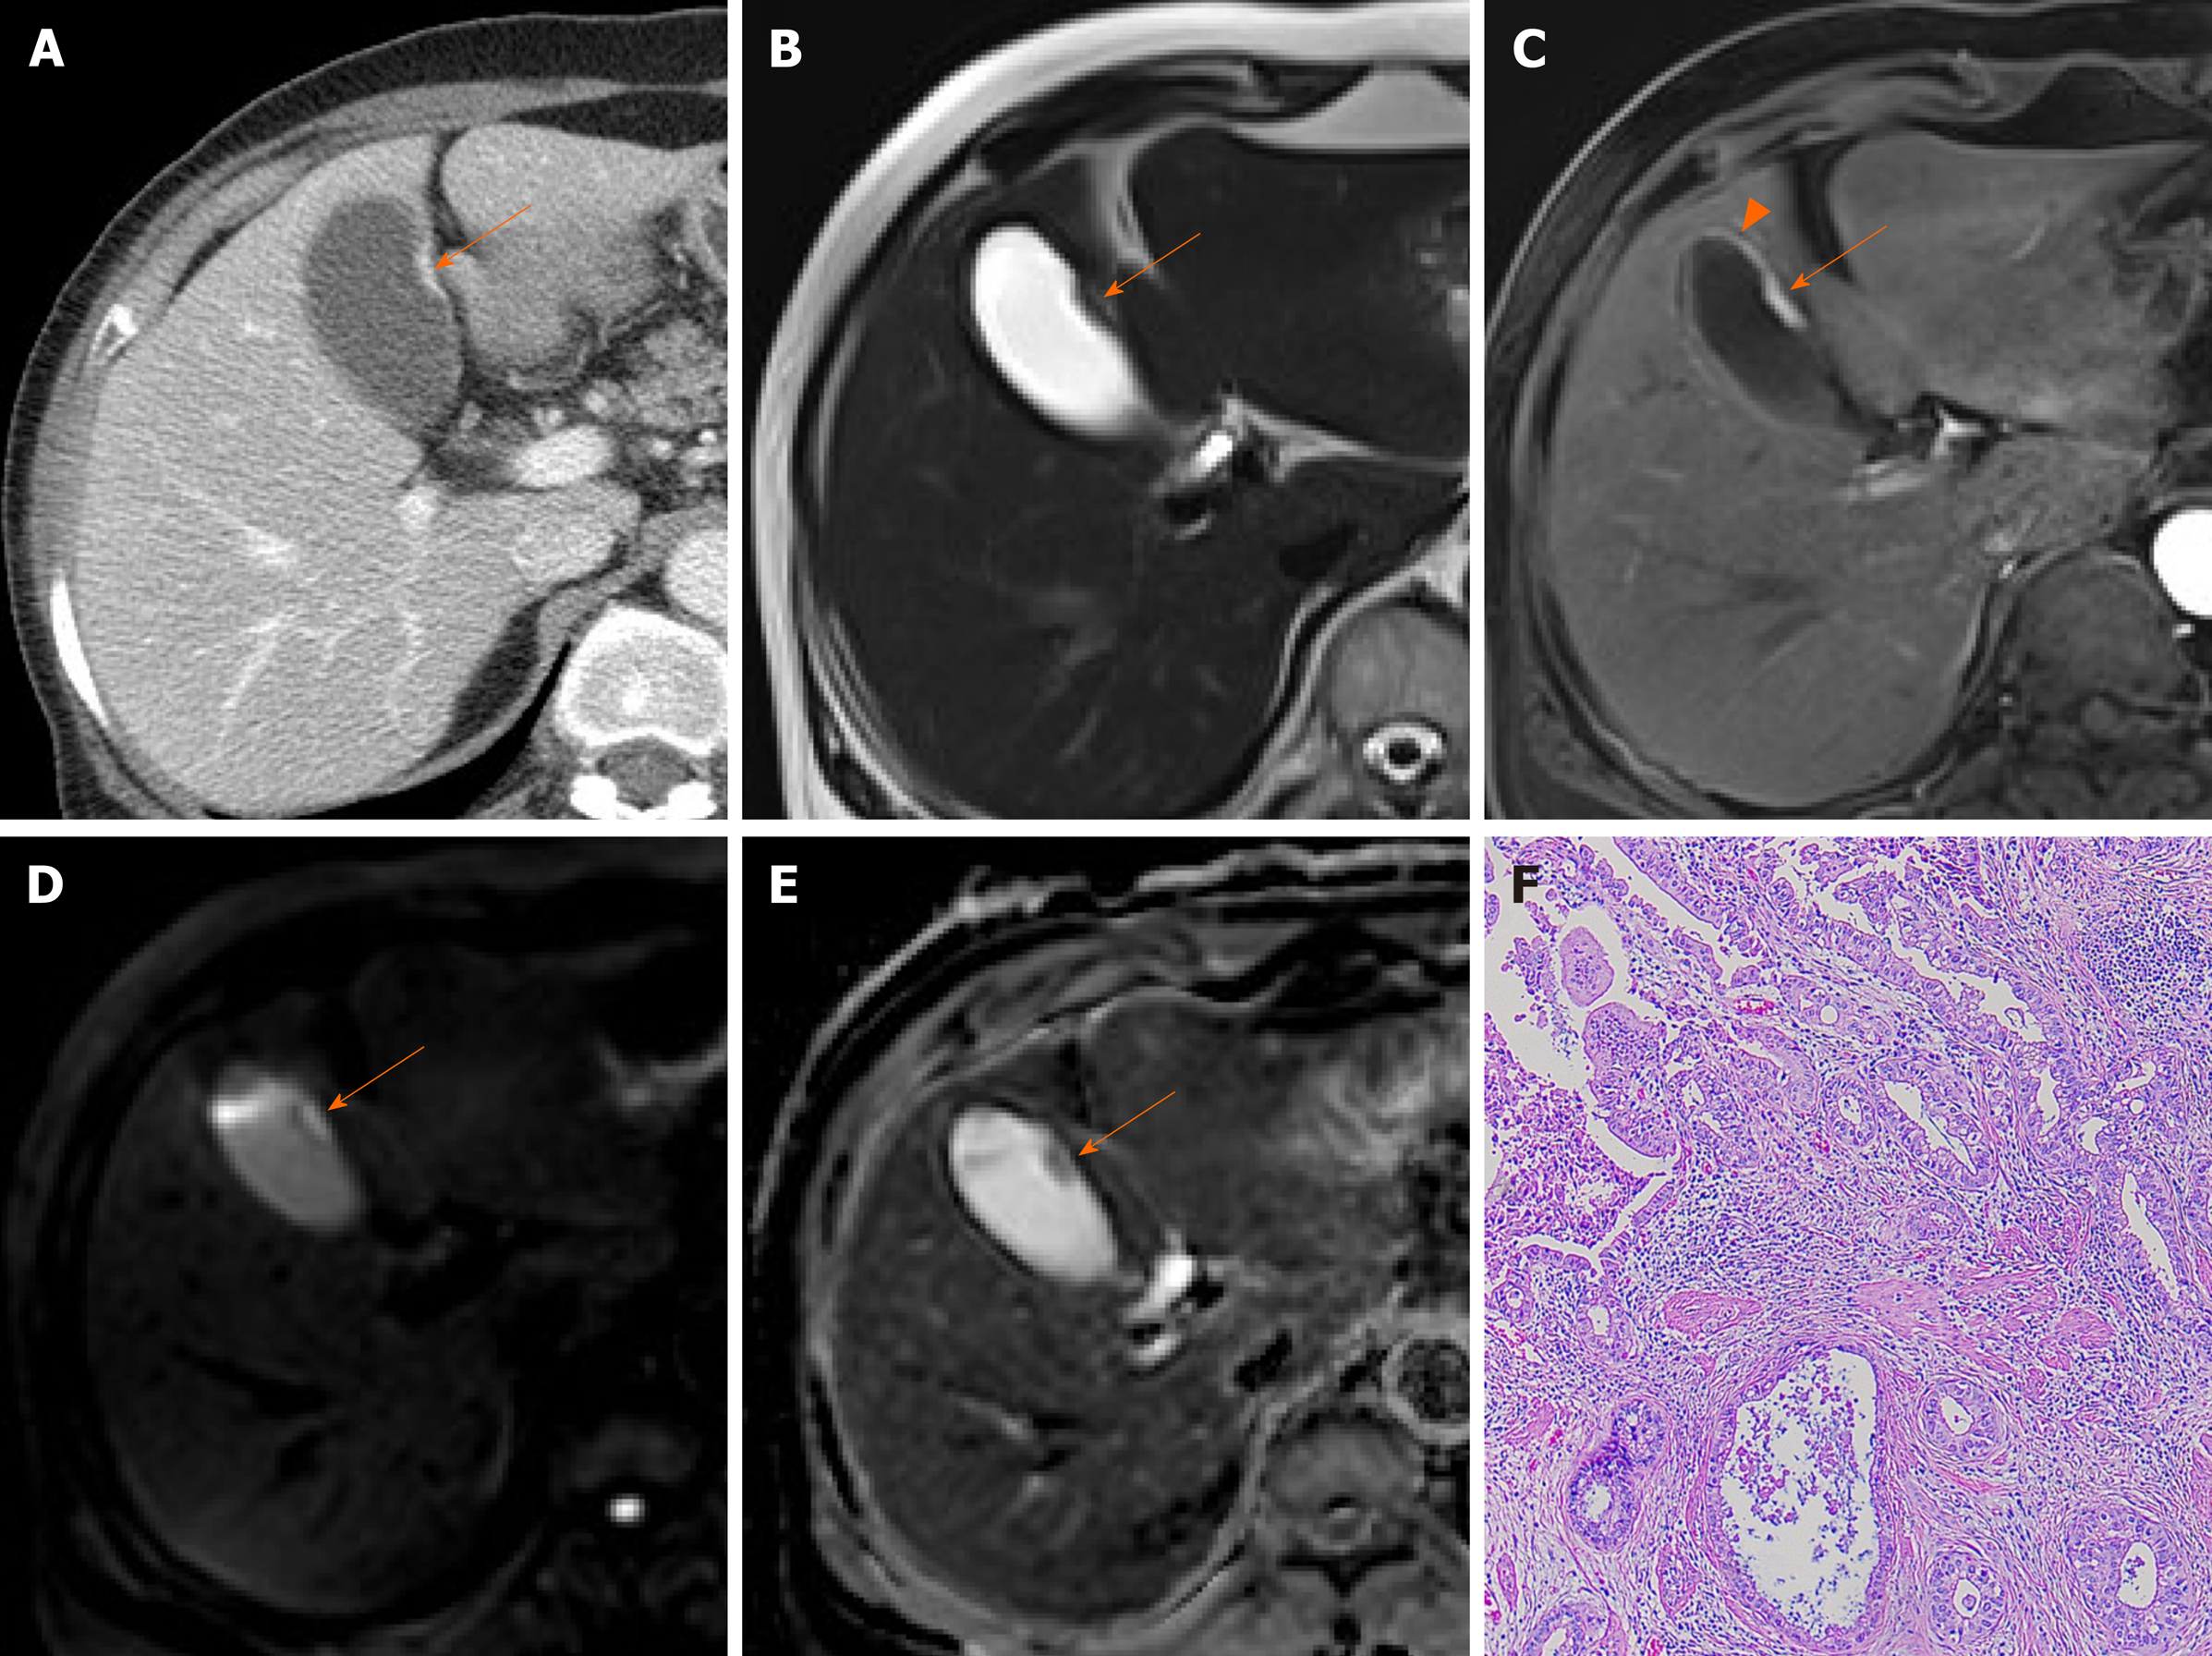
Figure 9 Cancer of gallbladder body.
A: Flat, thickened wall (arrow) with single enhancing layer of gallbladder body on computed tomography; B: No observable intramural cysts on T2-weighted image; C: Strongly enhanced lesion (arterial phase), with mild thickening of adjacent fundal wall (arrowhead) on magnetic resonance imaging; D, E: Obvious diffusion restriction on diffusion-weighted imaging (D) and apparent diffusion coefficient map (E); F: Adenocarcinoma confirmed on hematoxylin and eosin staining (×100) after cholecystectomy.
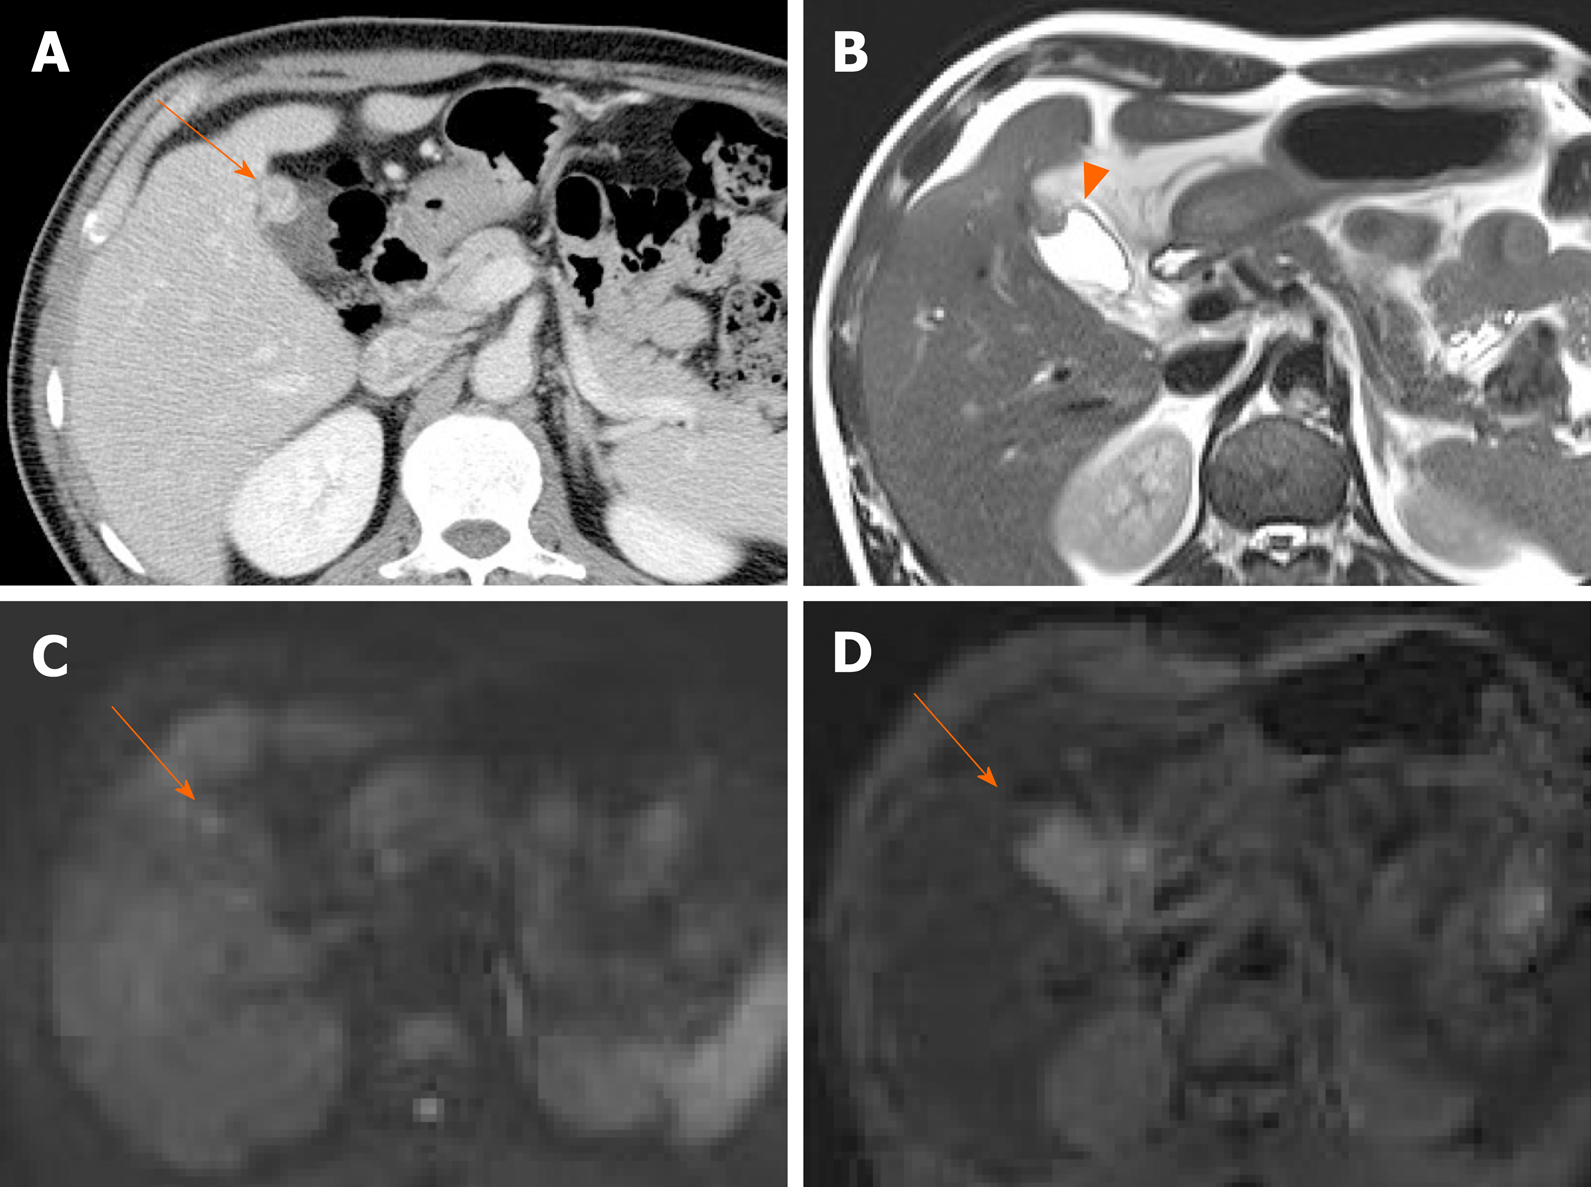
Figure 10 Fundal adenomyomatosis.
A: Oval-shaped enhanced wall thickening (arrow) of gallbladder fundus on computed tomography; B: “Pearl necklace sign” unclear but suspicious intralesional hyperintensity (arrowhead) noted on T2-weighted image; C, D: No apparent diffusion restriction (arrow) on diffusion-weighted imaging (C) or apparent diffusion coefficient map (D) (diagnosed as adenomyomatosis after cholecystectomy).
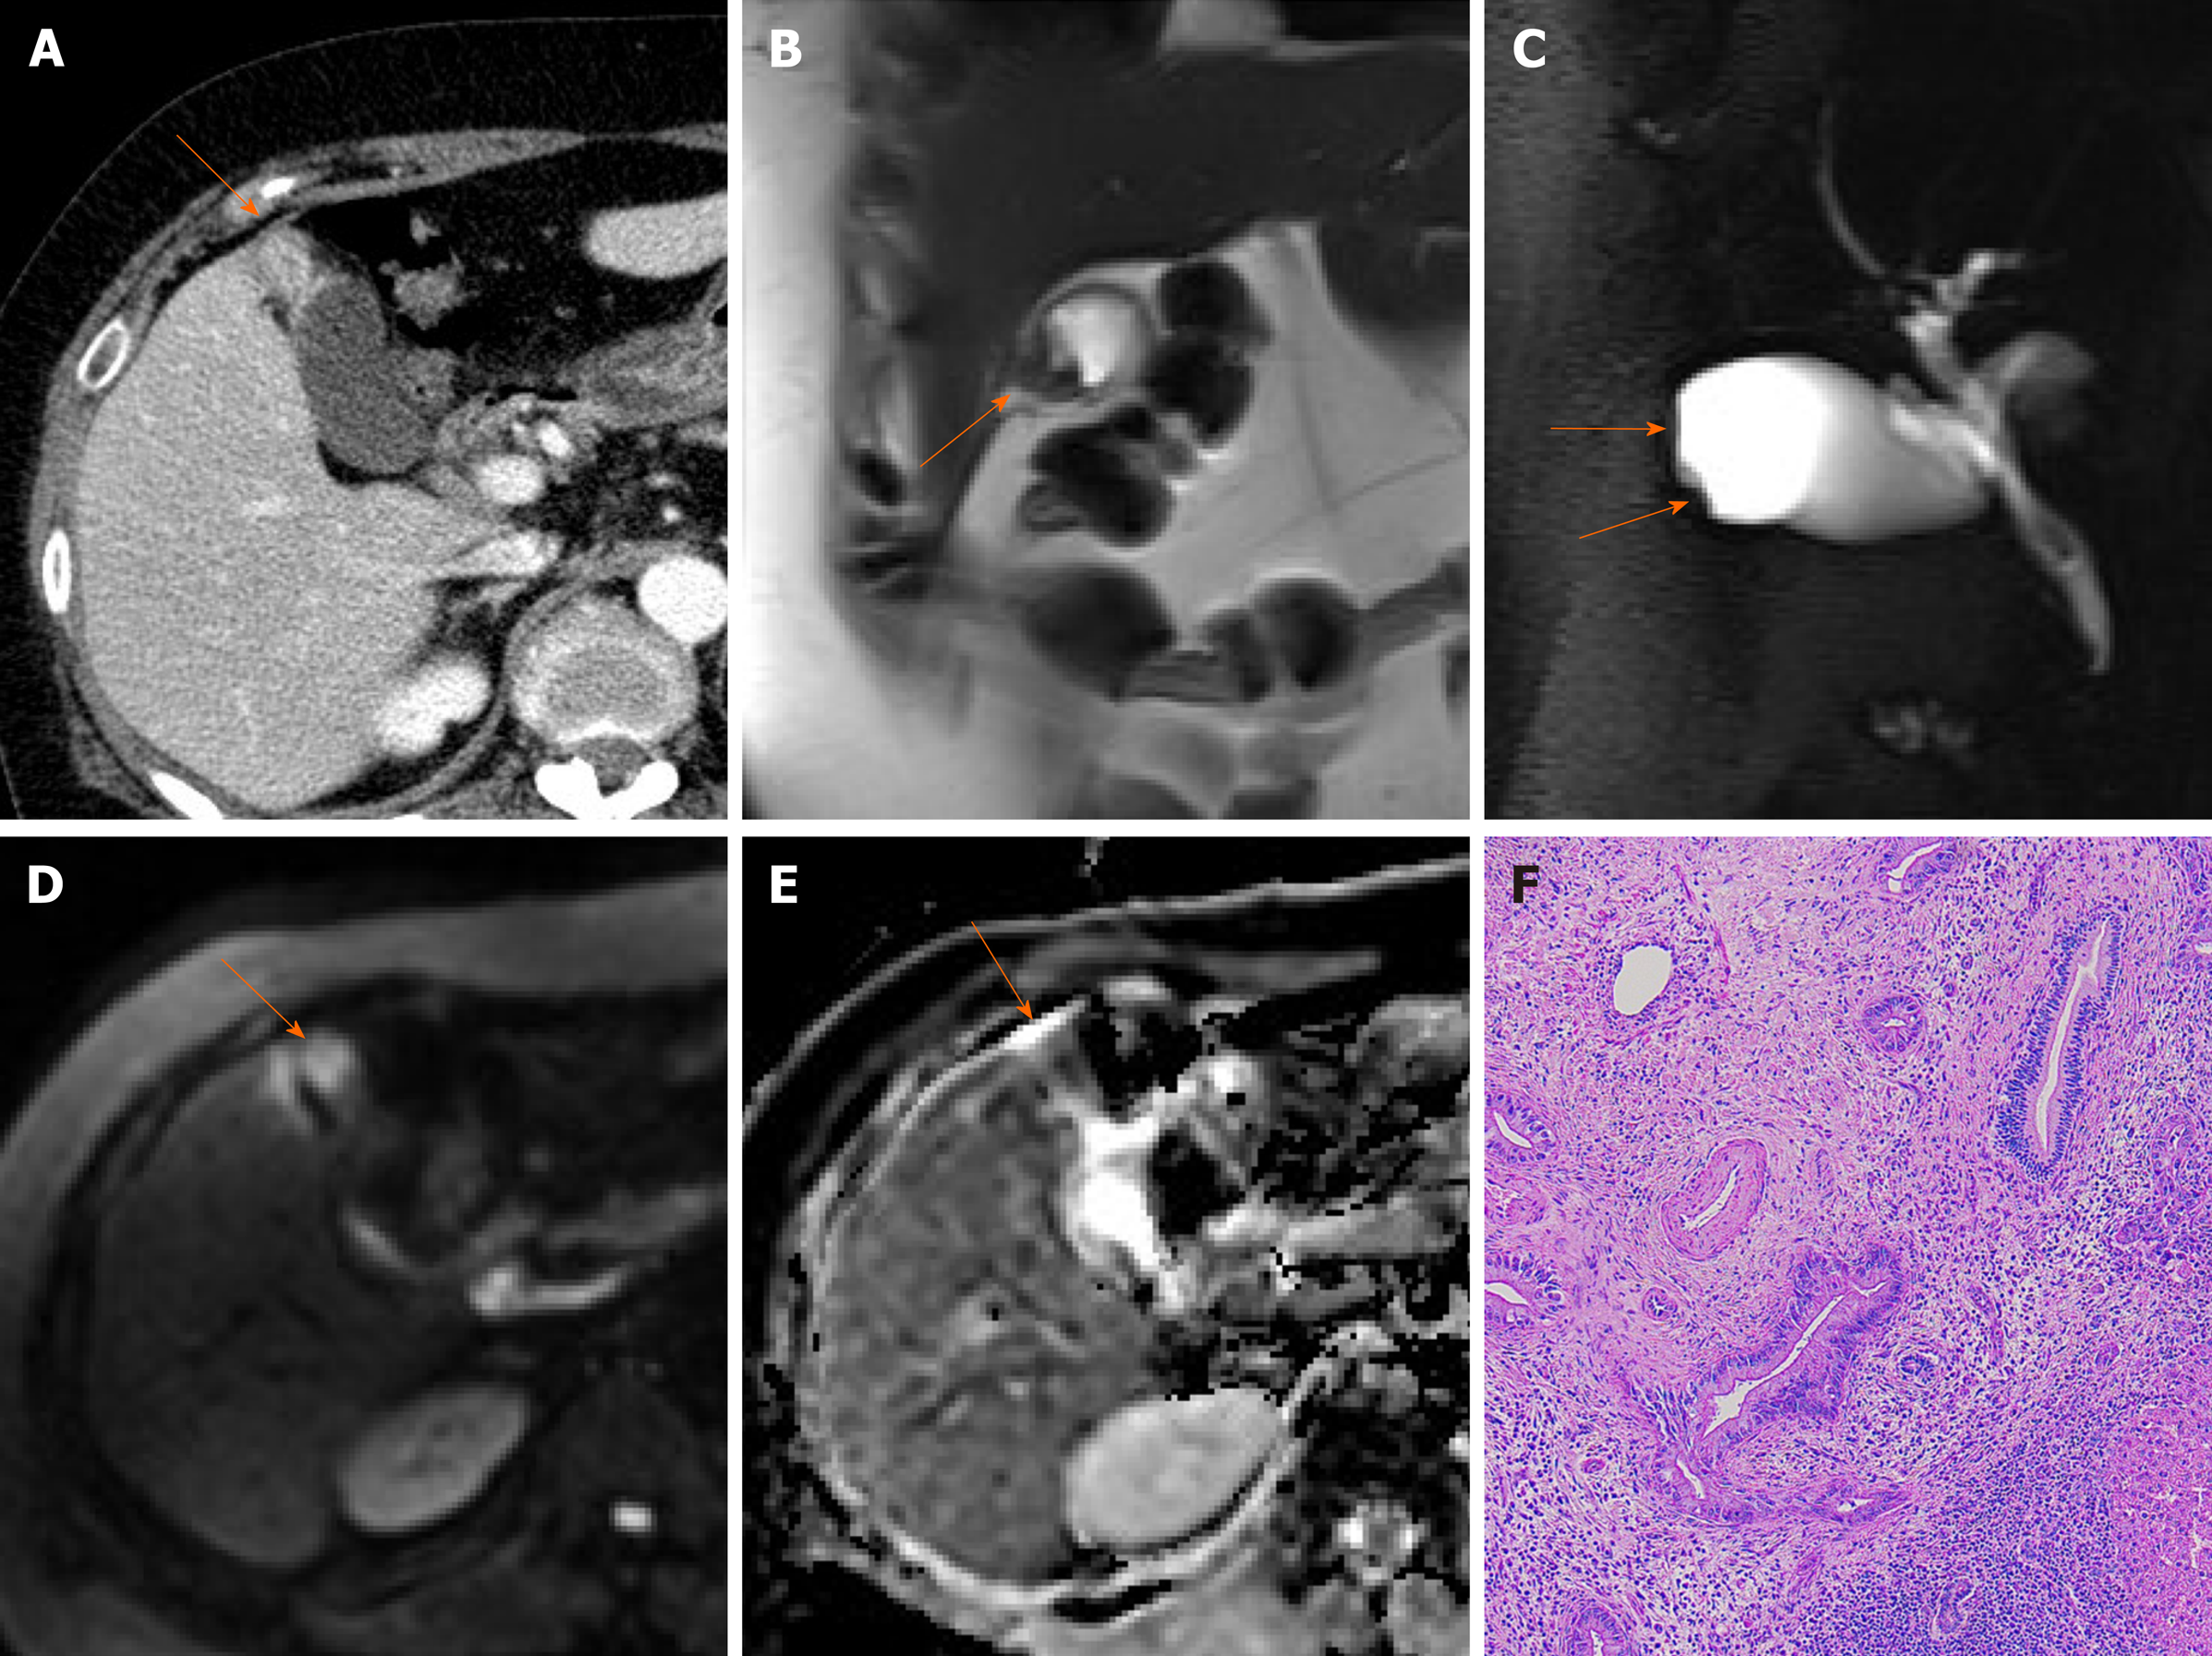
Figure 11 Fundal gallbladder cancer.
A: Segmental mass-like enhanced wall thickening (arrow) of gallbladder fundus on computed tomography; B, C: Intralesional cystic area absent at fundal wall thickening (arrows) on T2-weighted image (B) and magnetic resonance cholangiopancreatography (C); D, E: Mass-like fundal thickening (arrow) showing strong diffusion restriction on diffusion-weighted imaging (D) and apparent diffusion coefficient map (E); F: Adenocarcinoma confirmed on hematoxylin and eosin staining (×100) after cholecystectomy.
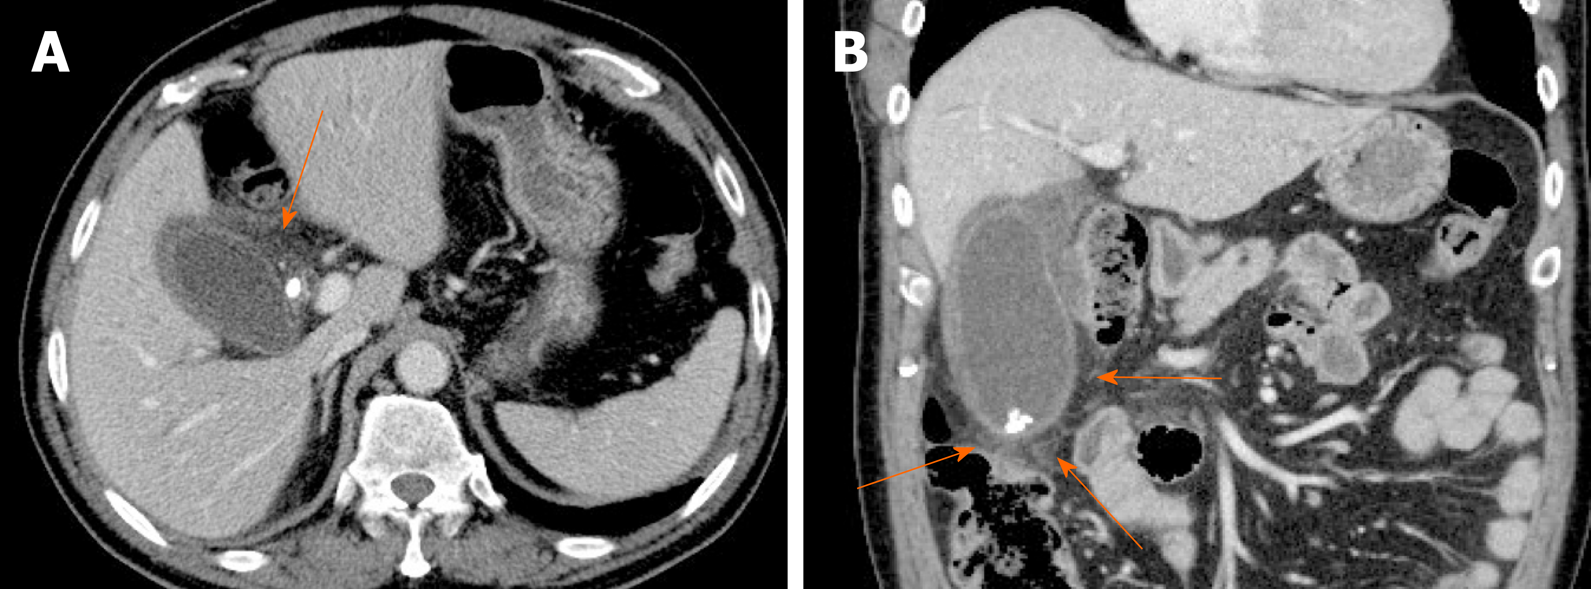
Figure 12 Acute cholecystitis.
A, B: Axial (A) and coronal (B) computed tomography scans of gallbladder showing tensile distension, diffuse mural thickening/edema, and pericholecystic fat stranding (arrows); impacted stone of cystic duct and gallstones present.
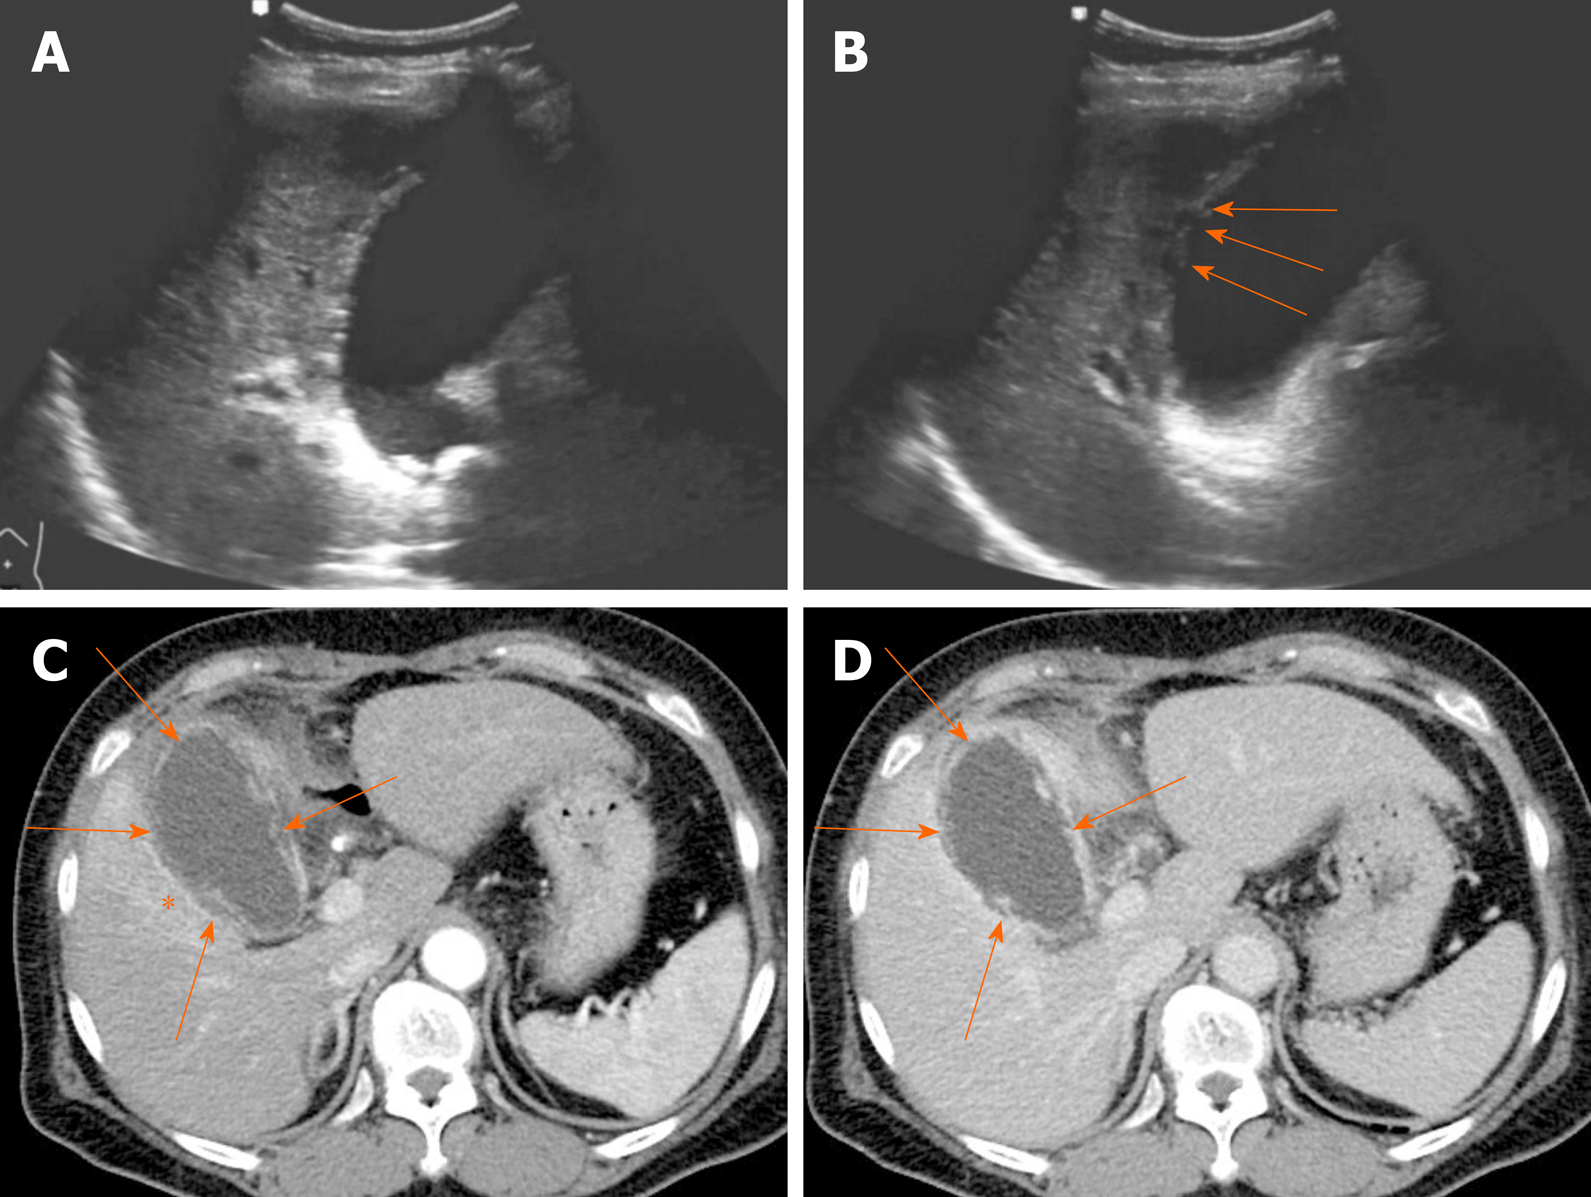
Figure 13 Gangrenous cholecystitis.
A, B: Gallbladder distension, gallstones showing posterior acoustic shadowing at the neck, and irregular mucosa detachment (arrows) on ultrasound; C, D: Arterial and portal phase computed tomography scans showing tensile gallbladder distension, diffuse mural thickening, pericholecystic fat stranding, and increased arterial enhancement of adjacent hepatic parenchyma (asterisk); irregular or partly absent gallbladder mucosal enhancement (arrows) suggesting gangrenous cholecystitis.
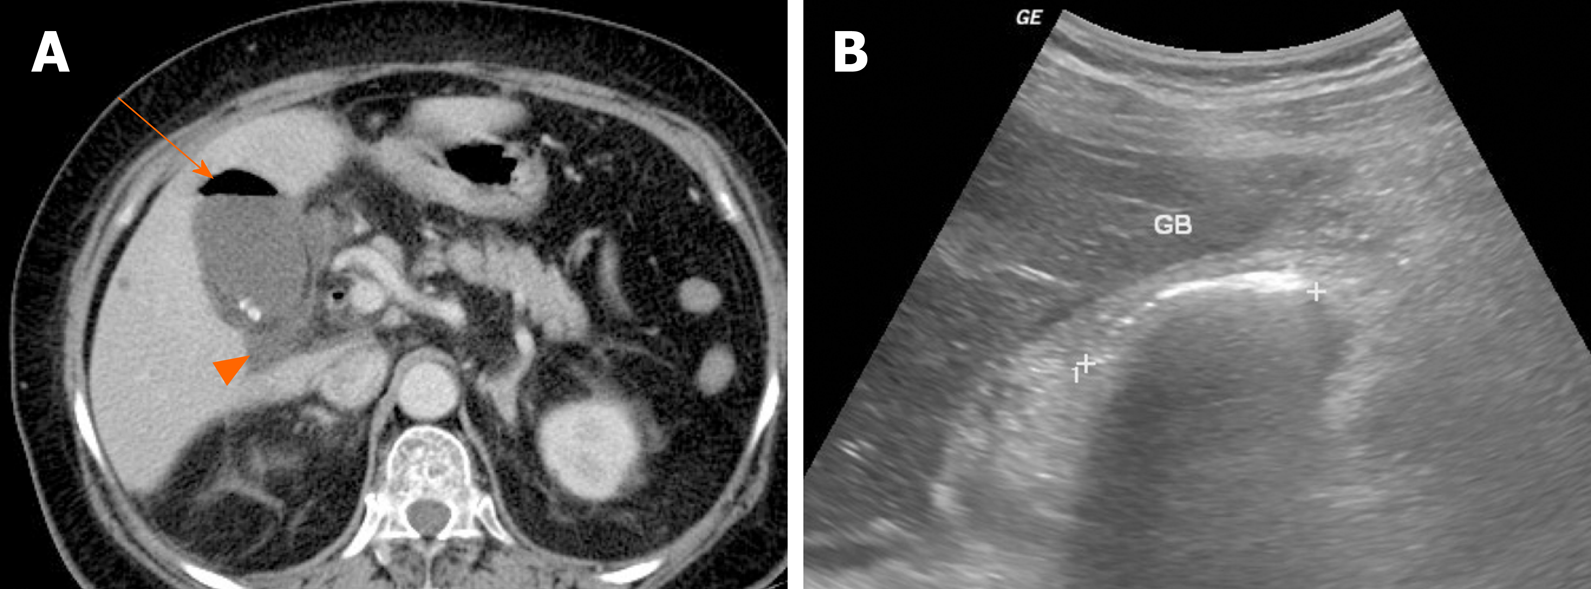
Figure 14 Emphysematous cholecystitis.
A: Readily identifiable intraluminal air (arrow) in gallbladder on computed tomography; small gallstones and pericholecystic fluid (arrowhead) present; B: Curvilinear echogenic line at gallbladder fossa, with posterior acoustic shadowing on ultrasound. GB: Gallbladder.
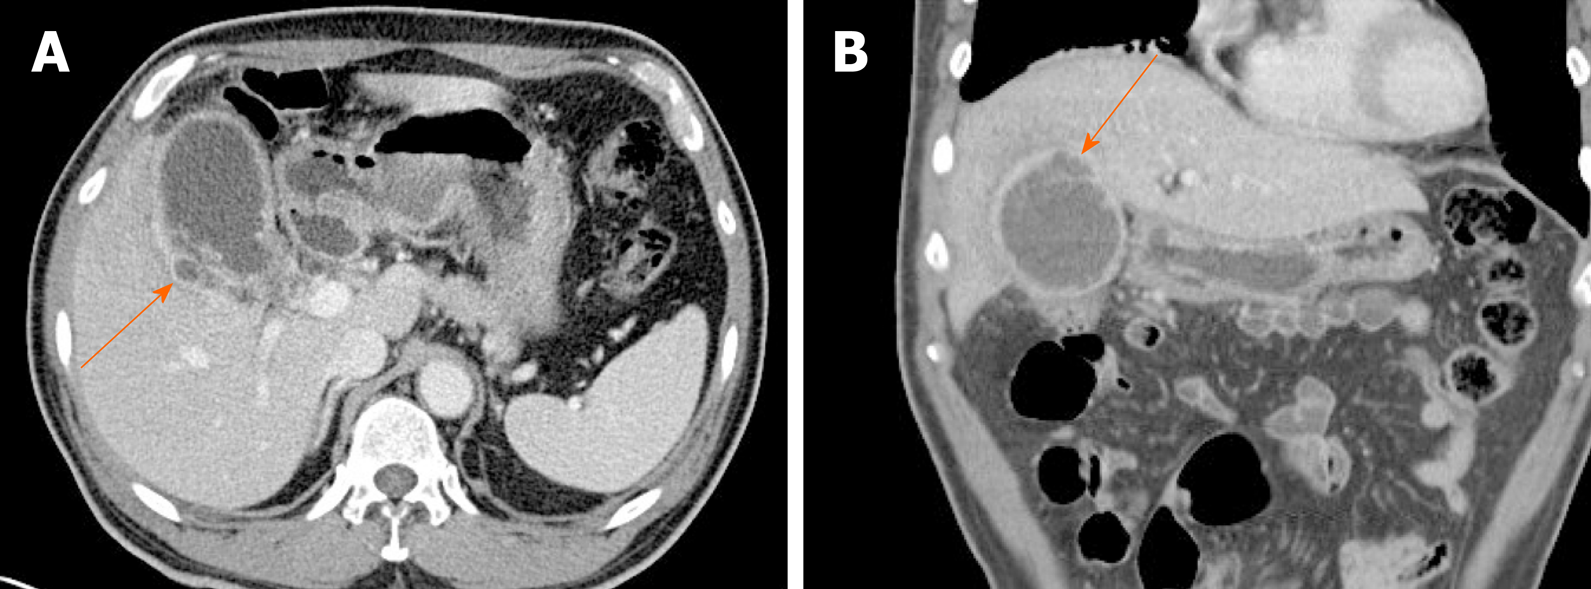
Figure 15 Gallbladder perforation.
A, B: Axial (A) and coronal (B) computed tomography scans of distended gallbladder showing diffuse, enhanced wall thickening, pericholecystic fat stranding, and irregular mucosal enhancement of acute gangrenous cholecystitis; a small rim-enhancing cystic protuberance (arrows) of nearby liver, connected to gallbladder, suggesting pericholecystic abscess due to perforation.
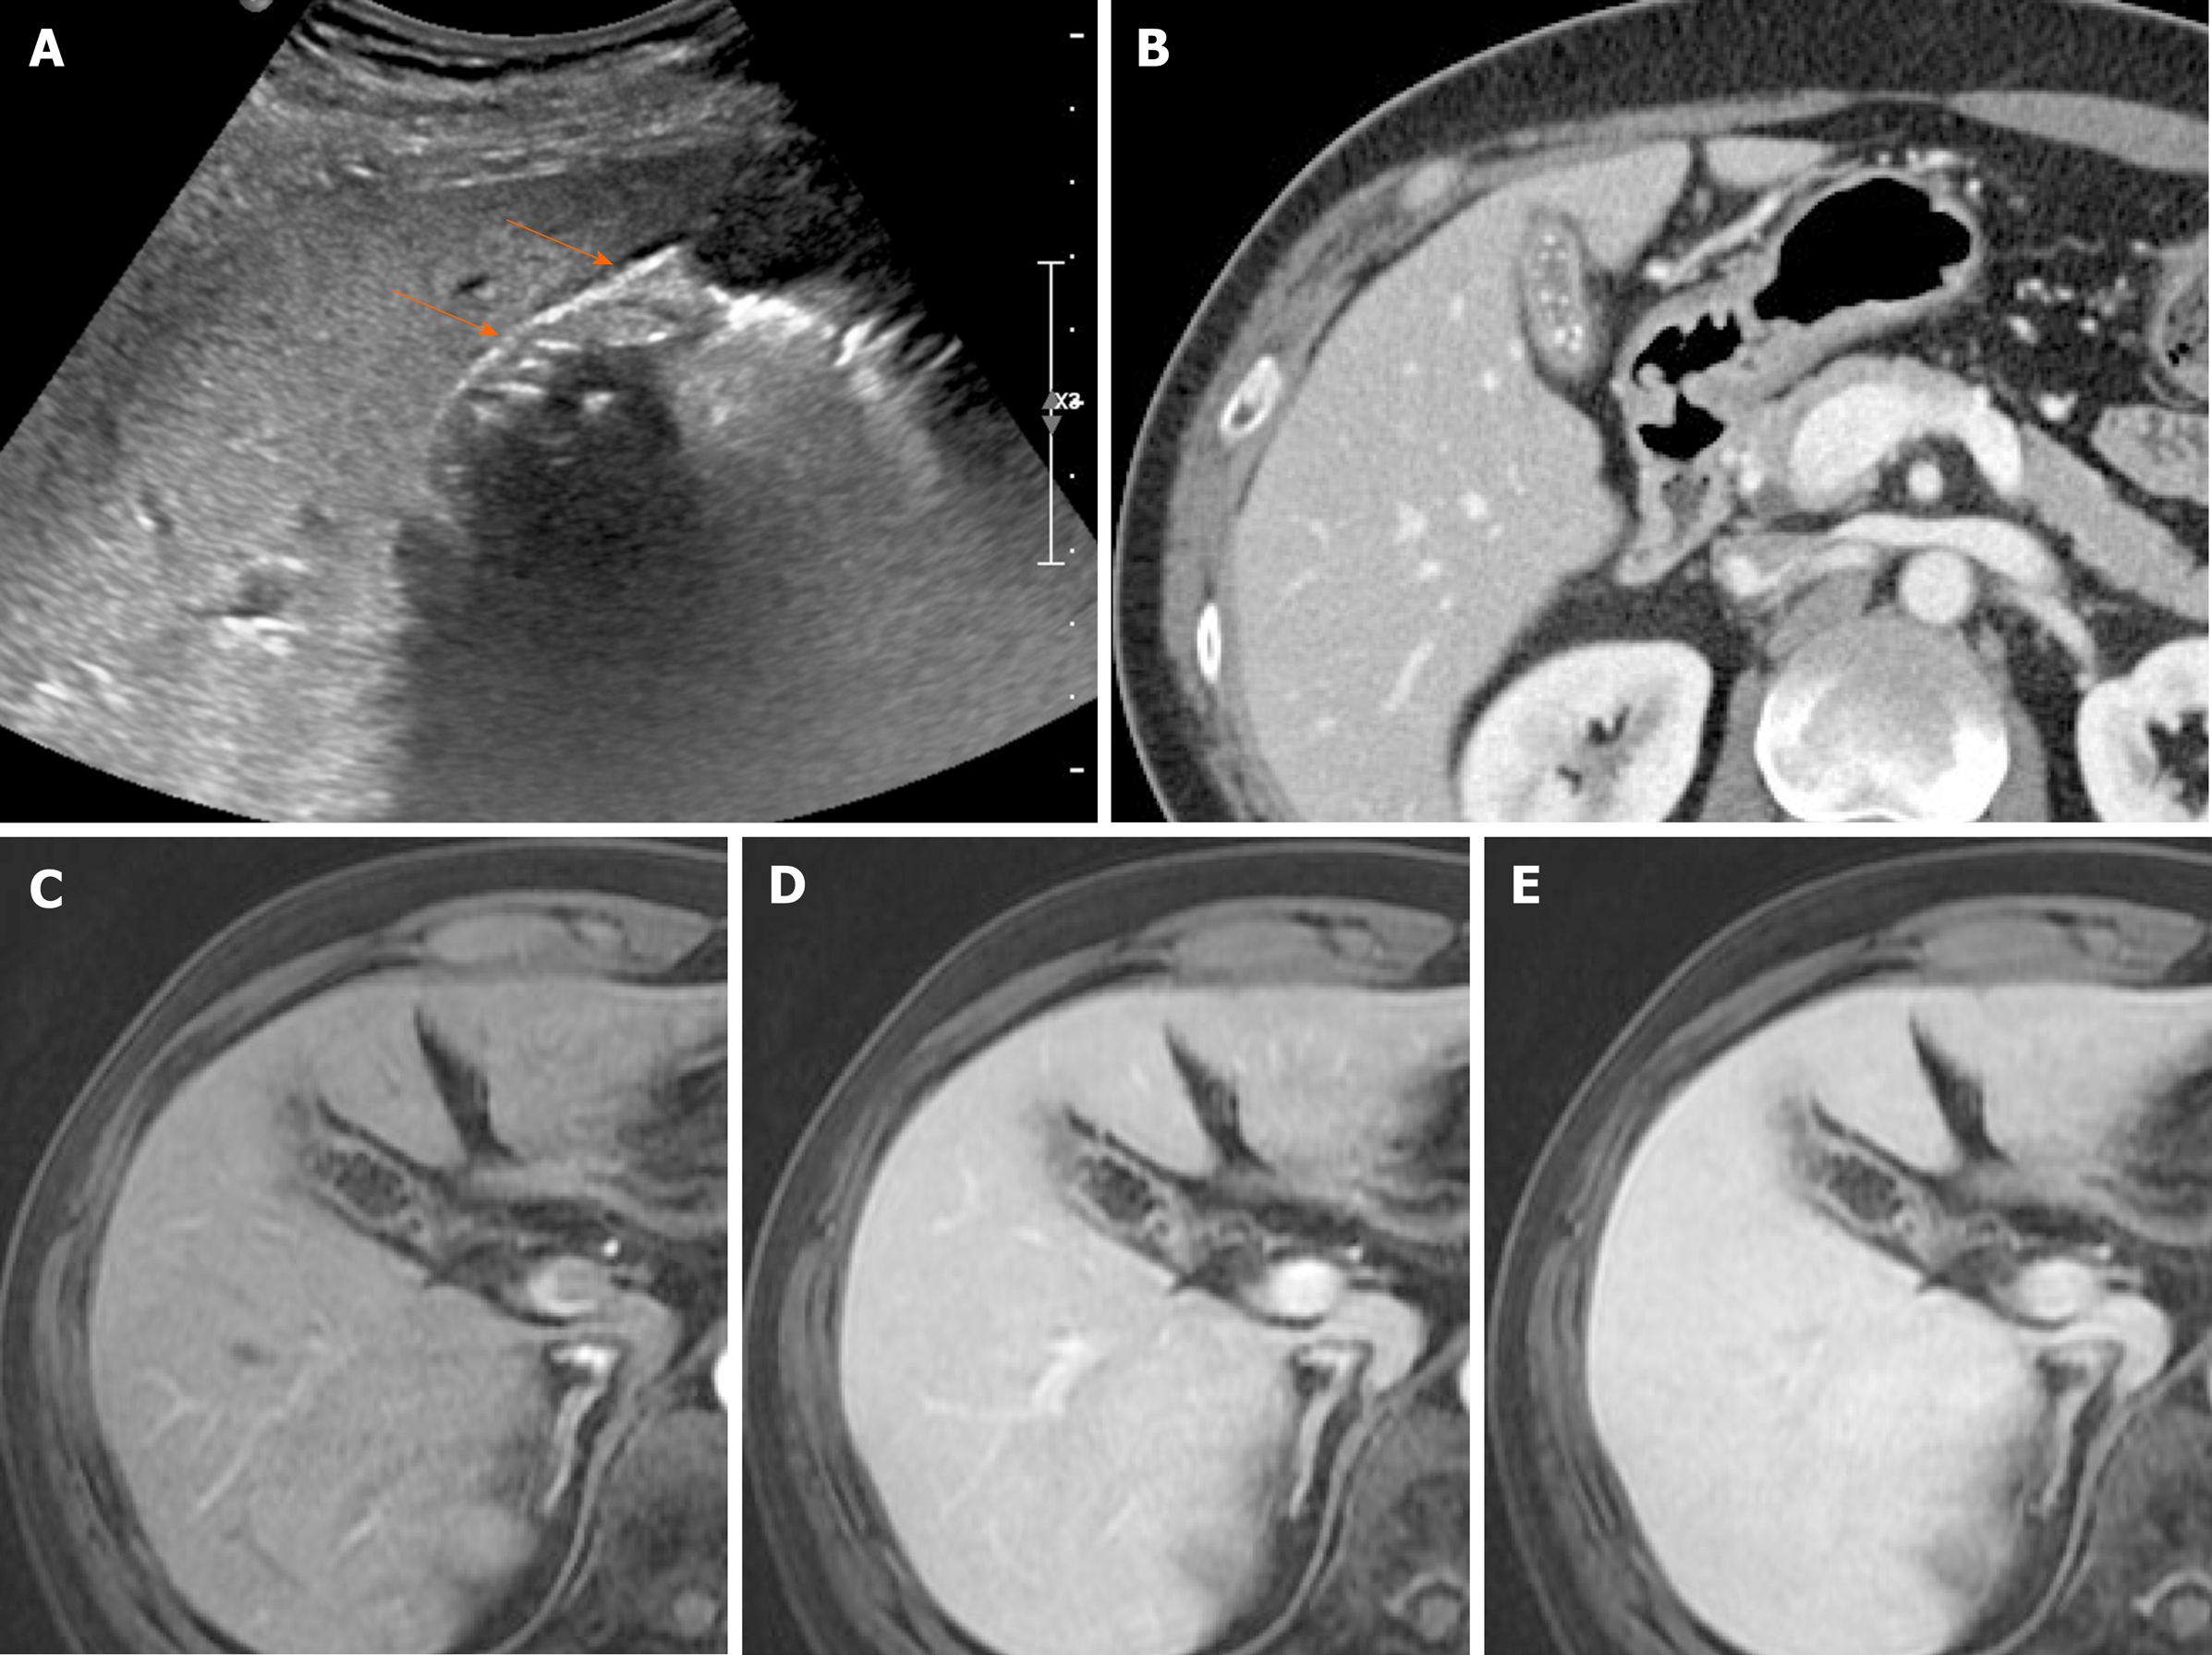
Figure 16 Chronic cholecystitis.
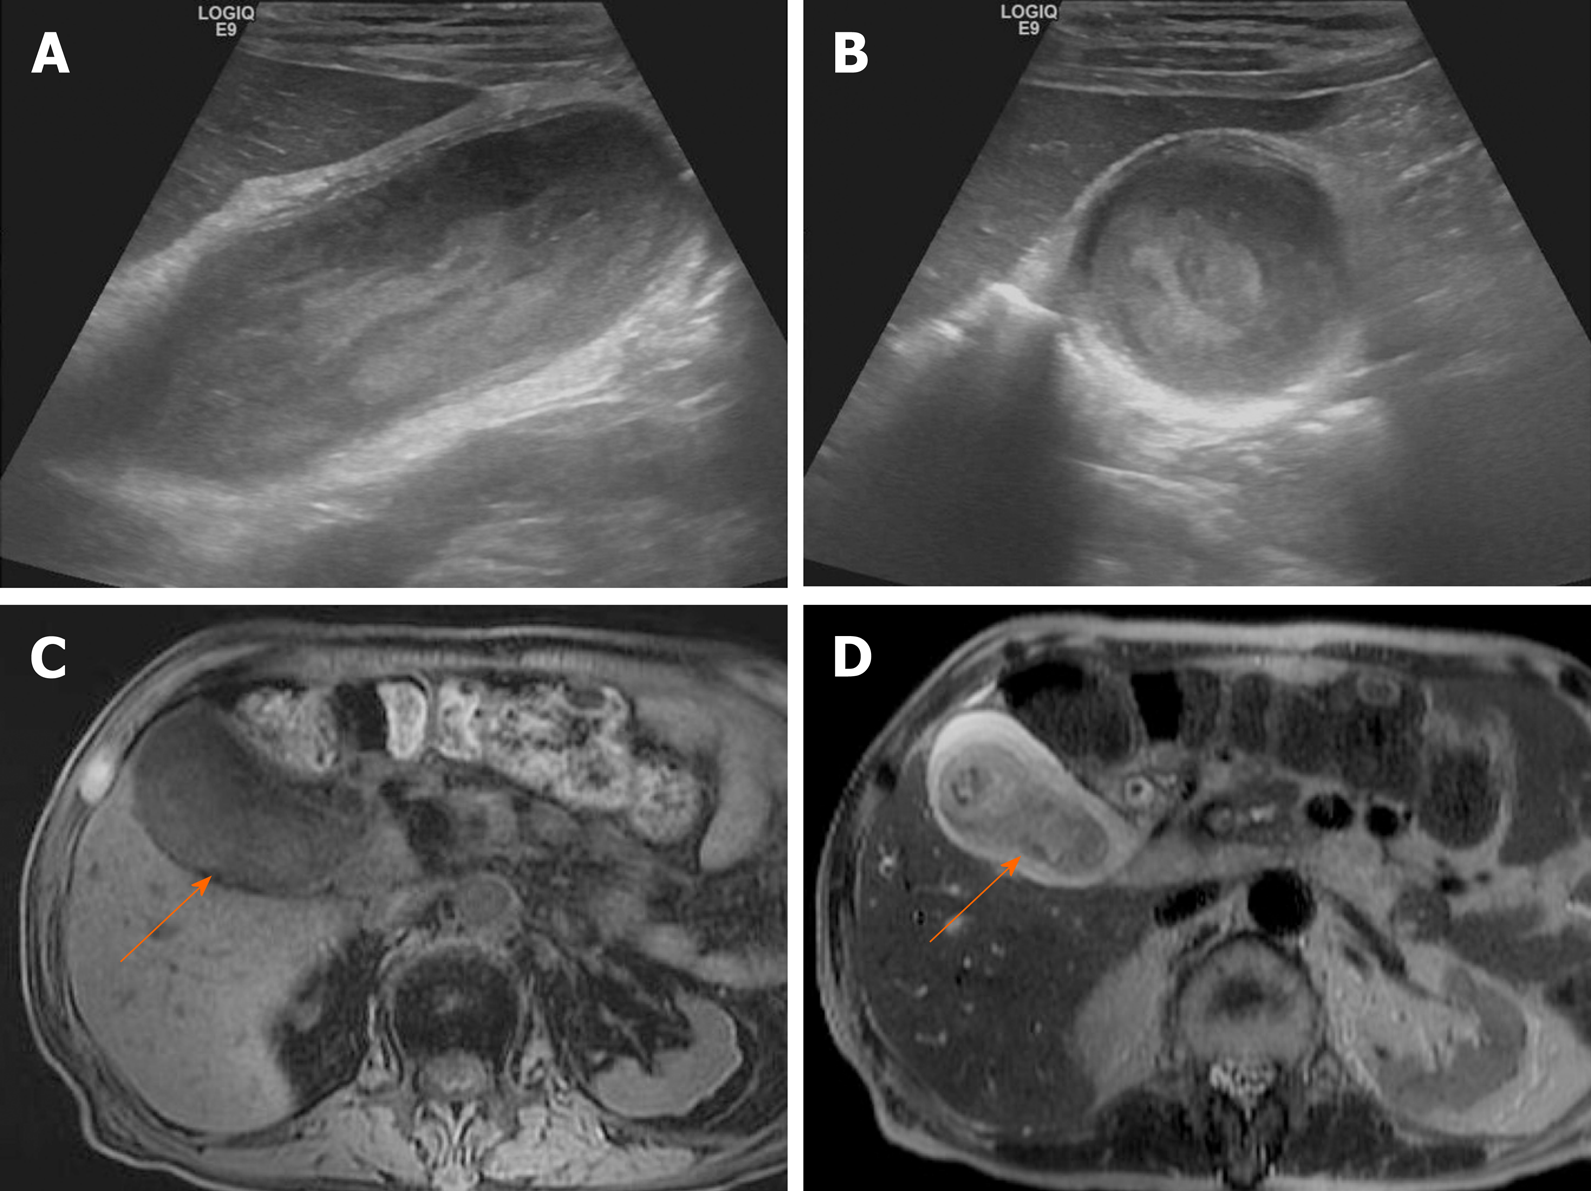
A: Contracted gallbladder filled with multiple echogenic gallstones, showing posterior acoustic shadowing on ultrasound, the two-layered wall (arrows) still preserved; B: Collapsed gallbladder with tiny radiopaque gallstones and diffusely thickened wall, marked by weakly enhancing inner layer with fuzzy margins and thin hypodense outer layer on computed tomography; C-E: Smooth, slow, and prolonged enhancement of gallbladder wall during dynamic-enhanced magnetic resonance imaging.
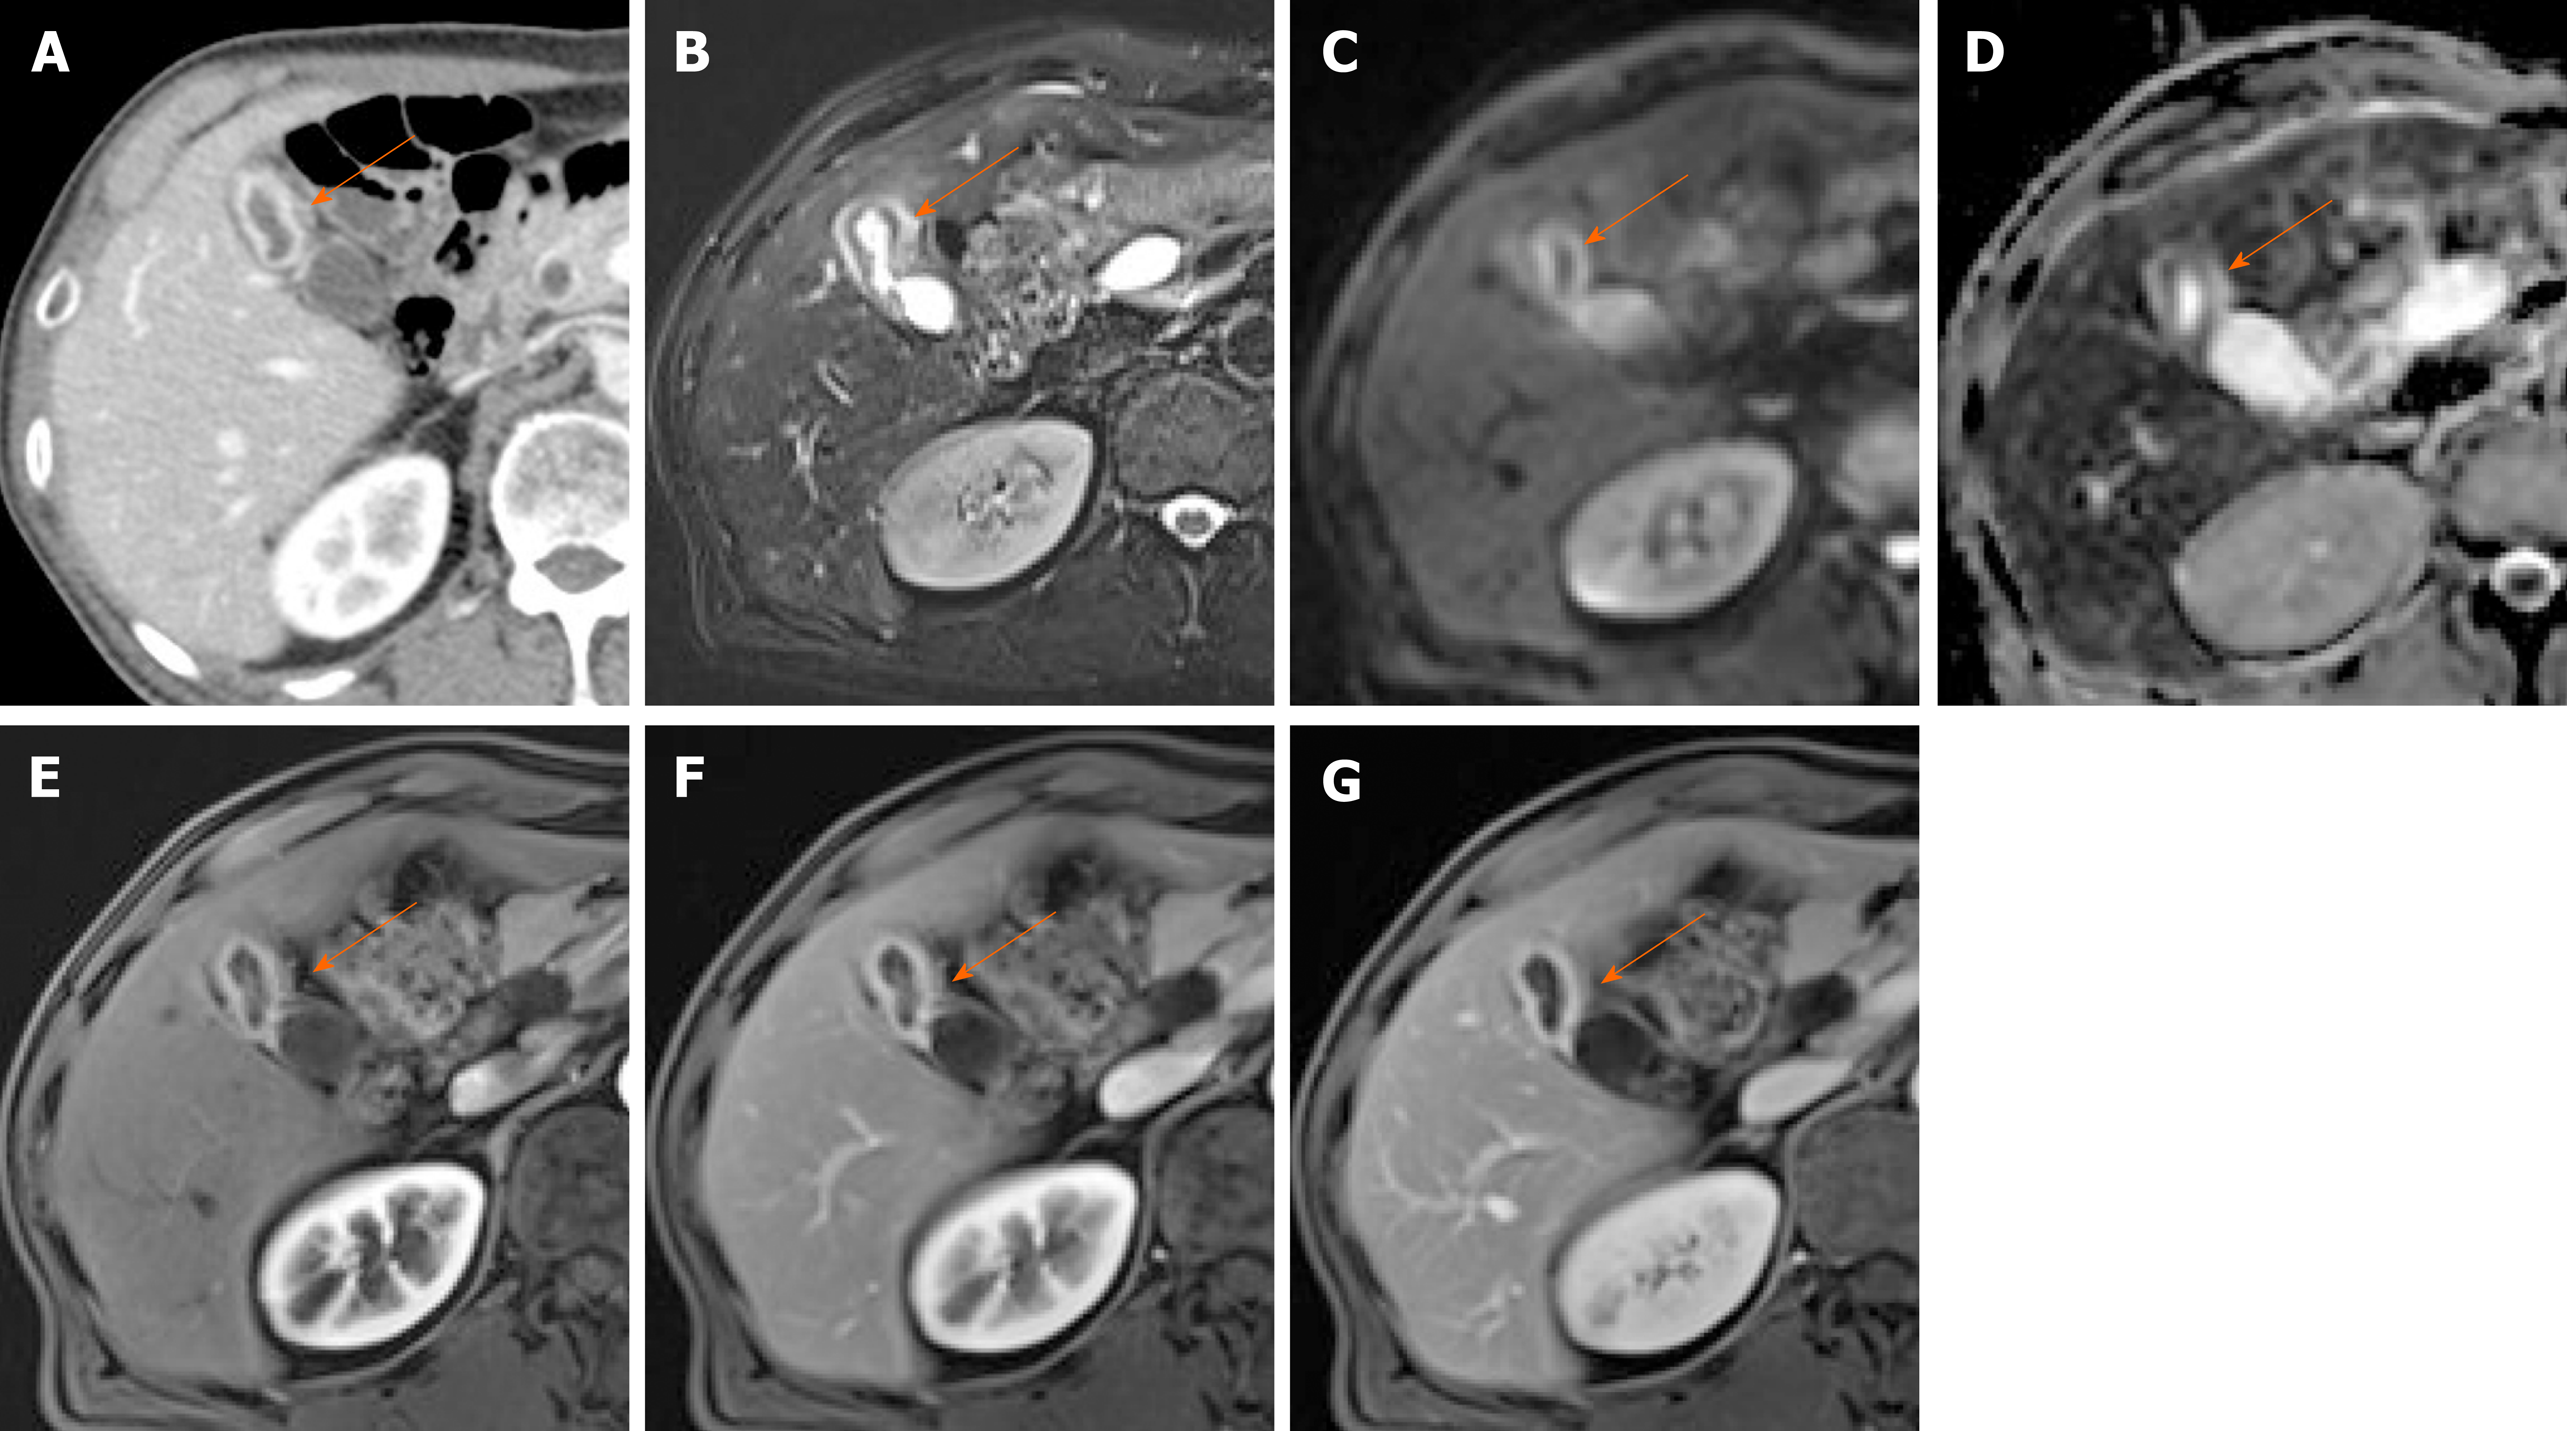
Figure 17 Gallbladder cancer.
A, B: Fundal chamber of bicameral gallbladder, with segmental enhanced wall thickening (arrow) on computed tomography; no observable intramural cysts on T2-weighted image; C, D: Obvious diffusion restriction (arrow) on diffusion-weighted imaging (C) and apparent diffusion coefficient map (D); E-G: Irregular, early, and prolonged strong enhancement (arrow) during dynamic-enhanced magnetic resonance imaging.
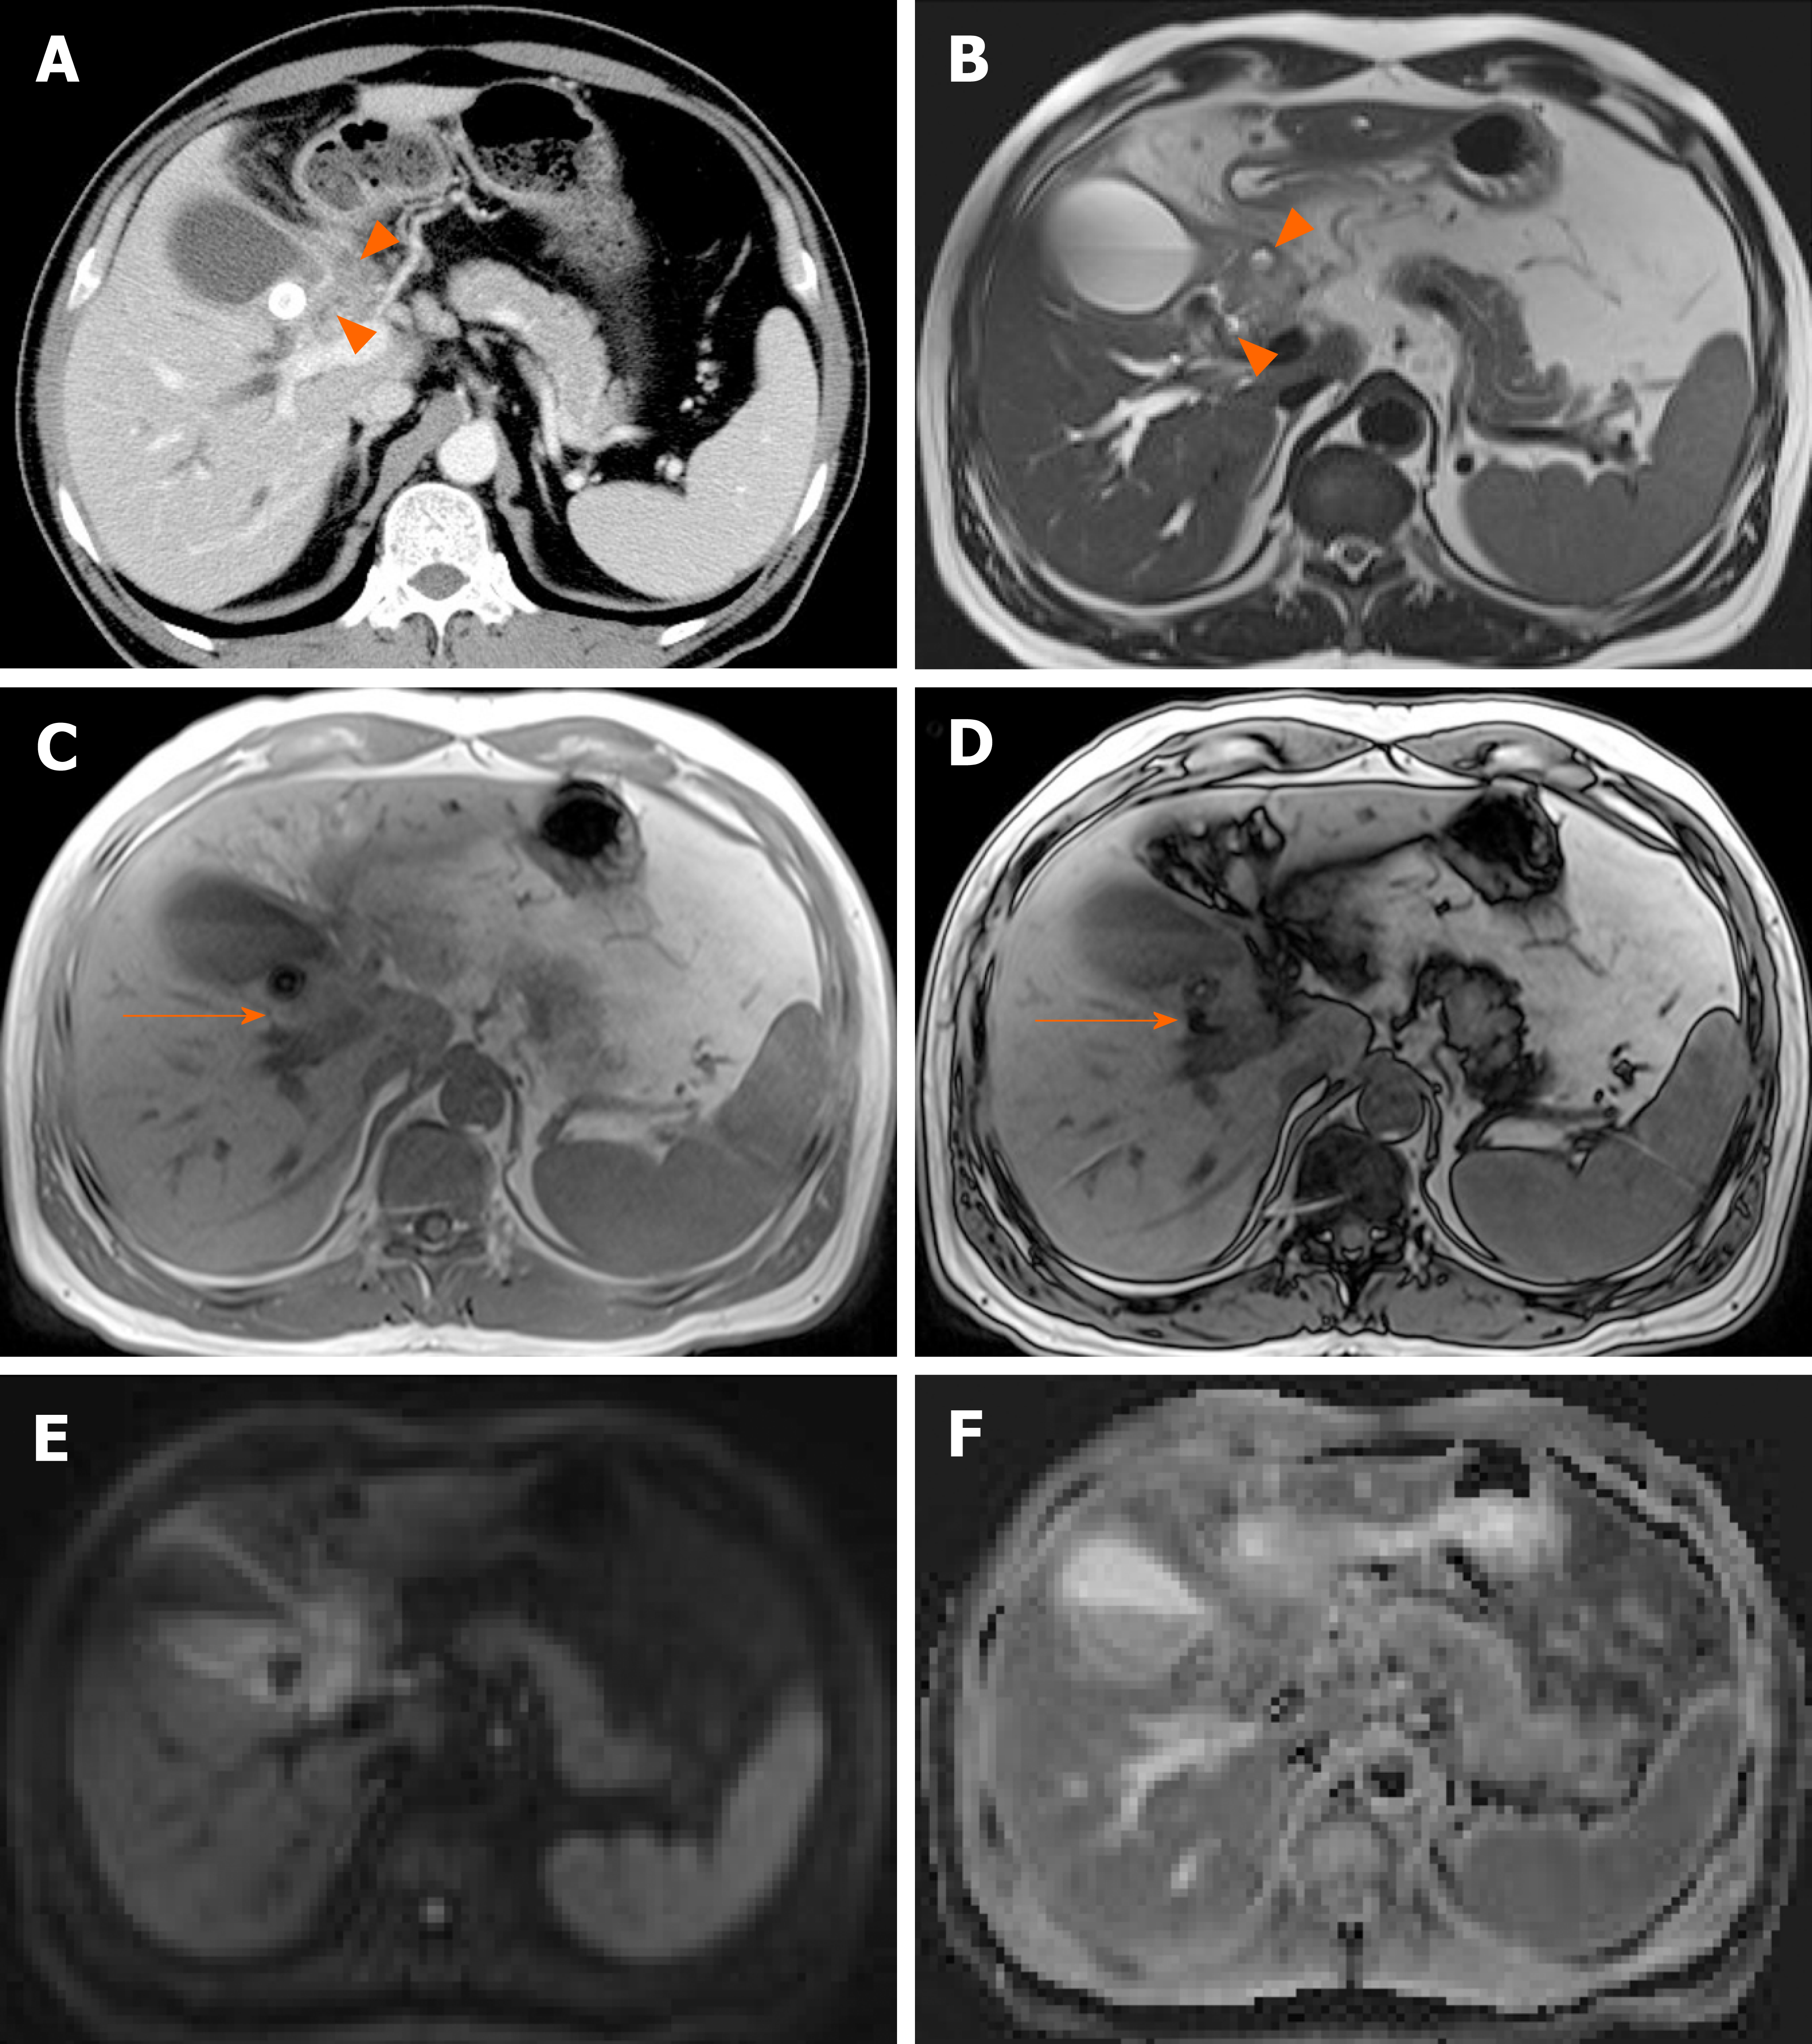
Figure 18 Xanthogranulomatous cholecystitis.
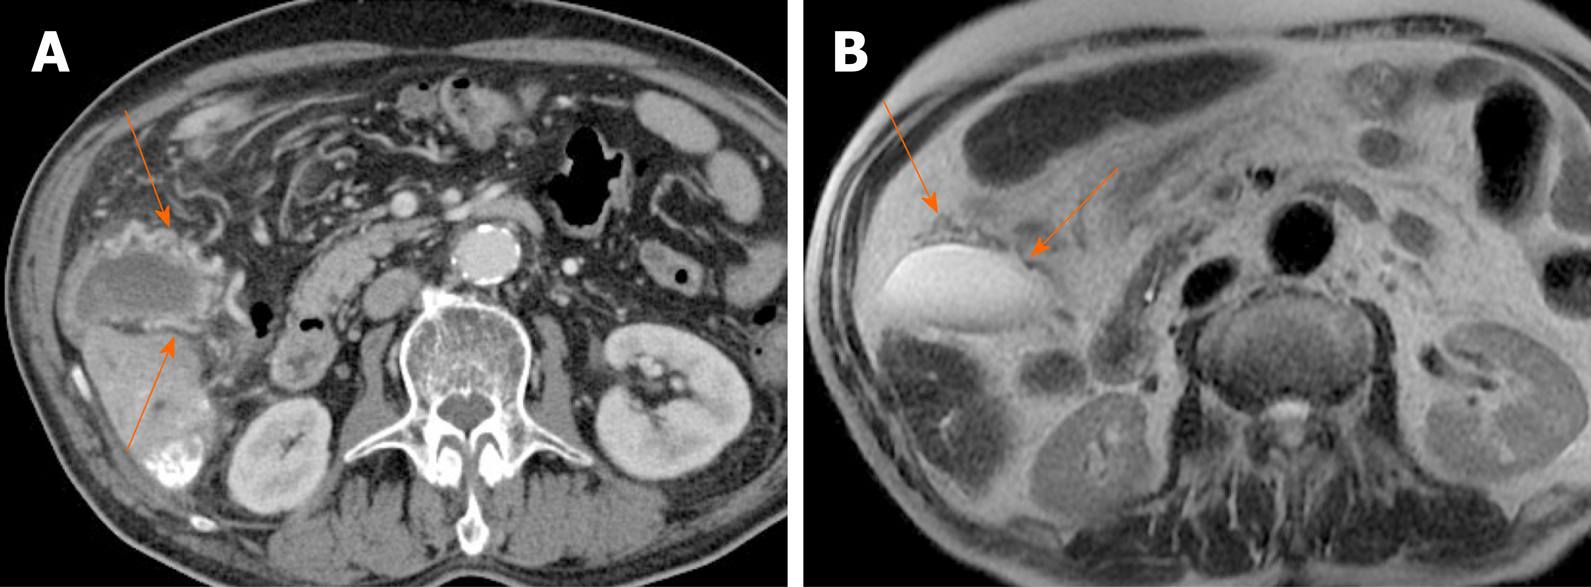
A: Computed tomography scan of distended gallbladder with impacted gallstone at neck, showing segmental wall thickening of neck and proximal body and small hypodense intramural nodules (arrowheads); B: High signal intensity (arrowheads) of such abscesses or xanthogranulomas on T2-weighted image; C and D: Easily identifiable fat (arrow) within thickened wall by in-phase and opposed-phase chemical shift imaging; E and F: Mild diffusion restriction of wall thickening on diffusion-weighted imaging (E) and apparent diffusion coefficient map (F), less obvious than in gallbladder cancer.
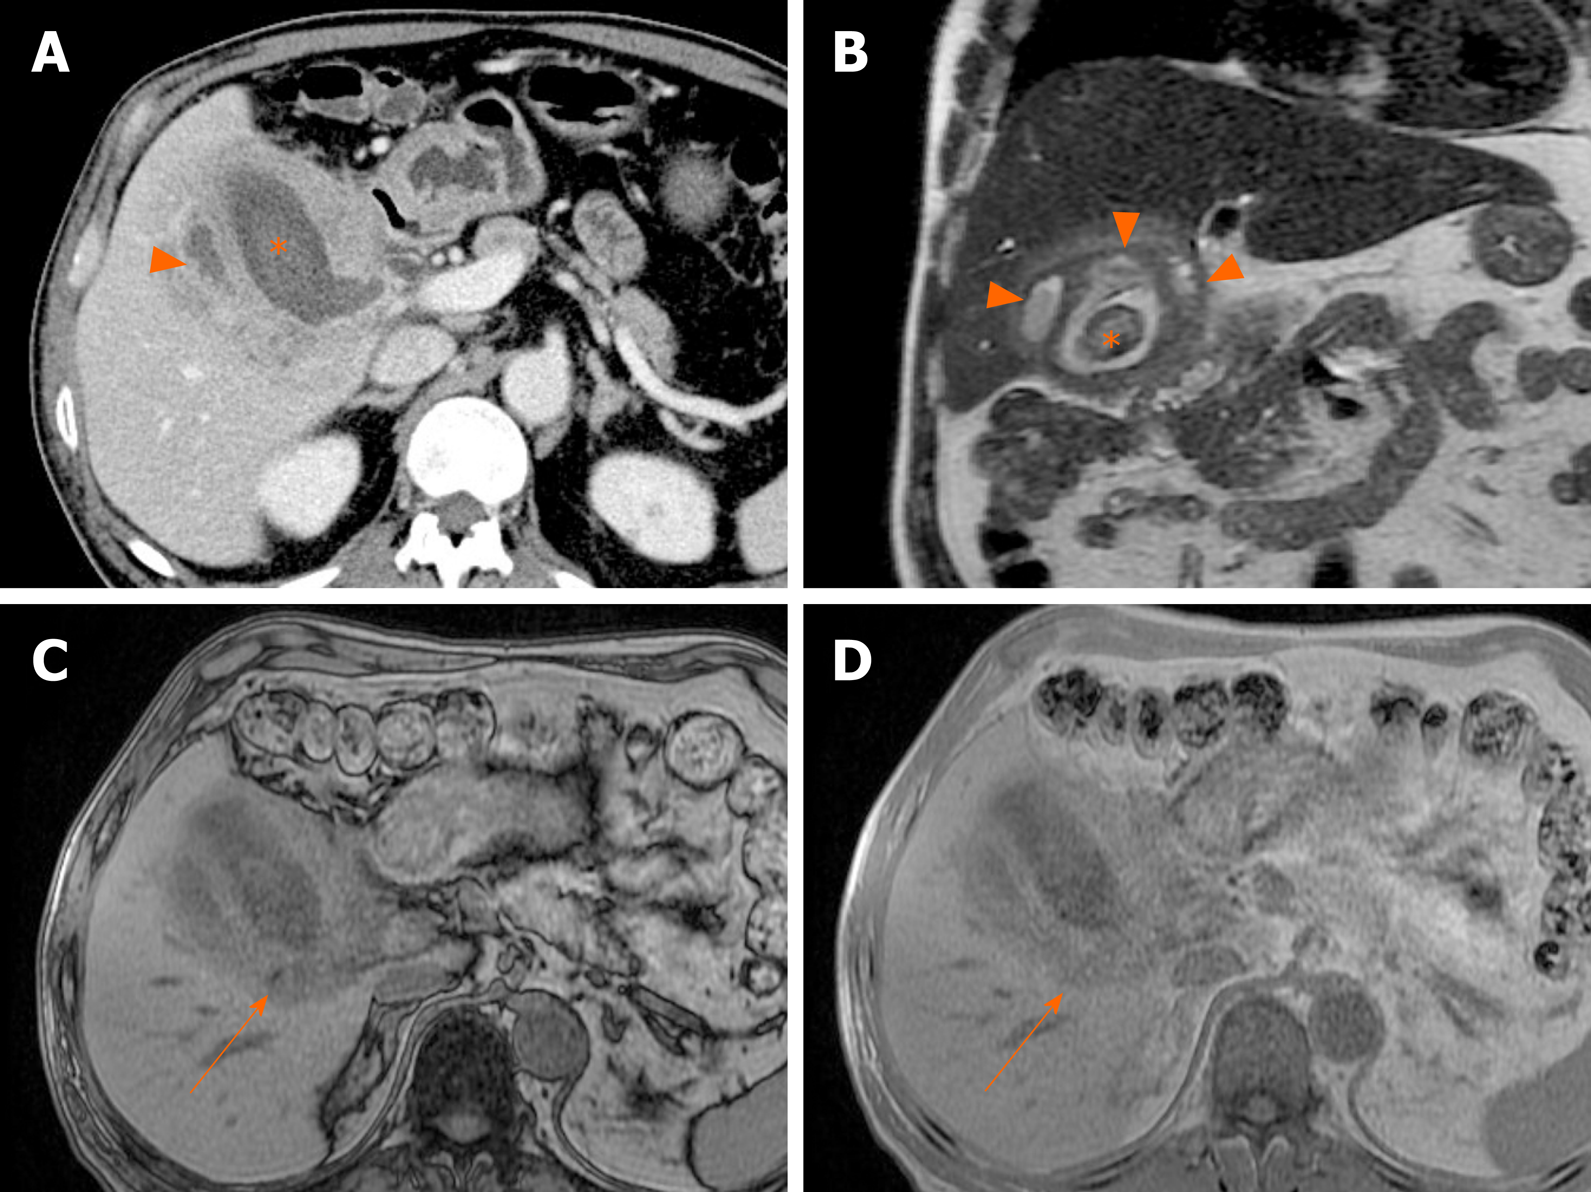
Figure 19 Xanthogranulomatous cholecystitis.
A, B: Diffuse, severe wall thickening, continuous mucosal line, and small gallstone (asterisk) on computed tomography (A) and T2-weighted image (B) of gallbladder, with small intramural abscesses (arrowheads) of thickened wall; C, D: Signal drop in fat component (arrow) on opposed-phase (C) rather than in-phase (D) imaging.
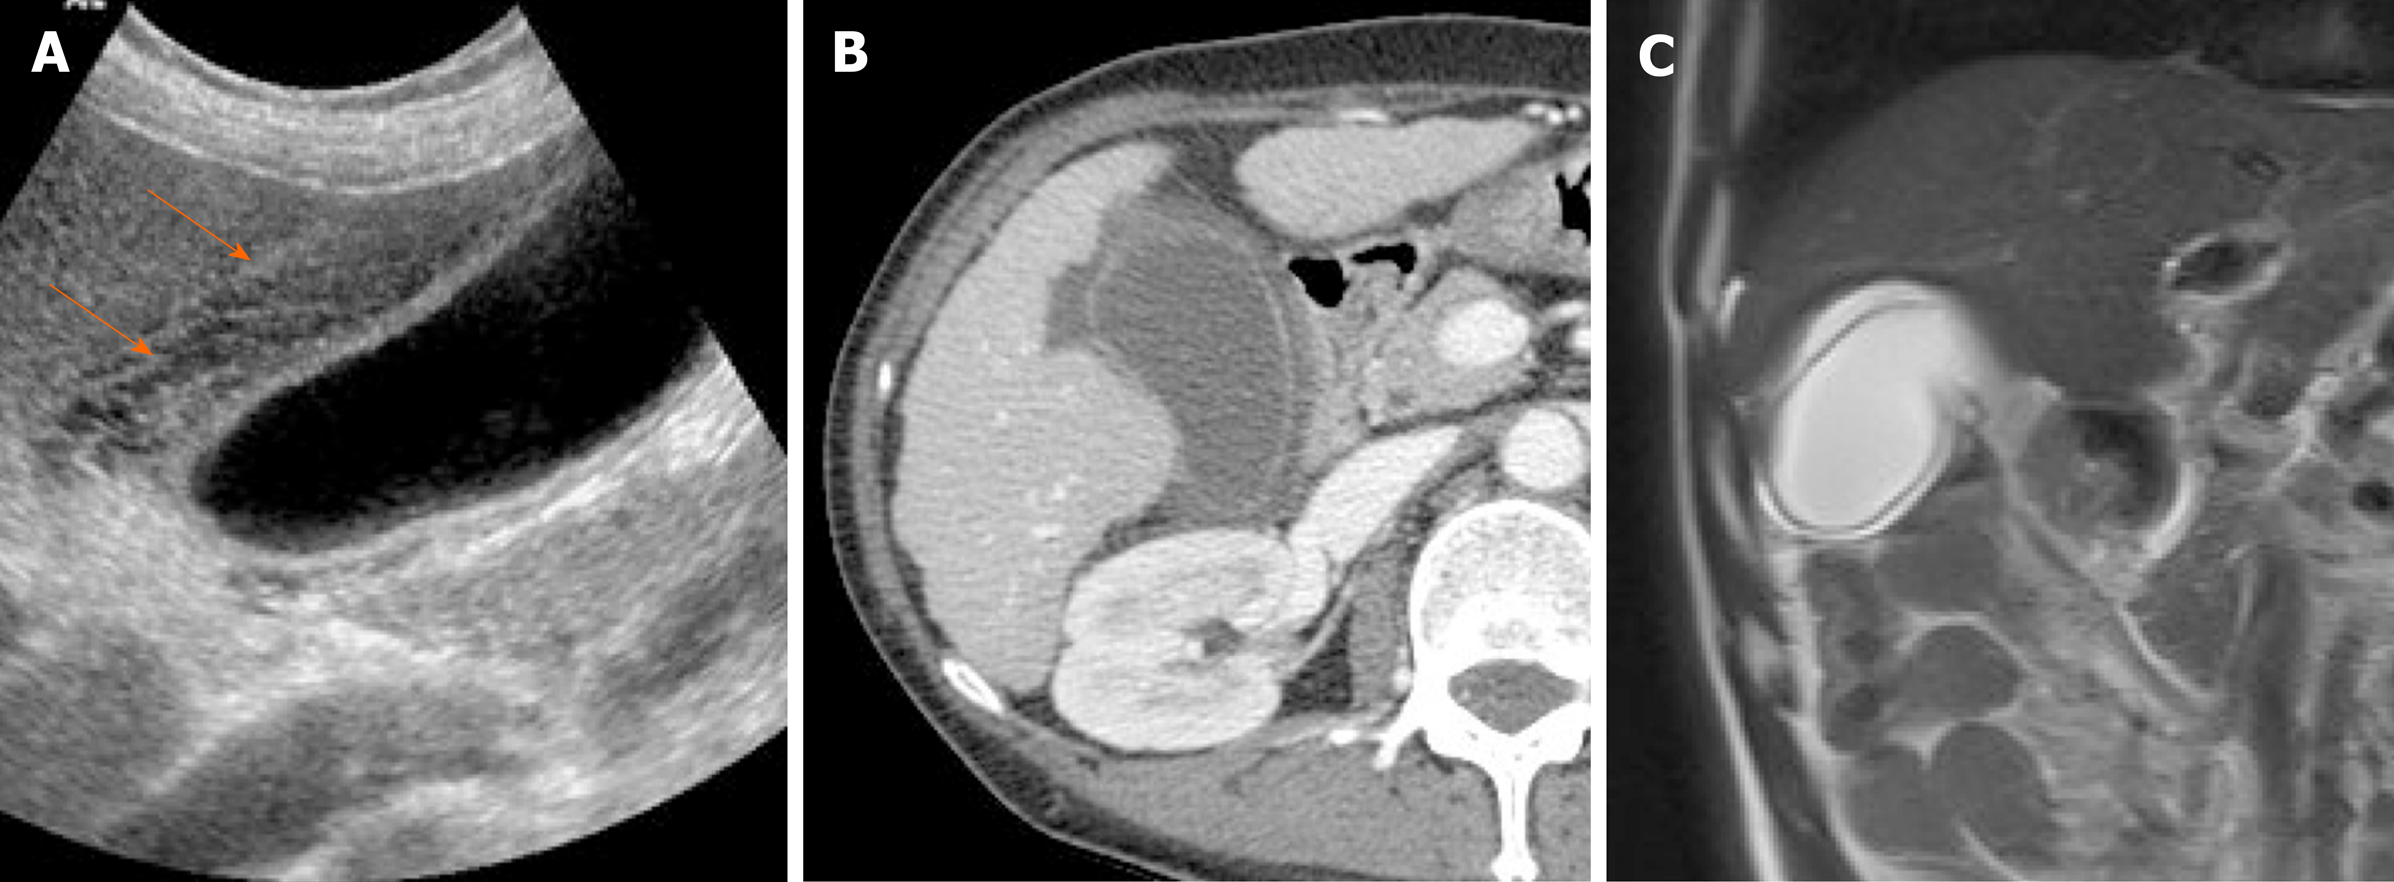
Figure 20 Gallbladder edema.
A: Distention and diffuse mural thickening of gallbladder with mesh-like multilayered wall pattern (arrows) on ultrasound; B: Intact inner mucosal layer and diffusely thickened, low-attenuated subserosal layer on computed tomography; C: Diffusely edematous, thickened gallbladder showing hyperintensity on T2-weighted image.
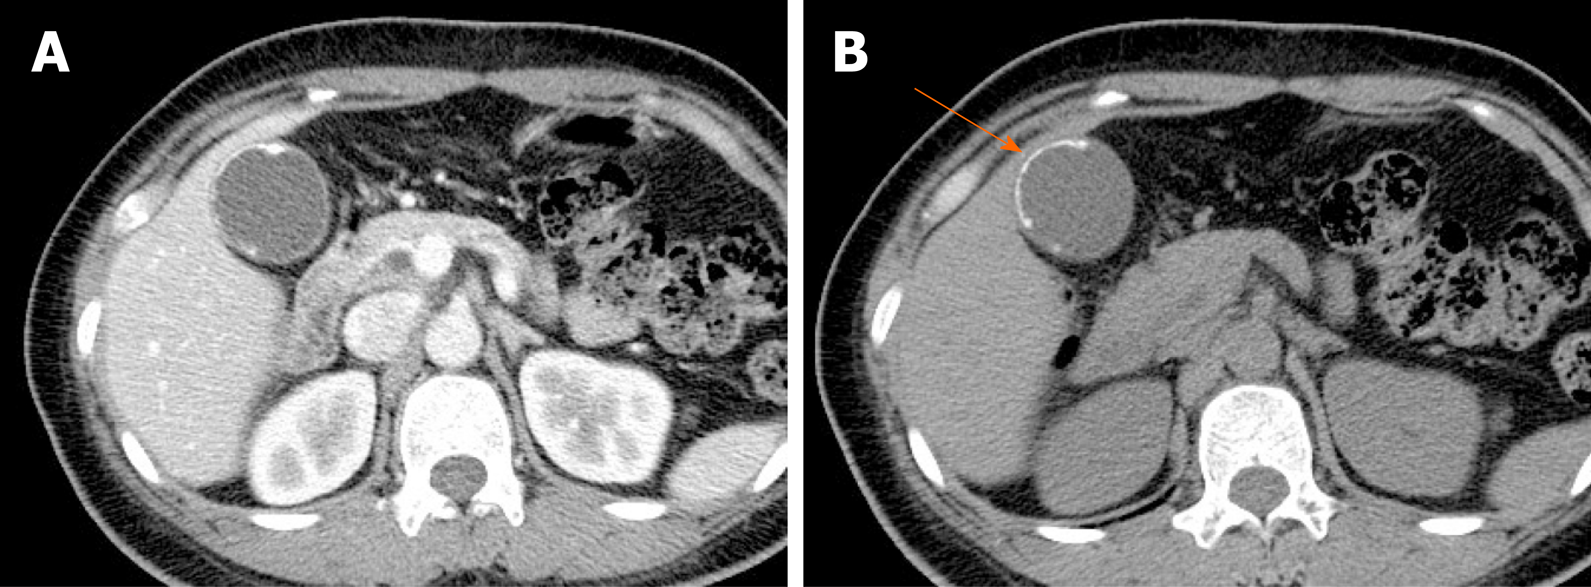
Figure 21 Porcelain gallbladder.
A: Segmental, irregular wall thickening of gallbladder fundus on contrast-enhanced computed tomography; B: Curvilinear calcification (arrow) of fundal wall on precontrast computed tomography.
Figure 22 Gallbladder varices.
A: tortuous enhancing vascular structures (arrows) encircling gallbladder wall on computed tomography, caused by portal vein thrombosis (not shown); B: Signal voids of varices (arrows) on T2-weighted image.
- Citation: Yu MH, Kim YJ, Park HS, Jung SI. Benign gallbladder diseases: Imaging techniques and tips for differentiating with malignant gallbladder diseases. World J Gastroenterol 2020; 26(22): 2967-2986
- URL: https://www.wjgnet.com/1007-9327/full/v26/i22/2967.htm
- DOI: https://dx.doi.org/10.3748/wjg.v26.i22.2967


