Copyright
©The Author(s) 2020.
World J Gastroenterol. May 28, 2020; 26(20): 2657-2668
Published online May 28, 2020. doi: 10.3748/wjg.v26.i20.2657
Published online May 28, 2020. doi: 10.3748/wjg.v26.i20.2657
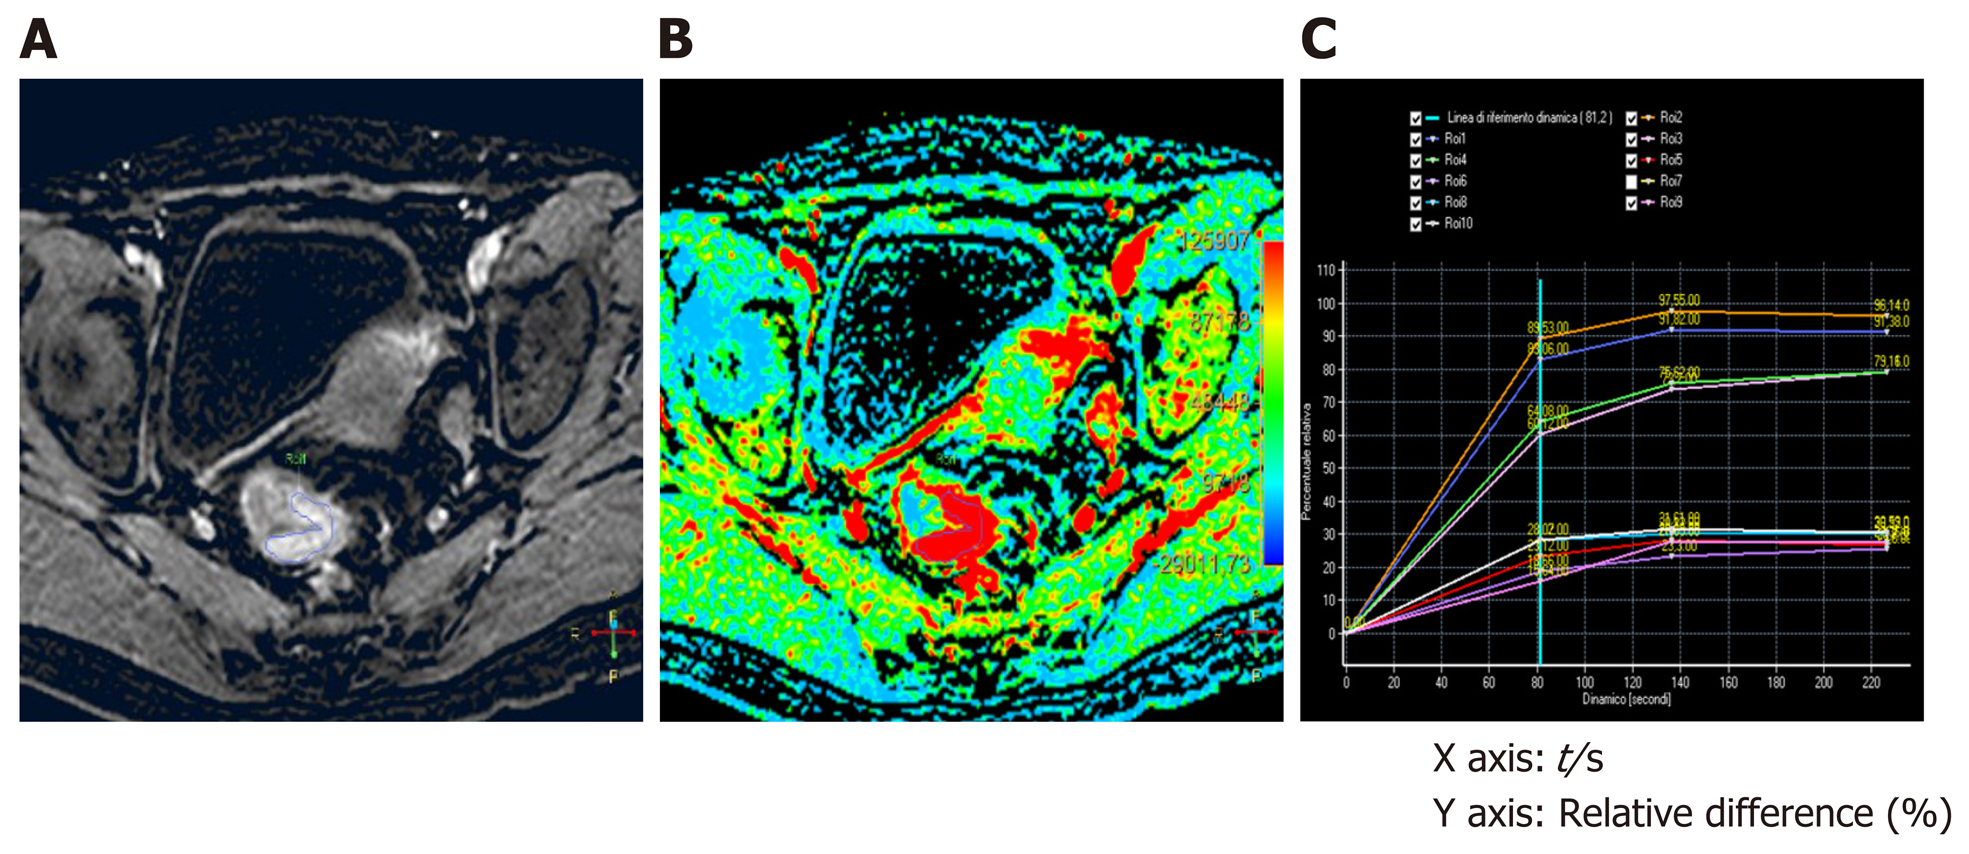
Figure 1 Staging dynamic-contrast enhanced magnetic resonance imaging (MR1) performed with 3D-T1 THRIVE images; the corresponding color map and time-intensity curves.
A: The T1 THRIVE image shows an example of freehand delineation of the tumor during an MRI study performed for staging purpose (the tumor was a T3N0); B: The related color map was created by the software, and the delineation of the tumor on the T1 THRIVE was automatically reported also on the color map; C: The time-intensity curves table show the results of the delineations on the tumor (which correspond to the highest curves) and on the healthy rectal wall.
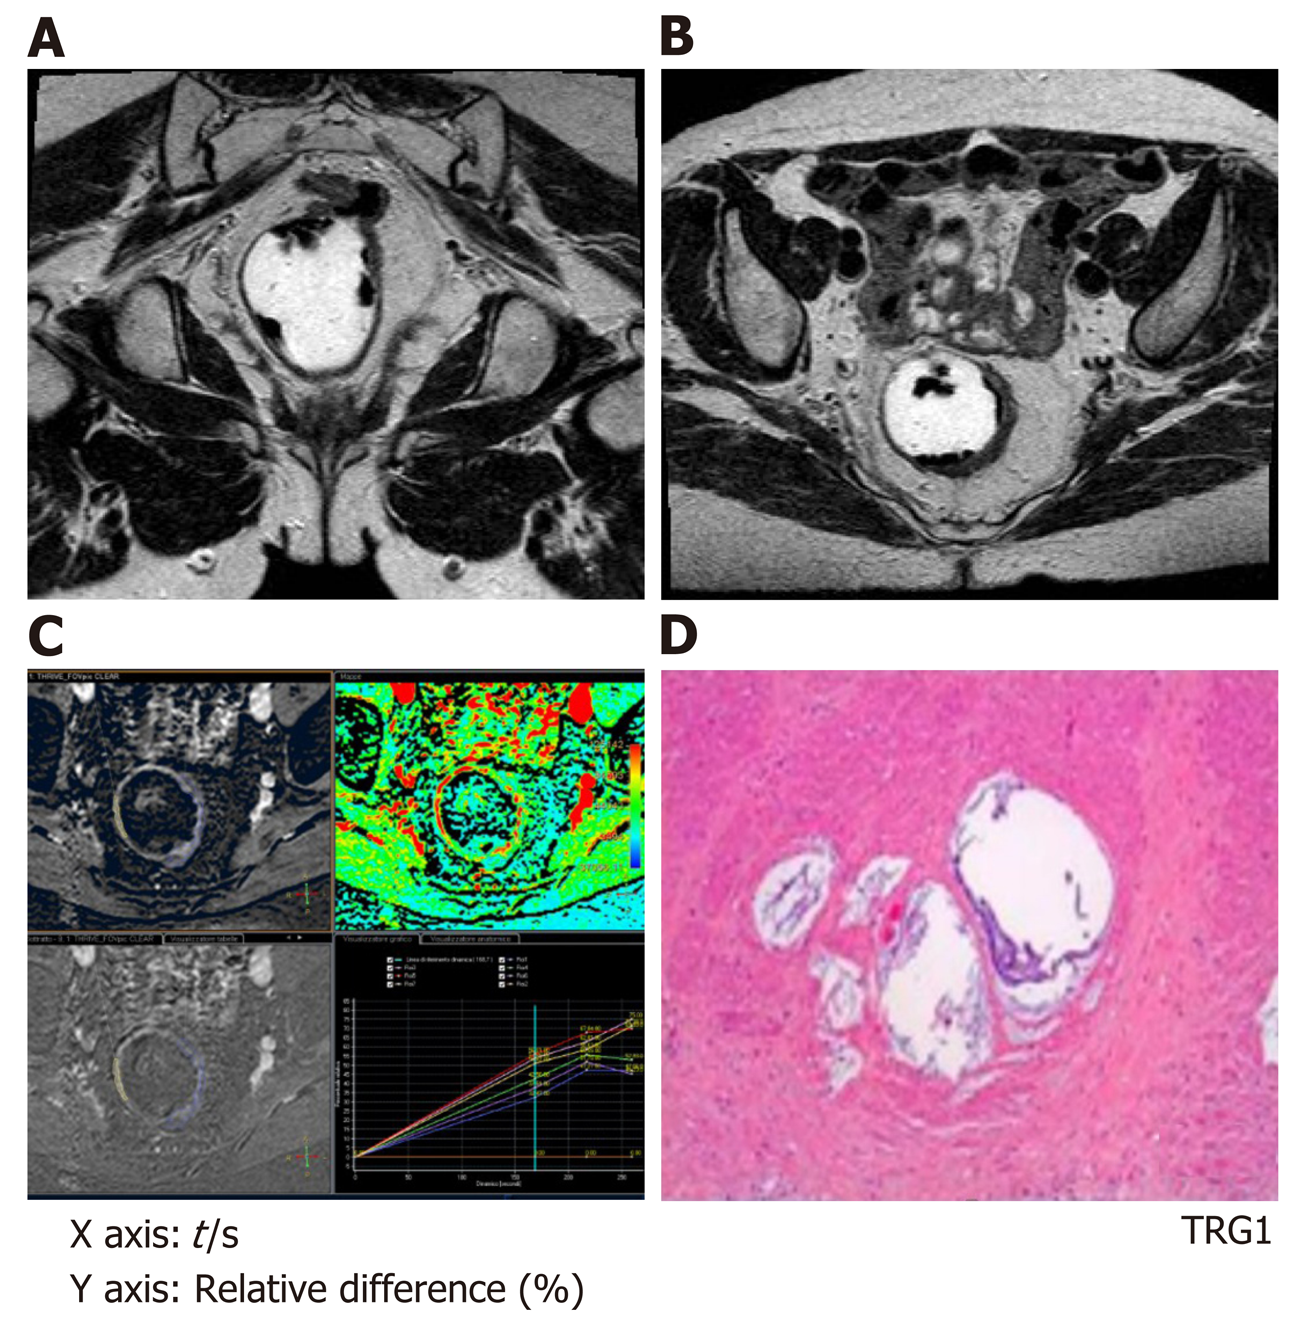
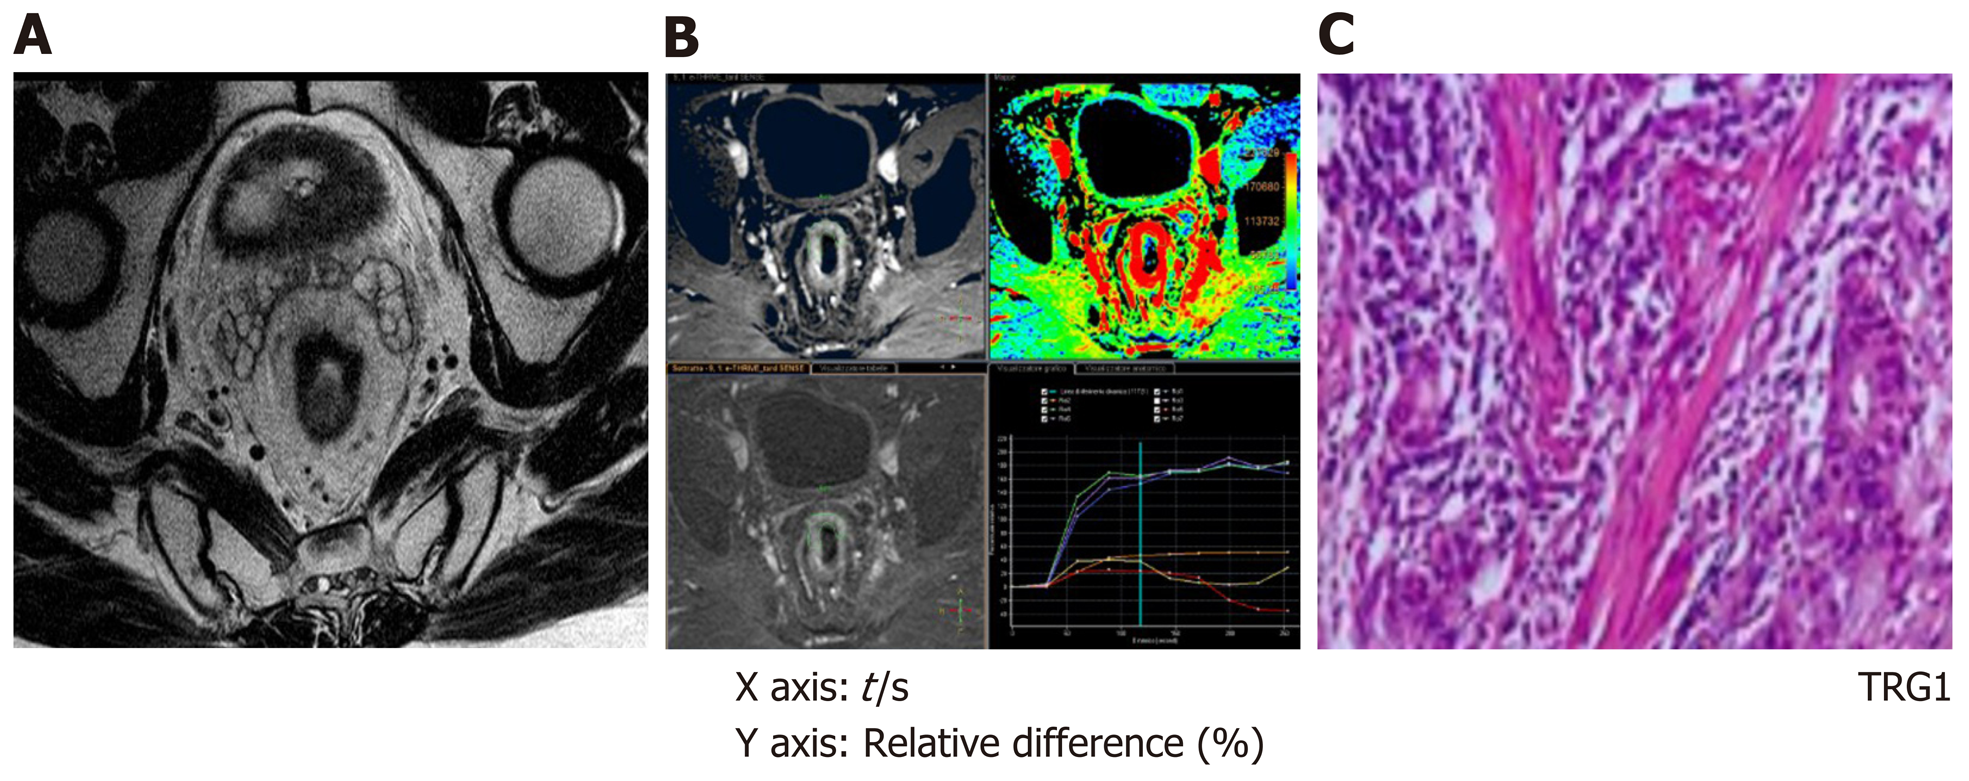
Figure 2 Magnetic resonance imaging study performed for rectal cancer restaging after chemo-radiotherapy with standard T2 weighted sequences and dynamic-contrast enhanced magnetic resonance imaging with 3D-T1 THRIVE images; the corresponding color map and time-intensity curves.
A and B: The T2 weighted sequences show a slight thickness in the rectal wall on the left side (from 2 to 5 o'clock) that corresponds to the residual tumor bed; C: The dynamic-contrast enhanced-study show the delineation of the tumor and the time-intensity curves show, with similar curves for the tumor and the healthy rectal wall; D: At histology this patient was classified as a tumor regression grade 1.
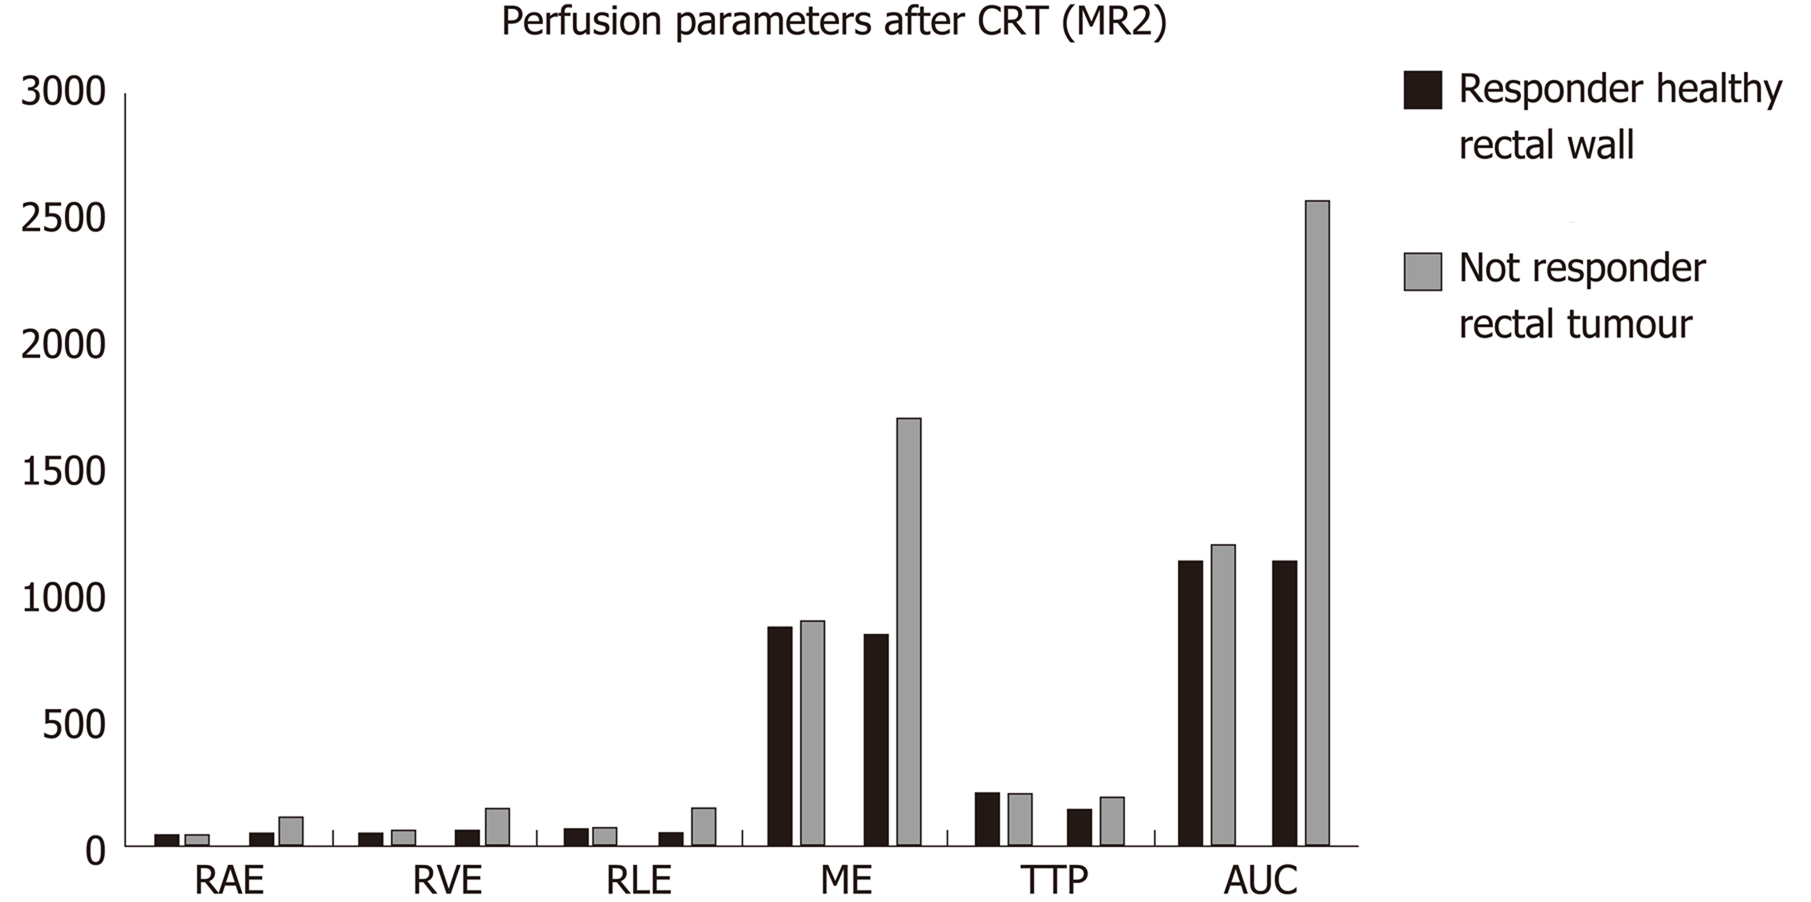
Figure 3 Differences in terms of perfusion parameters between responders and non-responders, in the tumor tissue and the healthy rectal wall, determines through a dynamic contrast enhanced magnetic resonance imaging study for rectal cancer restaging after chemo-radiotherapy.
CRT: Chemo-radiotherapy.
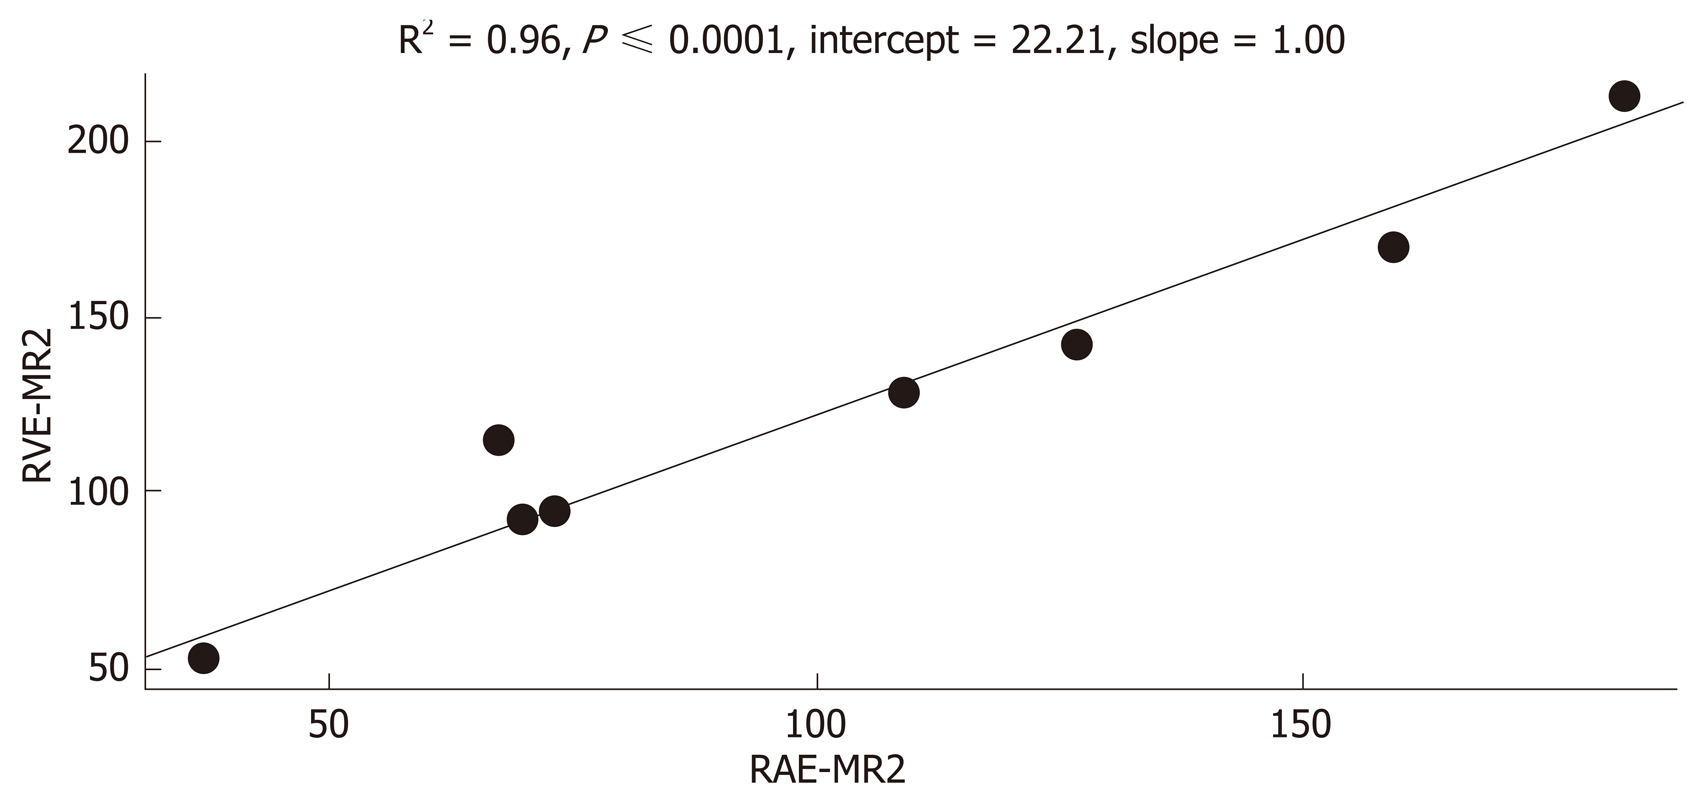
Figure 4 Correlation between the relative arterial enhancement and the relative venous enhancement at MR2.
Figure 5 Dynamic-contrast enhanced magnetic resonance imaging study performed for restaging of rectal cancer after chemoradiation therapy with 3D-T1 THRIVE and T2 weighted sequences; the corresponding color map and time-intensity curves.
A: The T2 weighted sequences show a slightly hypointense thickness in the rectal wall on the anterior side (from 11 to 2 o’clock) that corresponds to the fibrotic residual tumor bed; B: The dynamic-contrast enhanced-study performed after chemo-radiotherapy show that on the T1 THRIVE sequence some tissue thickness is present (12 o'clock) and the corresponding time-intensity curves show a significant difference between the healthy rectal wall and the tumor; C: At histology was classified as a tumor regression grade 3.
- Citation: Ippolito D, Drago SG, Pecorelli A, Maino C, Querques G, Mariani I, Franzesi CT, Sironi S. Role of dynamic perfusion magnetic resonance imaging in patients with local advanced rectal cancer. World J Gastroenterol 2020; 26(20): 2657-2668
- URL: https://www.wjgnet.com/1007-9327/full/v26/i20/2657.htm
- DOI: https://dx.doi.org/10.3748/wjg.v26.i20.2657


