©The Author(s) 2020.
World J Gastroenterol. Jan 14, 2020; 26(2): 134-153
Published online Jan 14, 2020. doi: 10.3748/wjg.v26.i2.134
Published online Jan 14, 2020. doi: 10.3748/wjg.v26.i2.134
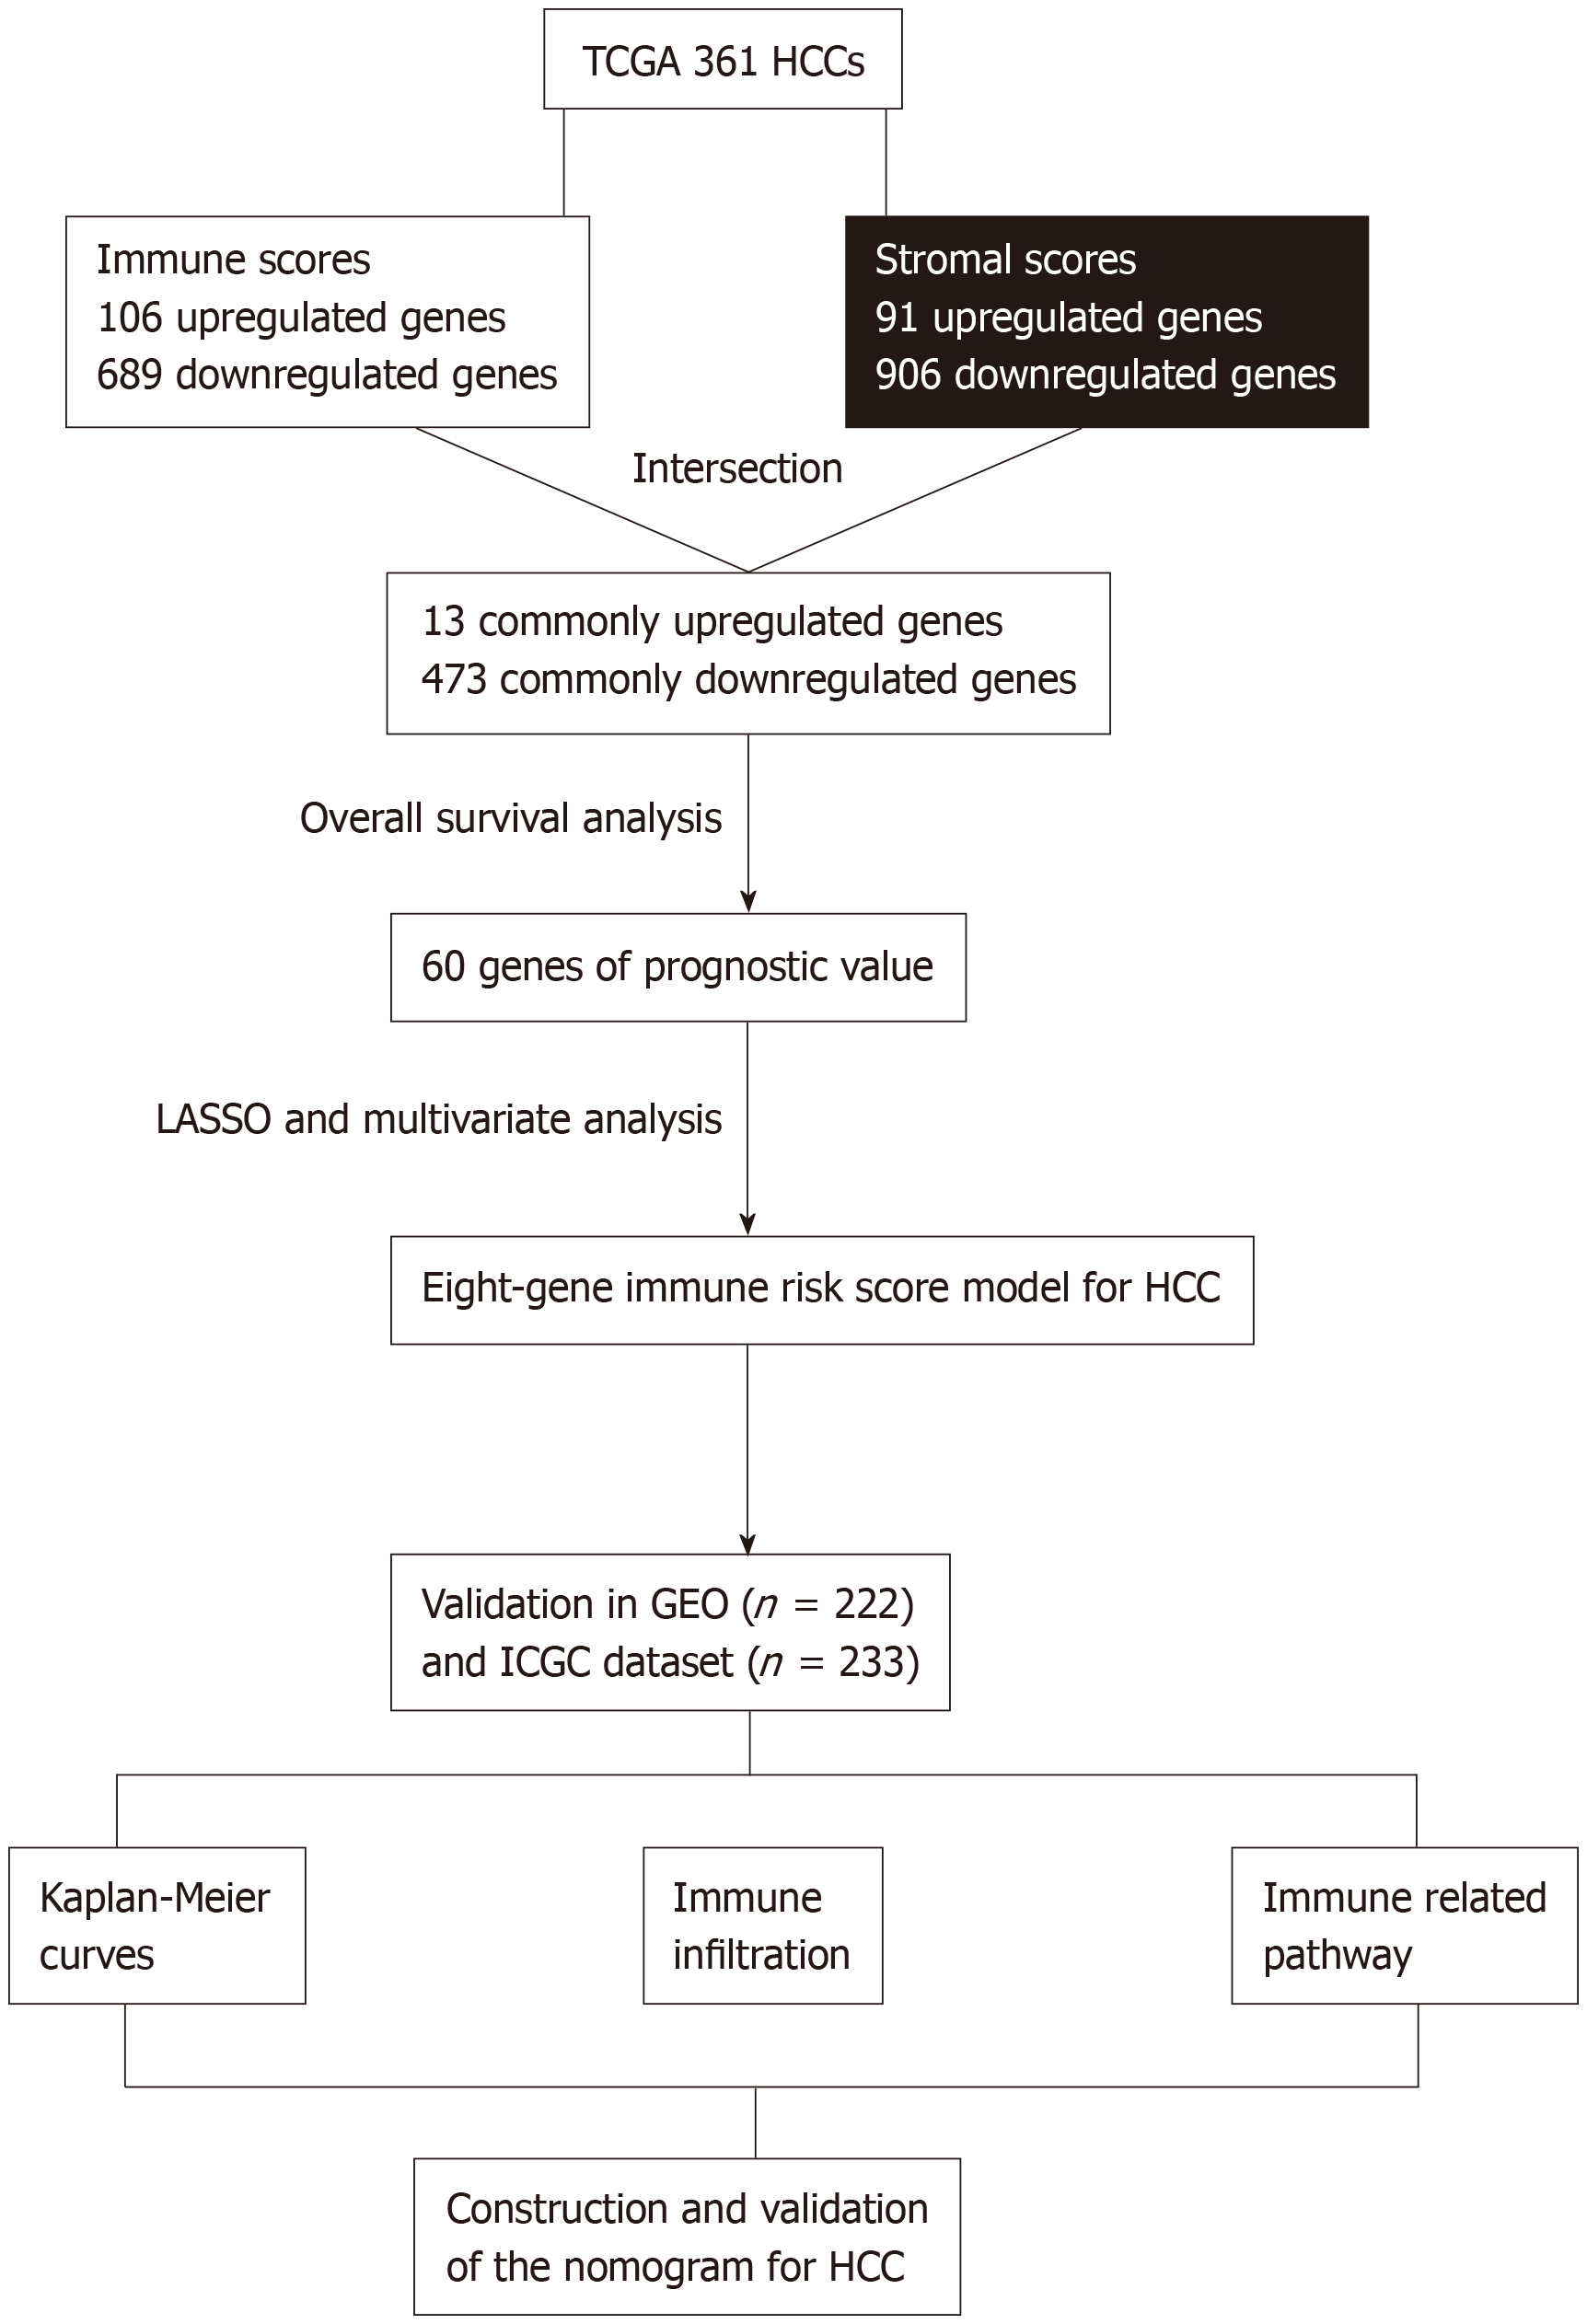
Figure 1 Overall design of the present study.
TCGA: The Cancer Genome Atlas database; HCC: Hepatocellular carcinoma; LASSO: Least absolute shrinkage and selection operator; GEO: Gene Expression Omnibus databases; ICGC: International Cancer Genome Consortium database.
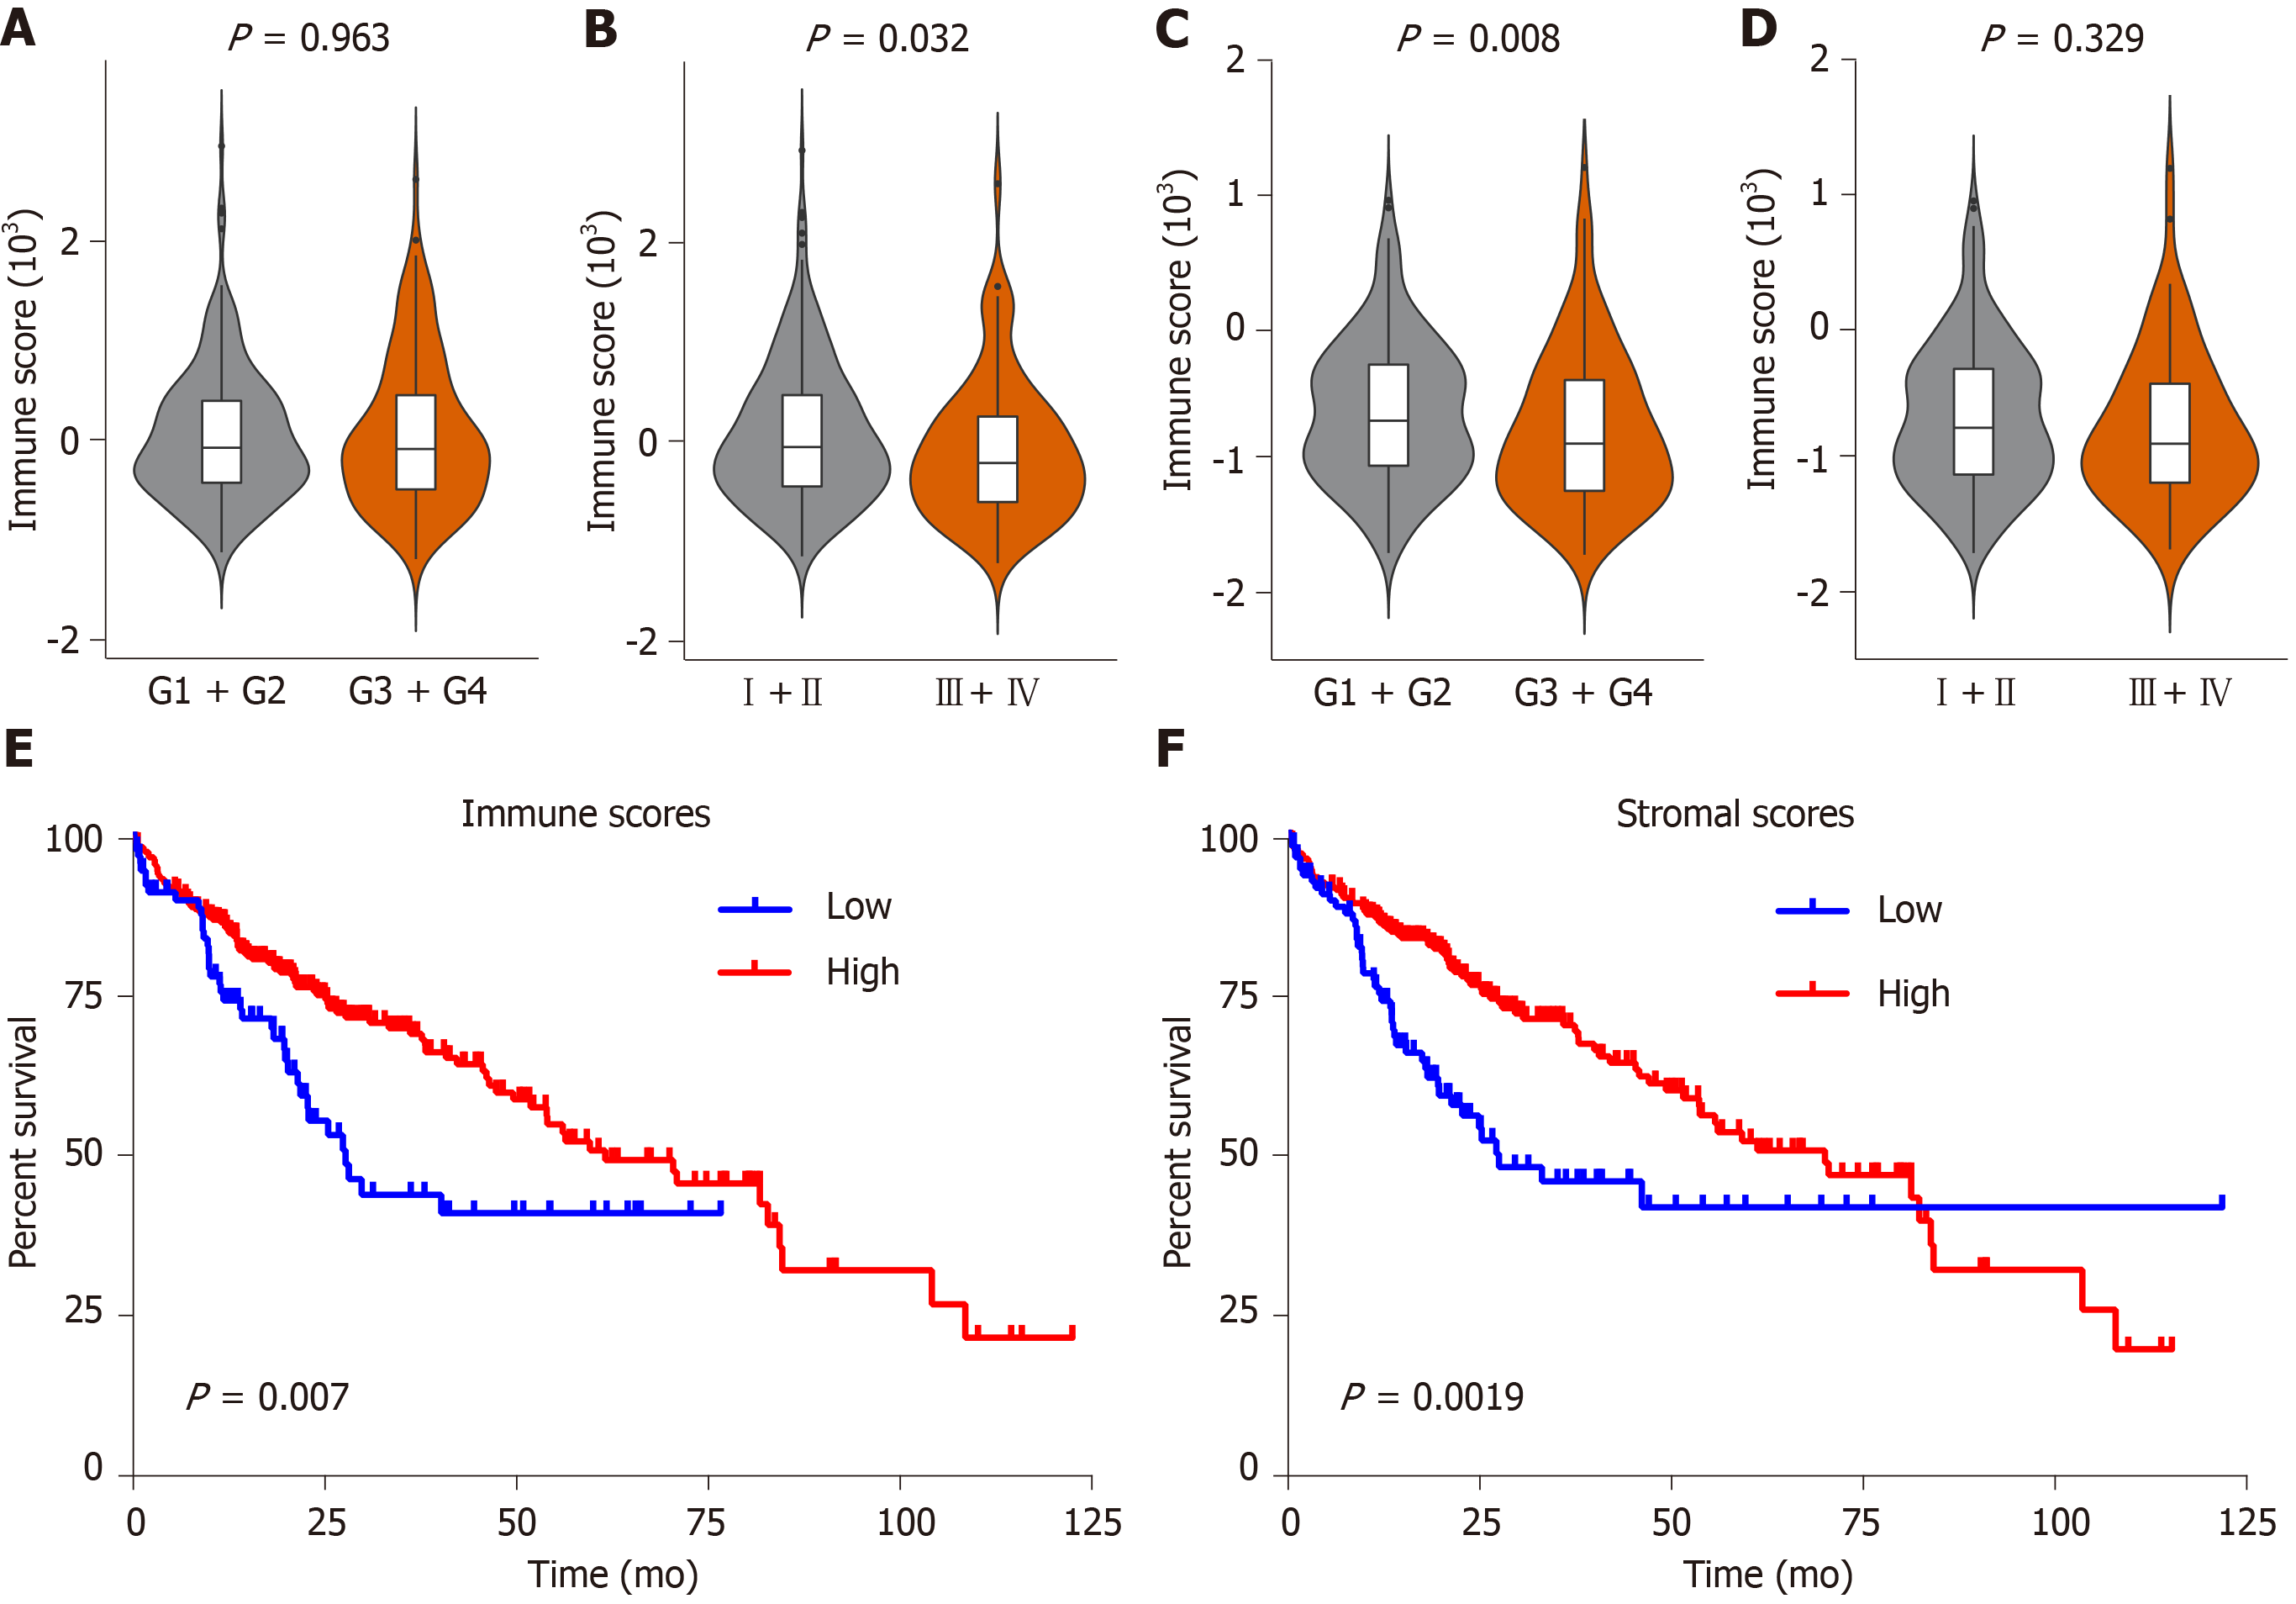
Figure 2 Immune and stromal scores are associated with clinical characteristics and overall survival of hepatocellular carcinoma patients in the Cancer Genome Atlas database dataset.
A-D: Correlation of the immune/stromal score with histologic grade and pathologic stage; E: Hepatocellular carcinoma (HCC) cases were divided into two groups based on their immune scores, as indicated by the log-rank test; F: Similarly, HCC cases were divided into two groups based on their stromal scores, as indicated by the log-rank test. TCGA: The Cancer Genome Atlas database; HCC: Hepatocellular carcinoma.
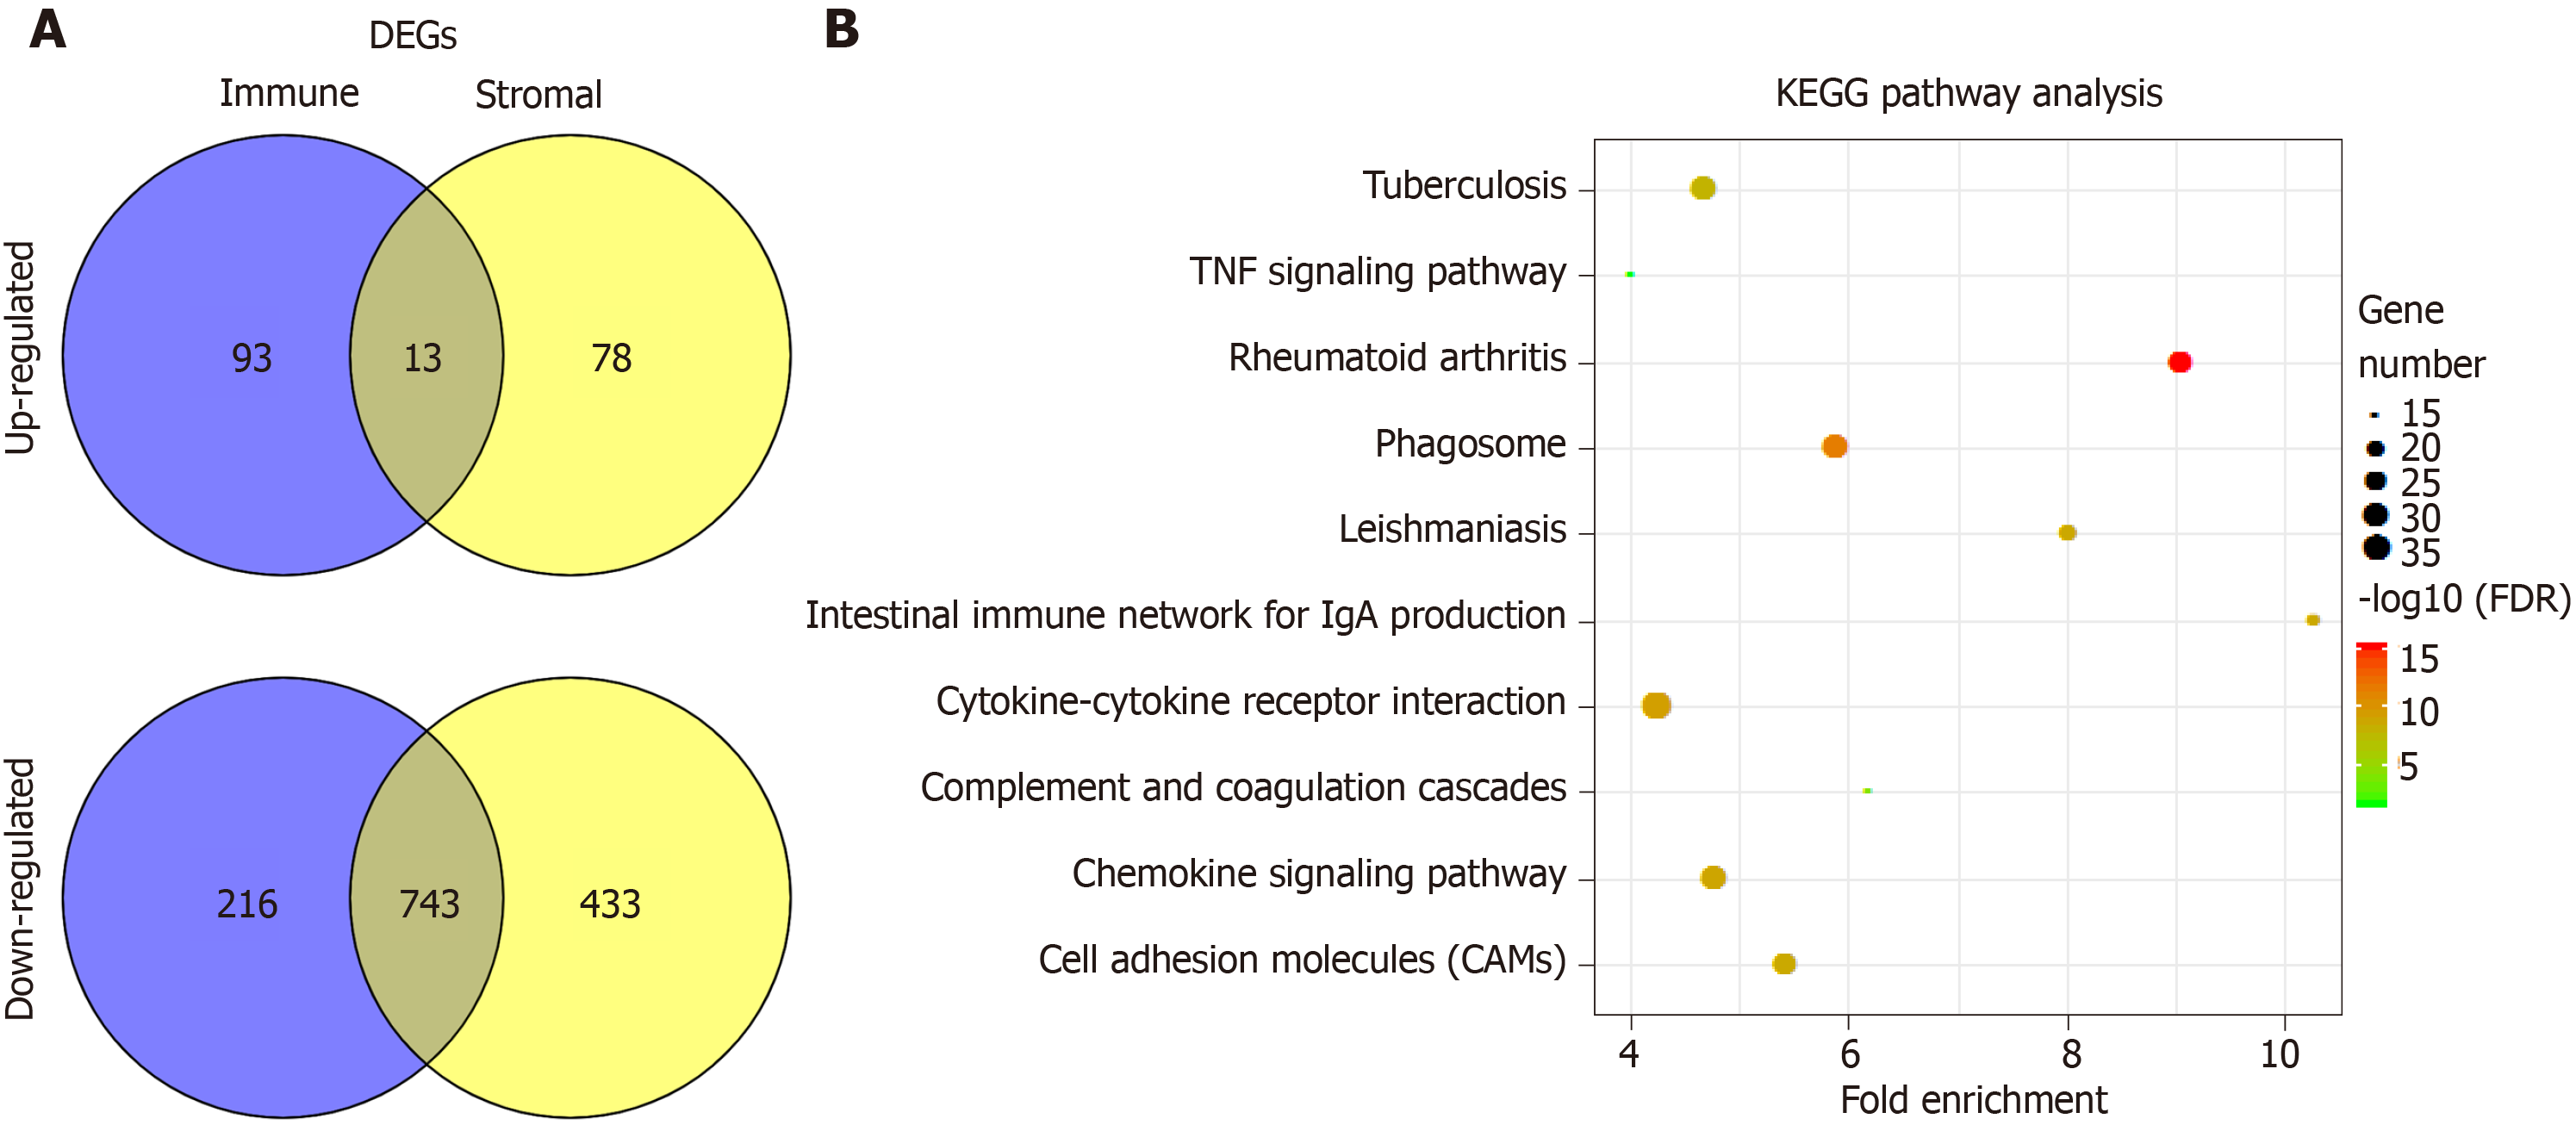
Figure 3 Comparison of gene expression profile with immune scores and stromal scores of hepatocellular carcinoma in the Cancer Genome Atlas database dataset.
A: Venn diagrams showing the number of commonly upregulated or downregulated differentially expressed genes (DEGs) in stromal and immune score groups; B: Kyoto encyclopedia of genes and genomes (KEGG) analysis of DEGs, top 10 GO terms were displayed. False discovery rate of KEGG analysis was acquired from the database for annotation, visualization and integrated discovery functional annotation tool. DEGs: Differentially expressed genes; TNF: Tumor necrosis factor; KEGG: Kyoto encyclopedia of genes and genomes; DAVID: Database for annotation, visualization and integrated discovery.
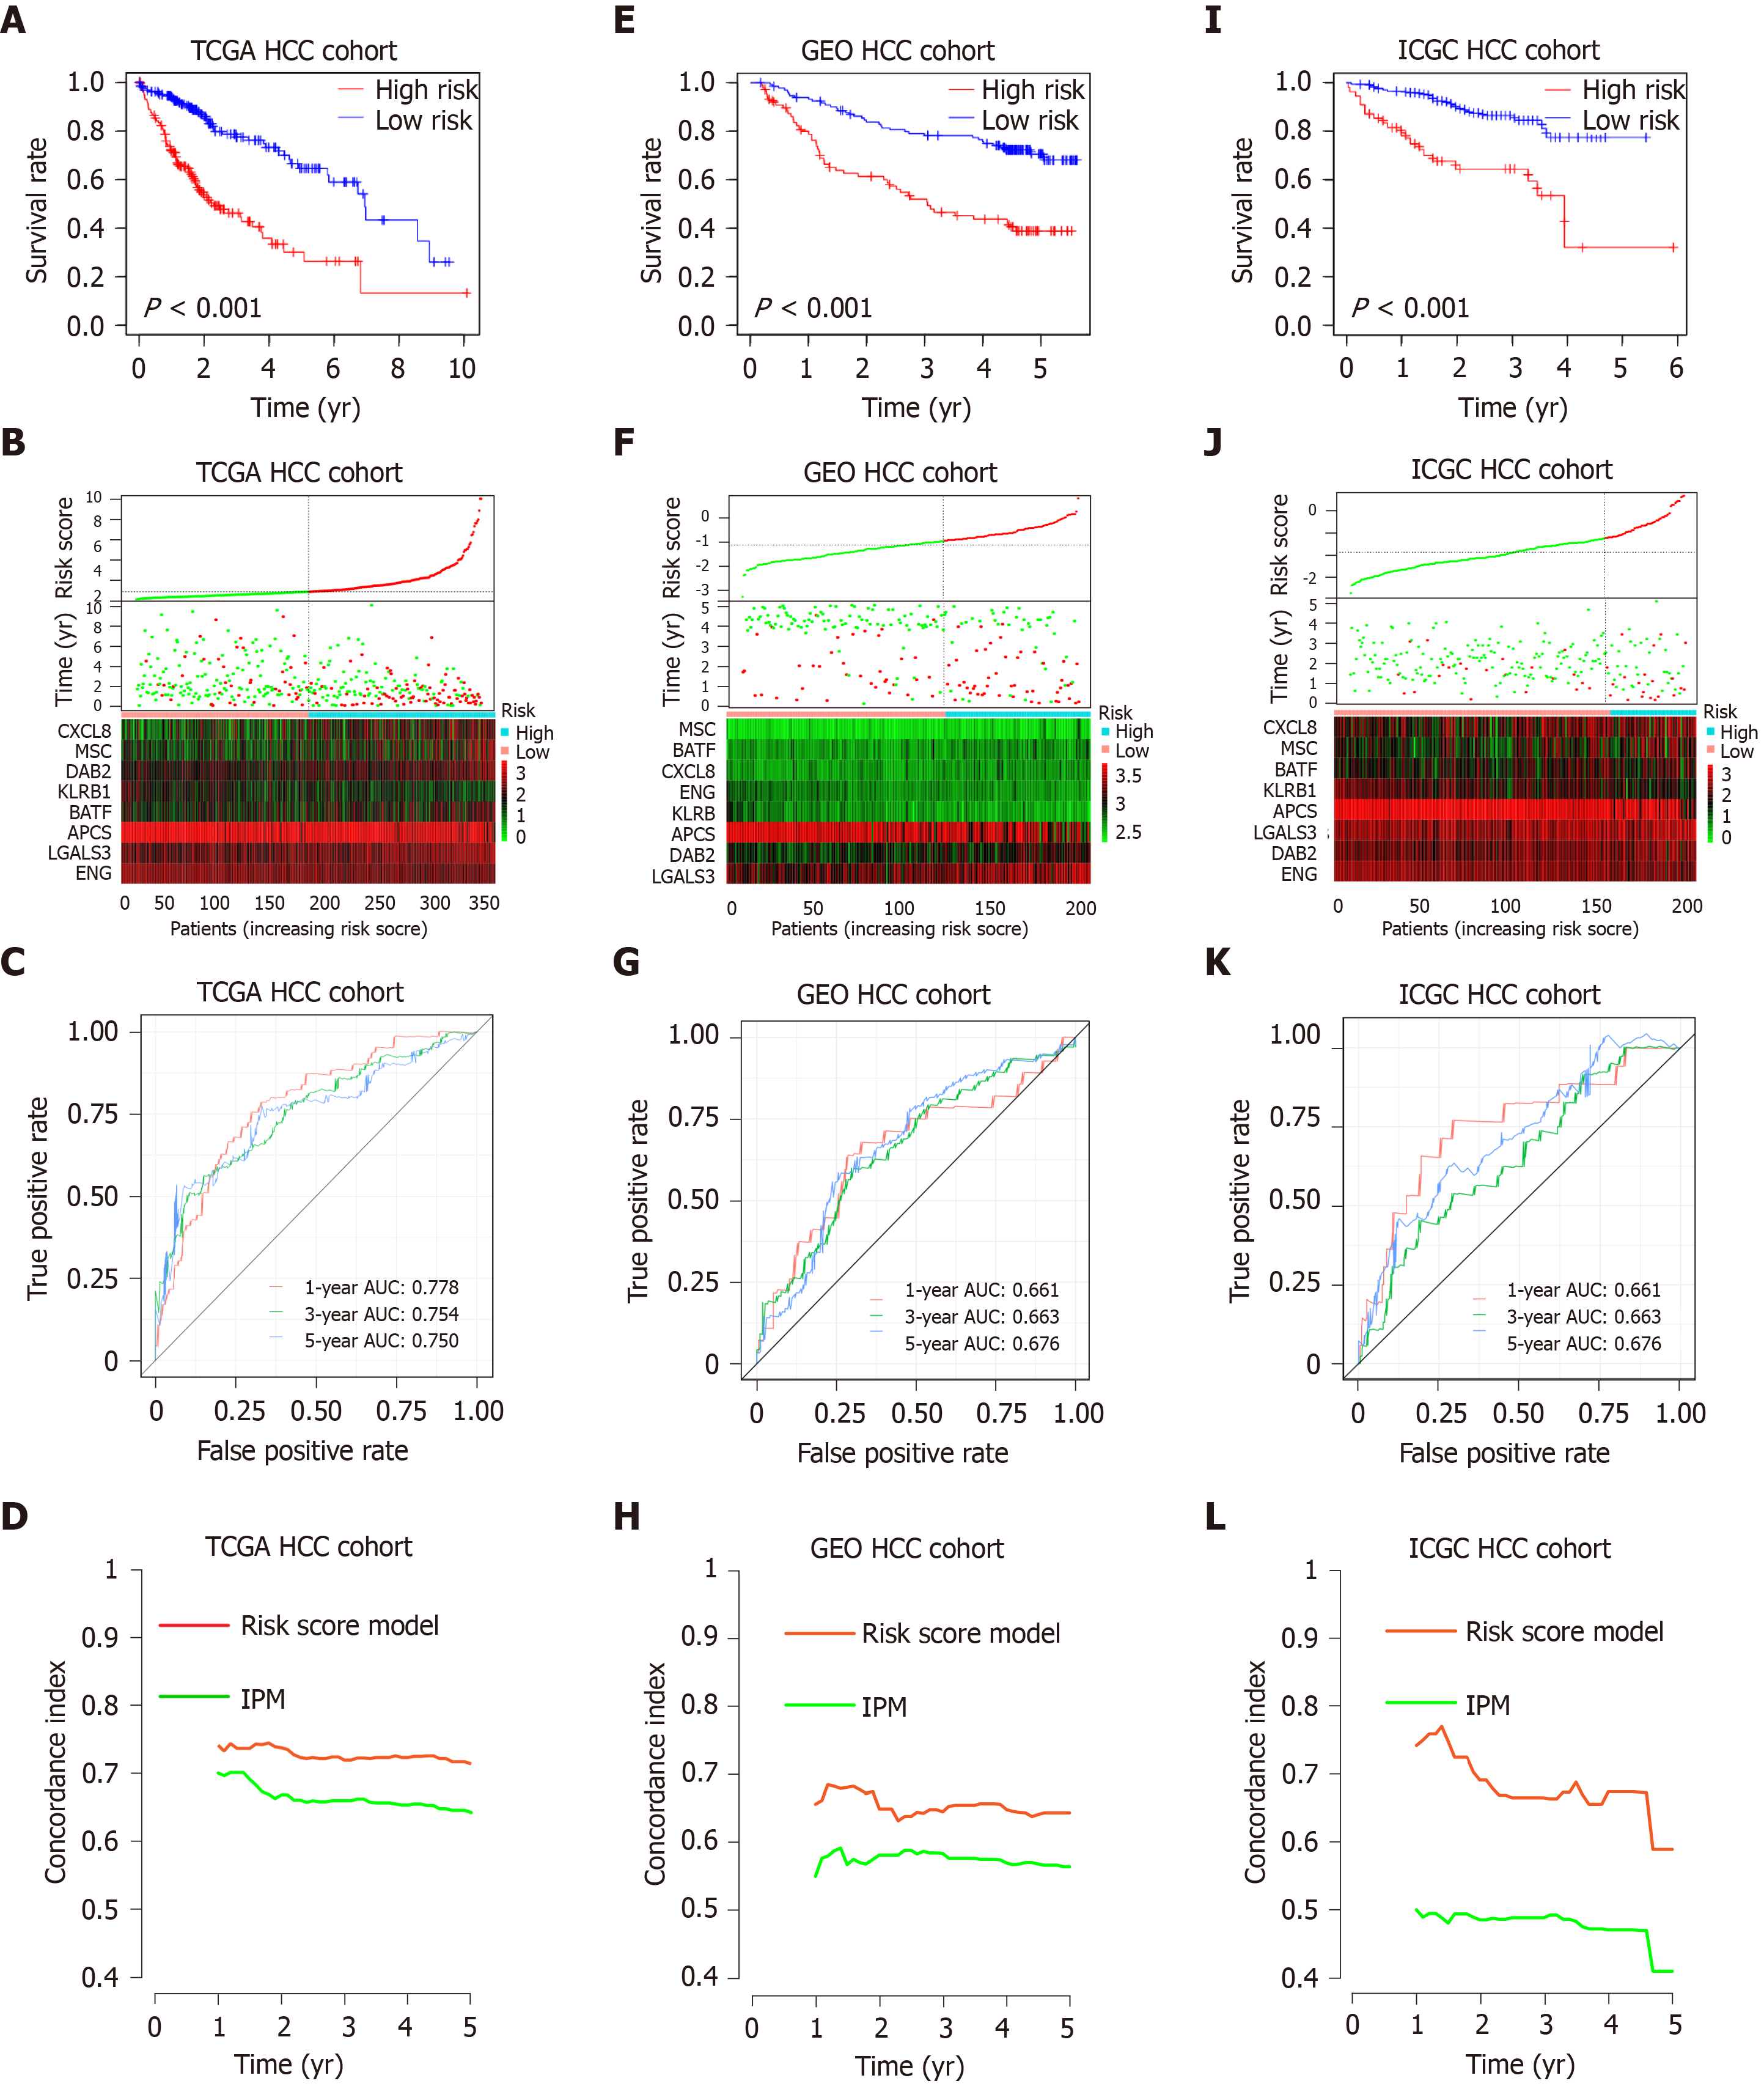
Figure 4 Prognostic analysis of the risk score model.
A-C: Kaplan-Meier survival, risk score and time-dependent receiver operating characteristic (ROC) curves of the risk score model for the Cancer Genome Atlas database (TCGA) hepatocellular carcinoma (HCC) cohort; E-G: Kaplan-Meier survival, risk score and time-dependent ROC curves of the risk score model for the Gene Expression Omnibus databases (GEO) HCC cohort; I-K: Kaplan-Meier survival, risk score and time-dependent ROC curves of the risk score model for the International Cancer Genome Consortium database (ICGC) HCC cohort. A, E and I: OS was significantly higher in the low-risk score group than in the high-risk score group; B, F and J: Relationship between the risk score (upper) and the expression of eight prognostic immune genes (lower) is shown; C, G and K: Time-dependent ROC curve analysis of the risk score model; D, H and L: The concordance index (C-index) was used to evaluate prognostic performance for survival prediction. Performance was compared between the risk score model and immune prognostic model by calculating the C-index in the TCGA, GEO and ICGC HCC cohorts. TCGA: The Cancer Genome Atlas database; GEO: Gene Expression Omnibus databases; ICGC: International Cancer Genome Consortium database; IPM: Immune prognostic model; HCC: Hepatocellular carcinoma.
Figure 5 Landscape of immune infiltration in high- and low-risk hepatocellular carcinoma patients in the Cancer Genome Atlas database dataset.
A: Relative proportion of immune infiltration in high- and low-risk patients; B: Heat map of the 22 immune cell proportions in high- and low-risk patients; C: Violin plots visualizing significantly different immune cells between high-risk and low-risk patients; D: Correlation matrix of all 22 immune cell proportions.
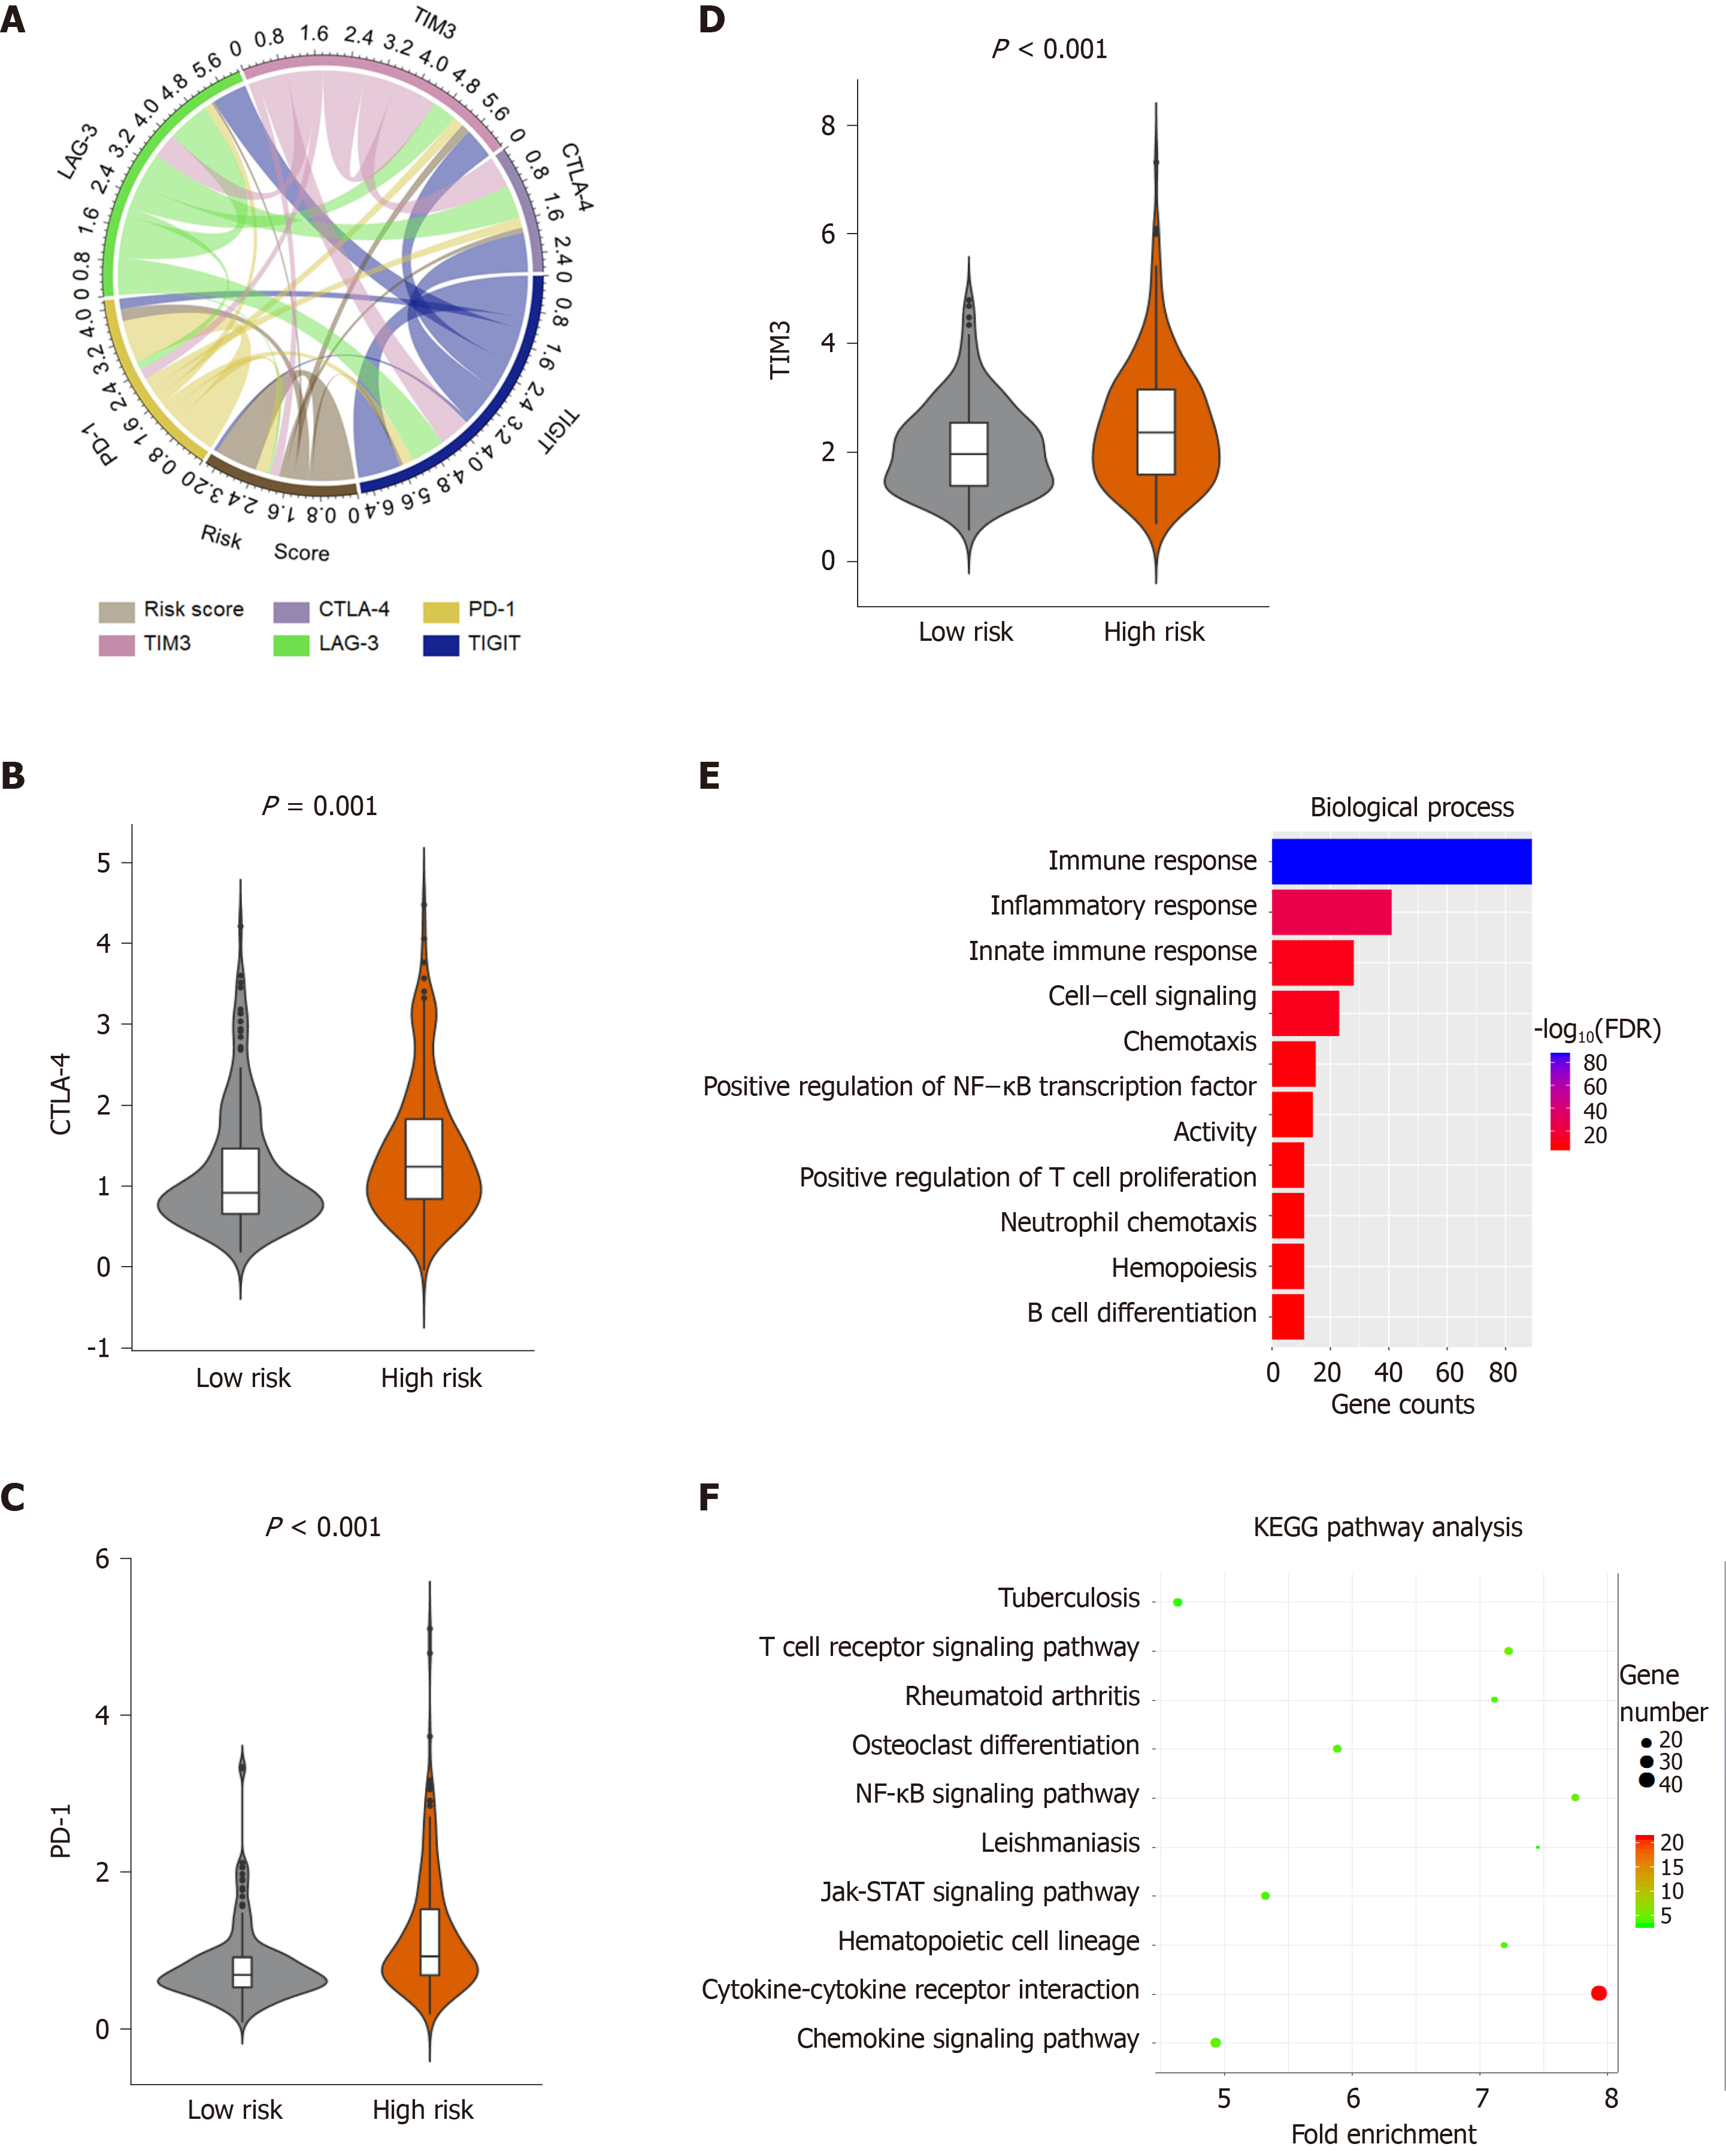
Figure 6 Enrichment analysis of the immune prognostic model.
A: Correlation of the risk score with the expression of several prominent immune checkpoints; B-D: Violin plots visualizing significantly different immune checkpoints between high-risk and low-risk patients; E-F: The Gene Ontology (GO) and Kyoto encyclopedia of genes and genomes (KEGG) analysis of immune related genes, top 10 GO terms were displayed. False Discovery Rate of GO and KEGG analysis was acquired from the DAVID functional annotation tool. CTLA-4: Cytotoxic T-Lymphocyte associated protein 4; PD-1: Programmed cell death 1; TIM-3: T-cell immunoglobulin mucin receptor 3; KEGG: Kyoto encyclopedia of genes and genomes; FDR: False discovery rate.
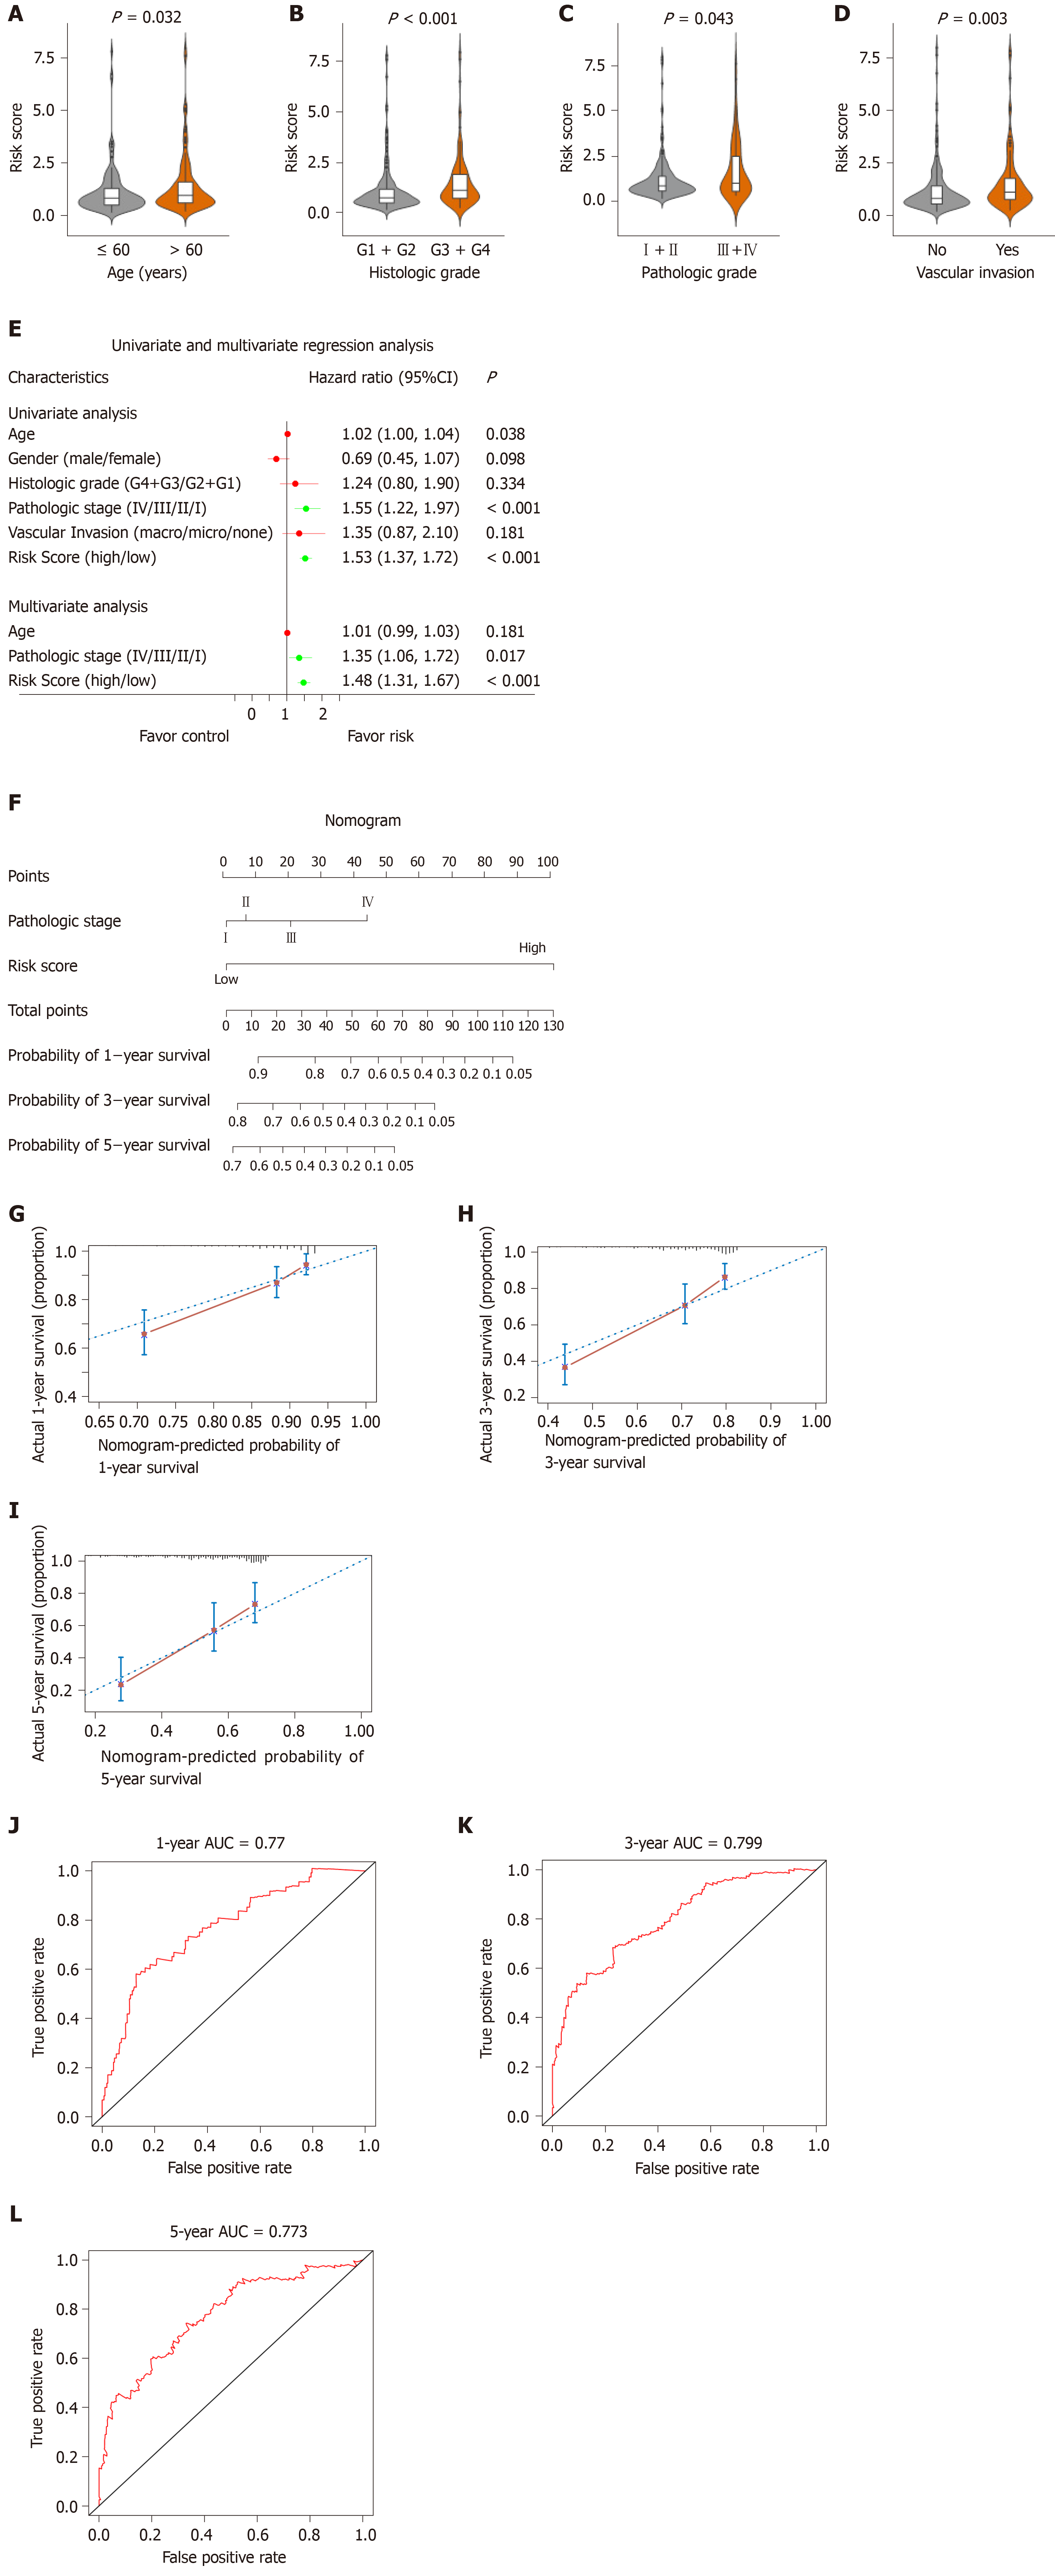
Figure 7 Relationship between the risk score model and other clinical information.
A: Correlation of the risk score with the age; B: Correlation of the risk score with the histologic grade; C: Correlation of the risk score with the pathologic stage; D: Correlation of the risk score with the vascular invasion; E: Univariate and multivariate regression analysis of the relation between the risk score prognostic model and clinicopathological features regarding prognostic value; F: Nomogram for predicting the probability of 1-, 3-, and 5-year overall survival (OS) for hepatocellular carcinoma patients; G-I: Calibration plot of the nomogram for predicting the probability of OS at 1, 3, and 5 years; J-L: Time-dependent receiver operating characteristic curve analyses of the nomogram. ROC: Receiver operating characteristic curve; CI: Confidence interval.
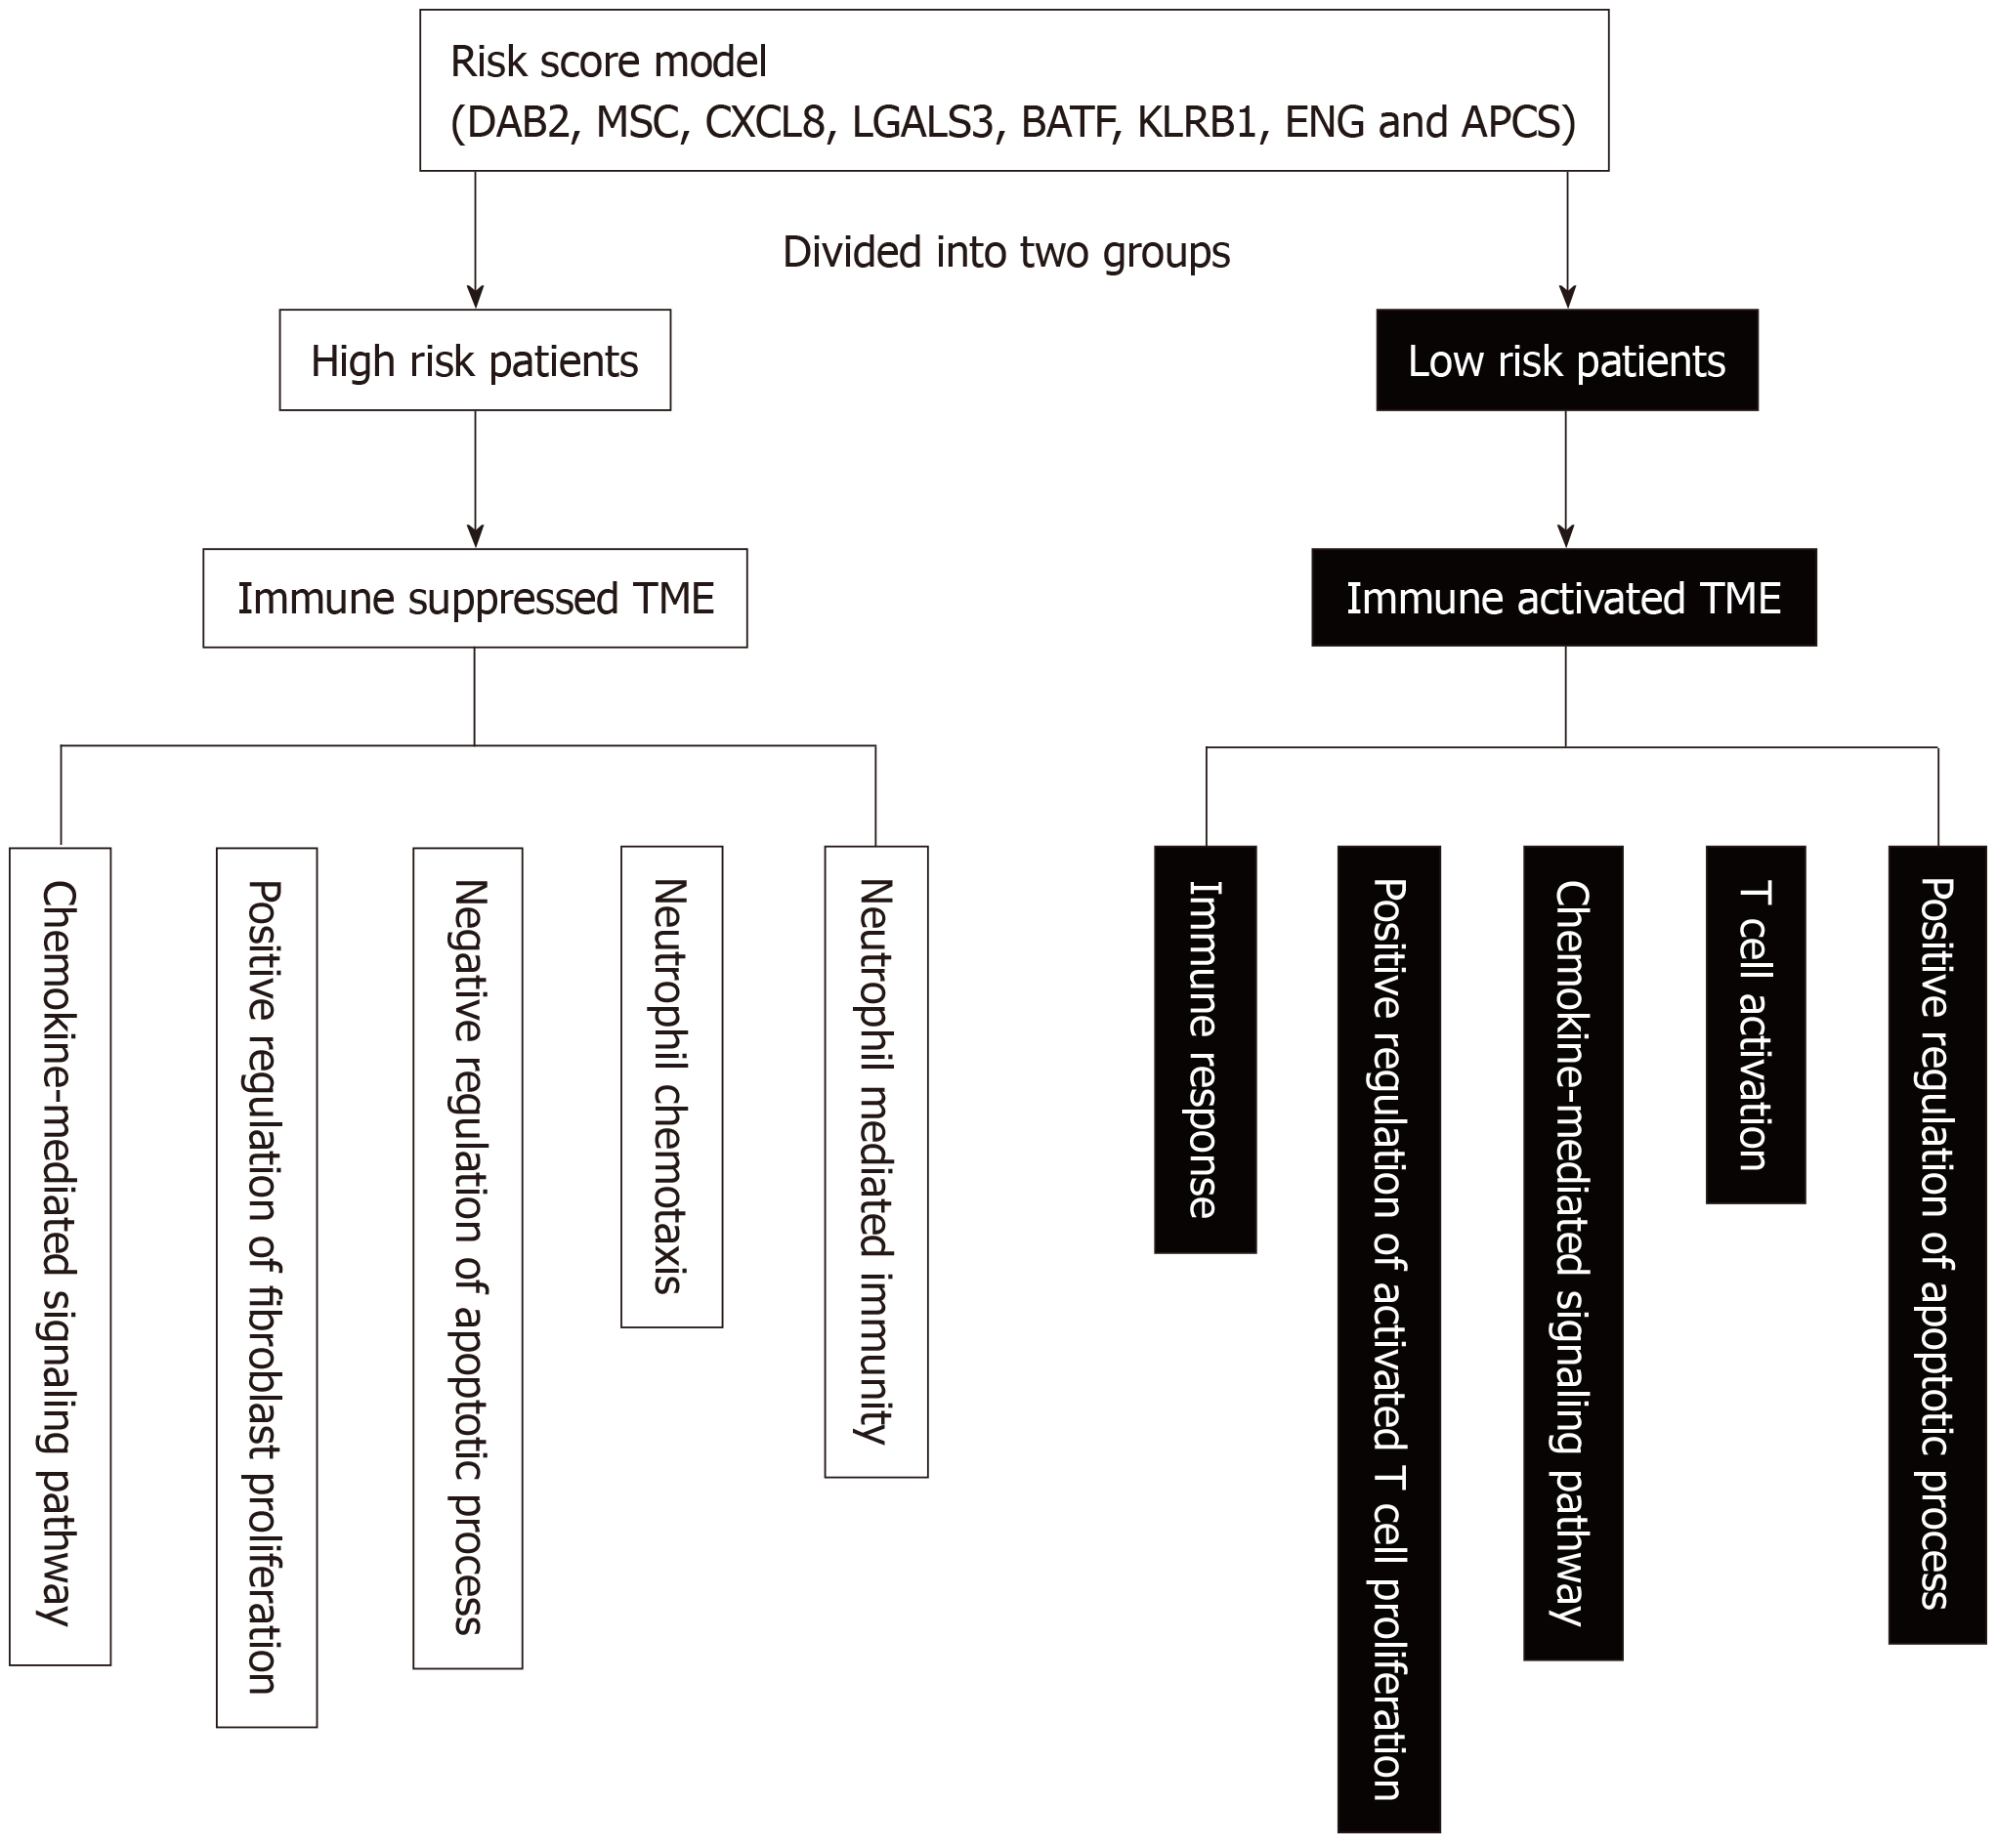
Figure 8 Schematic diagram of the main altered pathway in the high- and low-risk patients.
TME: tumor microenvironment; DAB2: Disabled homolog 2; MSC: Musculin; CXCL8: C-X-C Motif chemokine ligand 8; LGALS3: Galectin 3; BATF: B-Cell-activating transcription factor; KLRB1: Killer cell lectin like receptor B1; ENG: Endoglin; APCS: Adenomatosis polyposis coli tumor suppressor.
- Citation: Zhang FP, Huang YP, Luo WX, Deng WY, Liu CQ, Xu LB, Liu C. Construction of a risk score prognosis model based on hepatocellular carcinoma microenvironment. World J Gastroenterol 2020; 26(2): 134-153
- URL: https://www.wjgnet.com/1007-9327/full/v26/i2/134.htm
- DOI: https://dx.doi.org/10.3748/wjg.v26.i2.134


