Copyright
©The Author(s) 2020.
World J Gastroenterol. May 21, 2020; 26(19): 2388-2402
Published online May 21, 2020. doi: 10.3748/wjg.v26.i19.2388
Published online May 21, 2020. doi: 10.3748/wjg.v26.i19.2388
Figure 1 Flowchart of patient inclusion and exclusion.
LARC: Locally advanced rectal cancer; nCT: Neoadjuvant chemotherapy; TME: Total mesorectal excision; WCH: West China Hospital; CT: Computed tomography; MRI: Magnetic resonance imaging.
Figure 2 A 56-year-old male with locally advanced rectal cancer.
A-C: Representative manual segmentation of the whole lesion in the axial dynamic contrast enhanced T1 images and enhanced computed tomography. Dotted lines represent the delineations of the regions of interest used to derive the radiomics features; D: Three-dimensional volumetric reconstruction of the segmented lesion.
Figure 3 Texture feature selection using the least absolute shrinkage and selection operator binary logistic regression model.
A: Tuning parameter λ selection in the least absolute shrinkage and selection operator model used 10-fold cross-validation via minimum criteria. Area under the receiver operating characteristic curve was plotted versus the log λ. Dotted vertical lines were drawn at the optimal values using the minimum criteria. A λ value of -5.47, with log λ, according to 10-fold cross-validation; B: Least absolute shrinkage and selection operator coefficient profiles of the 20 top ranked texture features. A coefficient profile plot was produced against the log λ sequence. A vertical line was drawn at the value selected using 10-fold cross-validation, where optimal λ resulted in 13 nonzero coefficients.
Figure 4 Receiver operating characteristic curves in the training set.
A: Combined radiomics model [area under the curve (AUC) = 0.908, accuracy (ACC) = 0.812] achieved a better performance than individual computed tomography, dynamic contrast enhanced T1 images, high resolution T2-weighted imaging and apparent diffusion coefficient models; B: The extramural venous invasion model achieved relatively low performance in the training (AUC = 0.73, ACC = 0.714) set. In contrast, the multi-modal radiomics model (AUC = 0.925, ACC = 0.886) and combined radiomics model (AUC = 0.921, ACC = 0.886) performed better. CRM: Combined radiomics model; DCE-T1: Dynamic contrast enhanced T1 images; HR-T2WI: High resolution T2-weighted imaging; ADC: Apparent diffusion coefficient; CT: Computed tomography; MRM: Multi-modal radiomics model; EMVI: Extramural venous invasion.
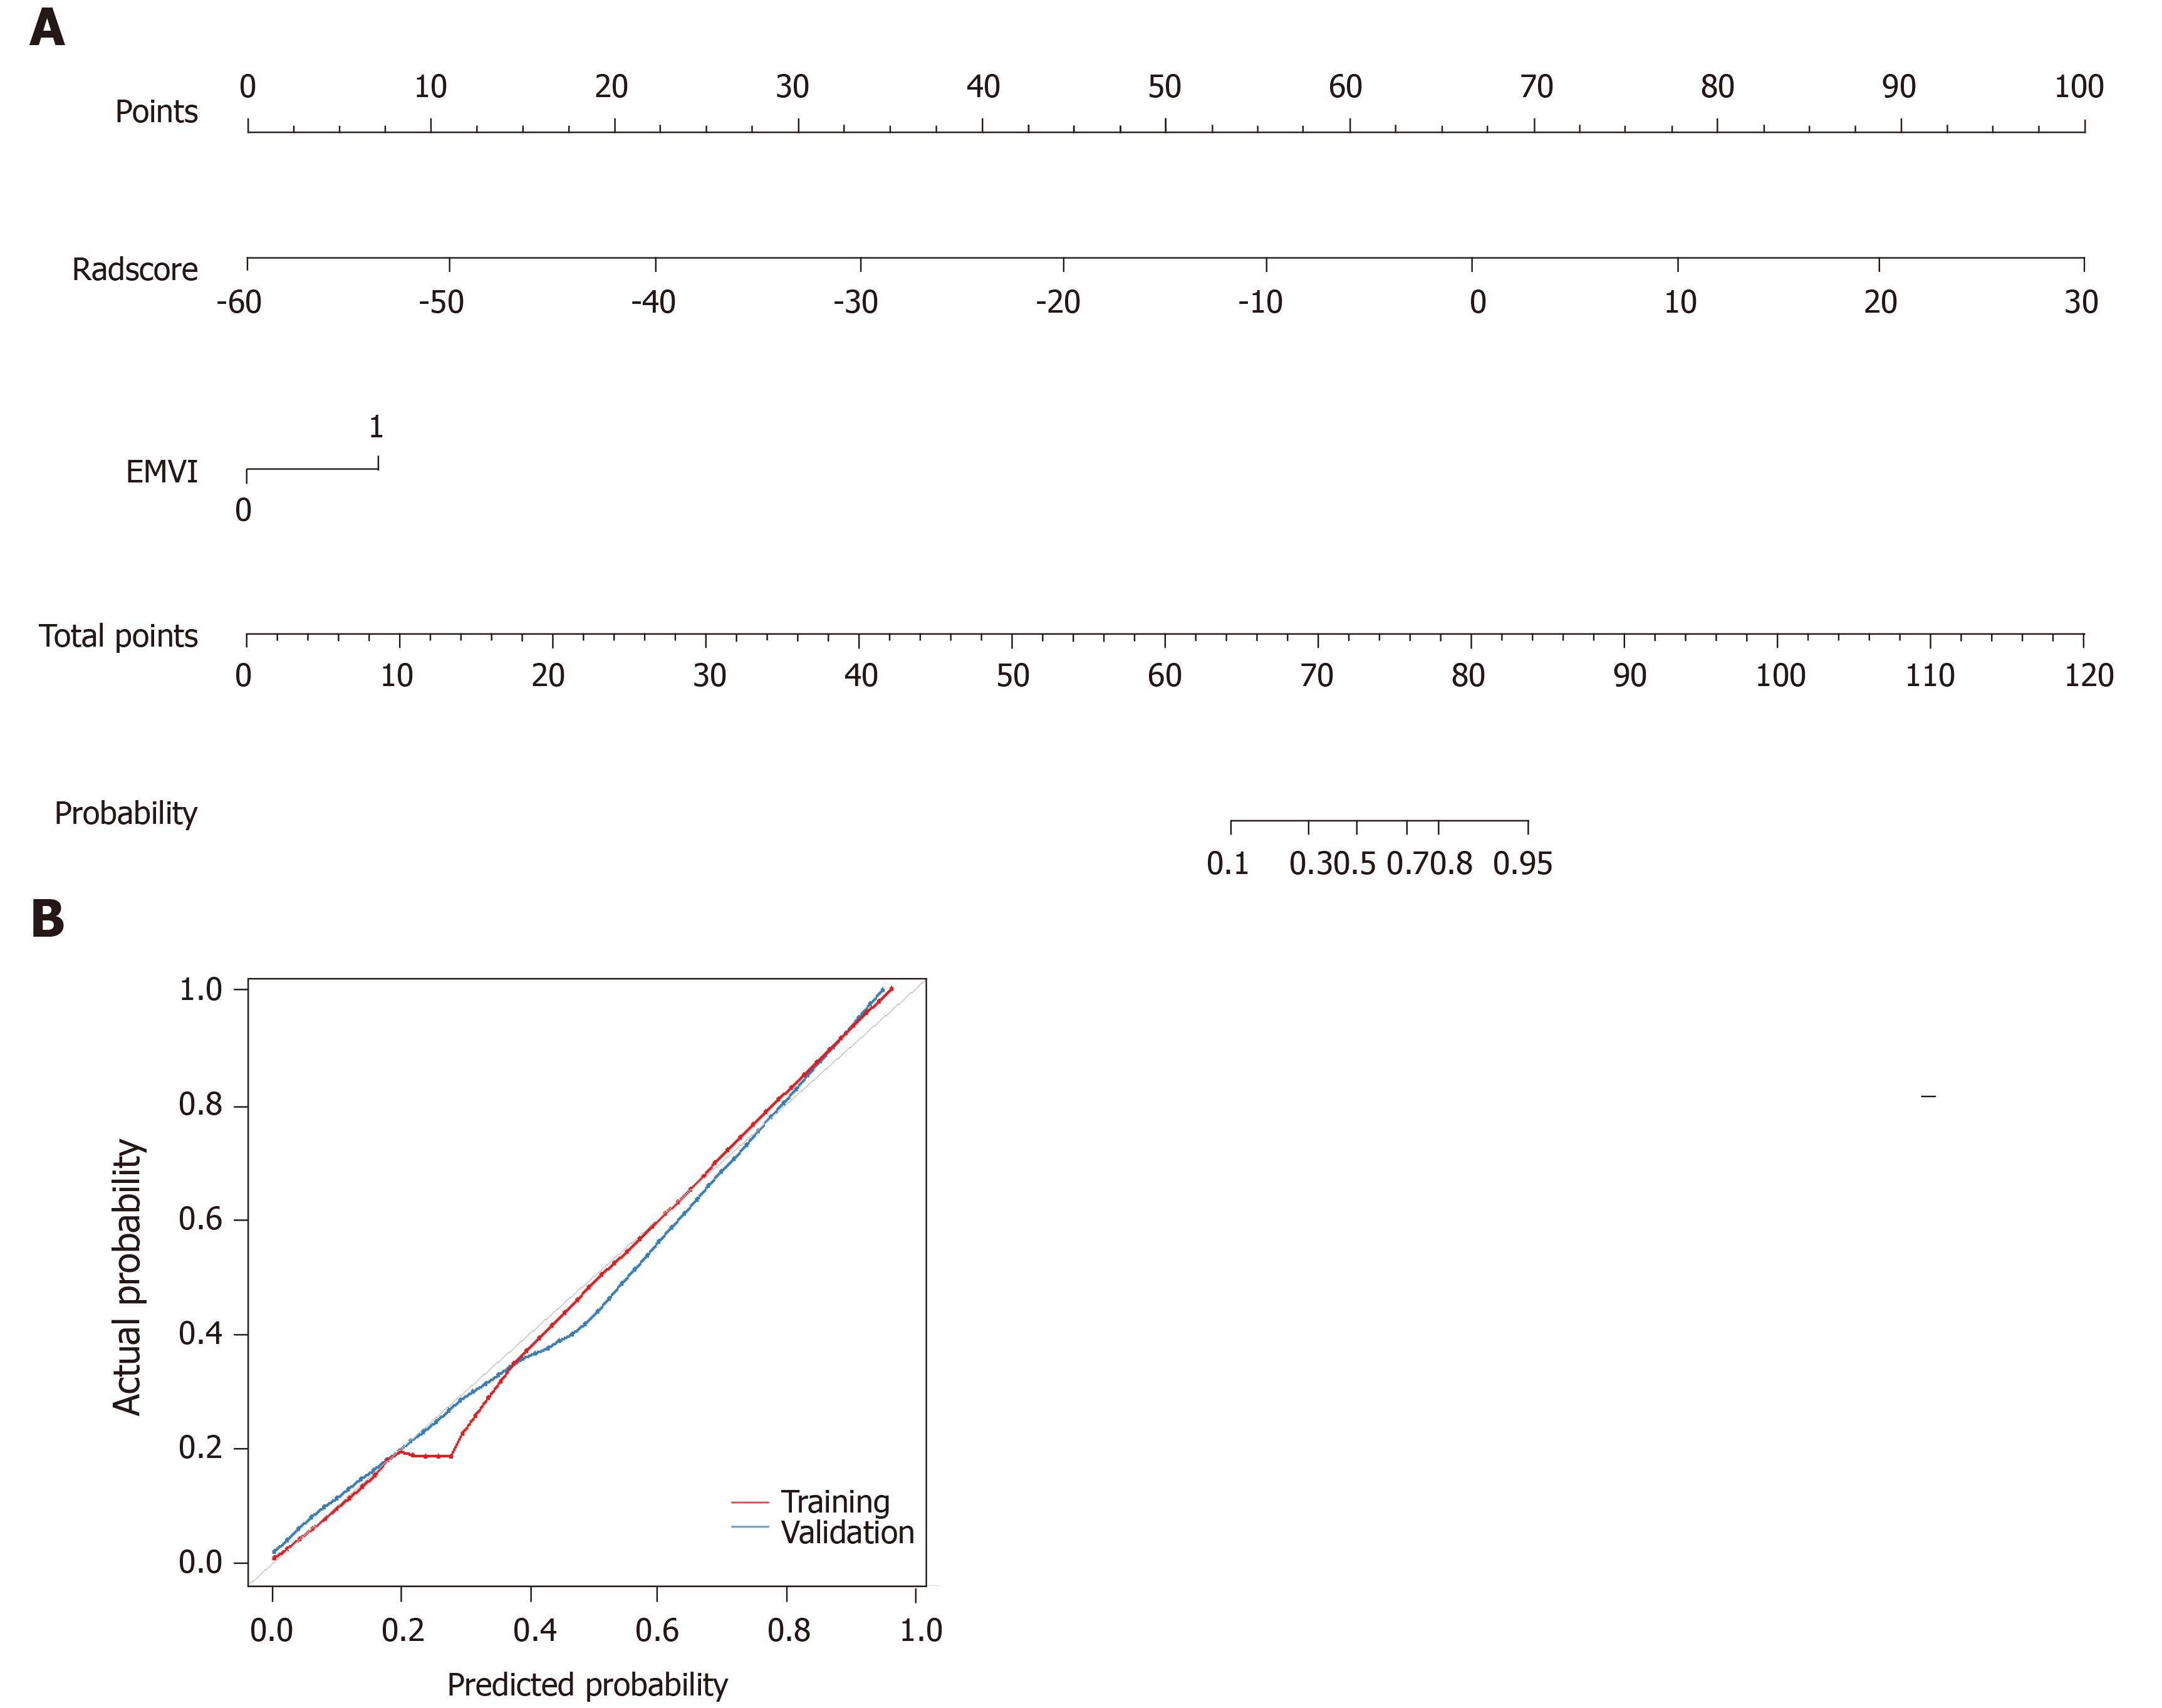
Figure 5 Development of predictive nomograms.
A: From each variable location on the corresponding axis, a line was drawn straight upward to the point axis and a point was obtained. After adding up all points, a line from the total points axis was drawn to the bottom line to determine the probability of response to neoadjuvant chemotherapy; B: Calibration curves for the radiomics nomogram in the training and validation cohort. The actual outcome of response to neoadjuvant chemotherapy is represented on the y-axis, and the predicted probability is represented on the x-axis. The closer the fit of the diagonal red and blue lines to the ideal grey line indicates the predictive accuracy of the nomogram. EMVI: Extramural venous invasion.
- Citation: Li ZY, Wang XD, Li M, Liu XJ, Ye Z, Song B, Yuan F, Yuan Y, Xia CC, Zhang X, Li Q. Multi-modal radiomics model to predict treatment response to neoadjuvant chemotherapy for locally advanced rectal cancer. World J Gastroenterol 2020; 26(19): 2388-2402
- URL: https://www.wjgnet.com/1007-9327/full/v26/i19/2388.htm
- DOI: https://dx.doi.org/10.3748/wjg.v26.i19.2388


