Copyright
©The Author(s) 2020.
World J Gastroenterol. Apr 14, 2020; 26(14): 1628-1637
Published online Apr 14, 2020. doi: 10.3748/wjg.v26.i14.1628
Published online Apr 14, 2020. doi: 10.3748/wjg.v26.i14.1628
Figure 1 Computed tomography and pathologic findings of case 1.
A: Abdominal computed tomography images on admission demonstrate hepatic portal venous gas, ascites; B: Intestinal pneumatosis (arrow); C: The resected small intestine shows hemorrhagic necrosis; D: Air-bubbles in the damaged intestinal wall (arrow).
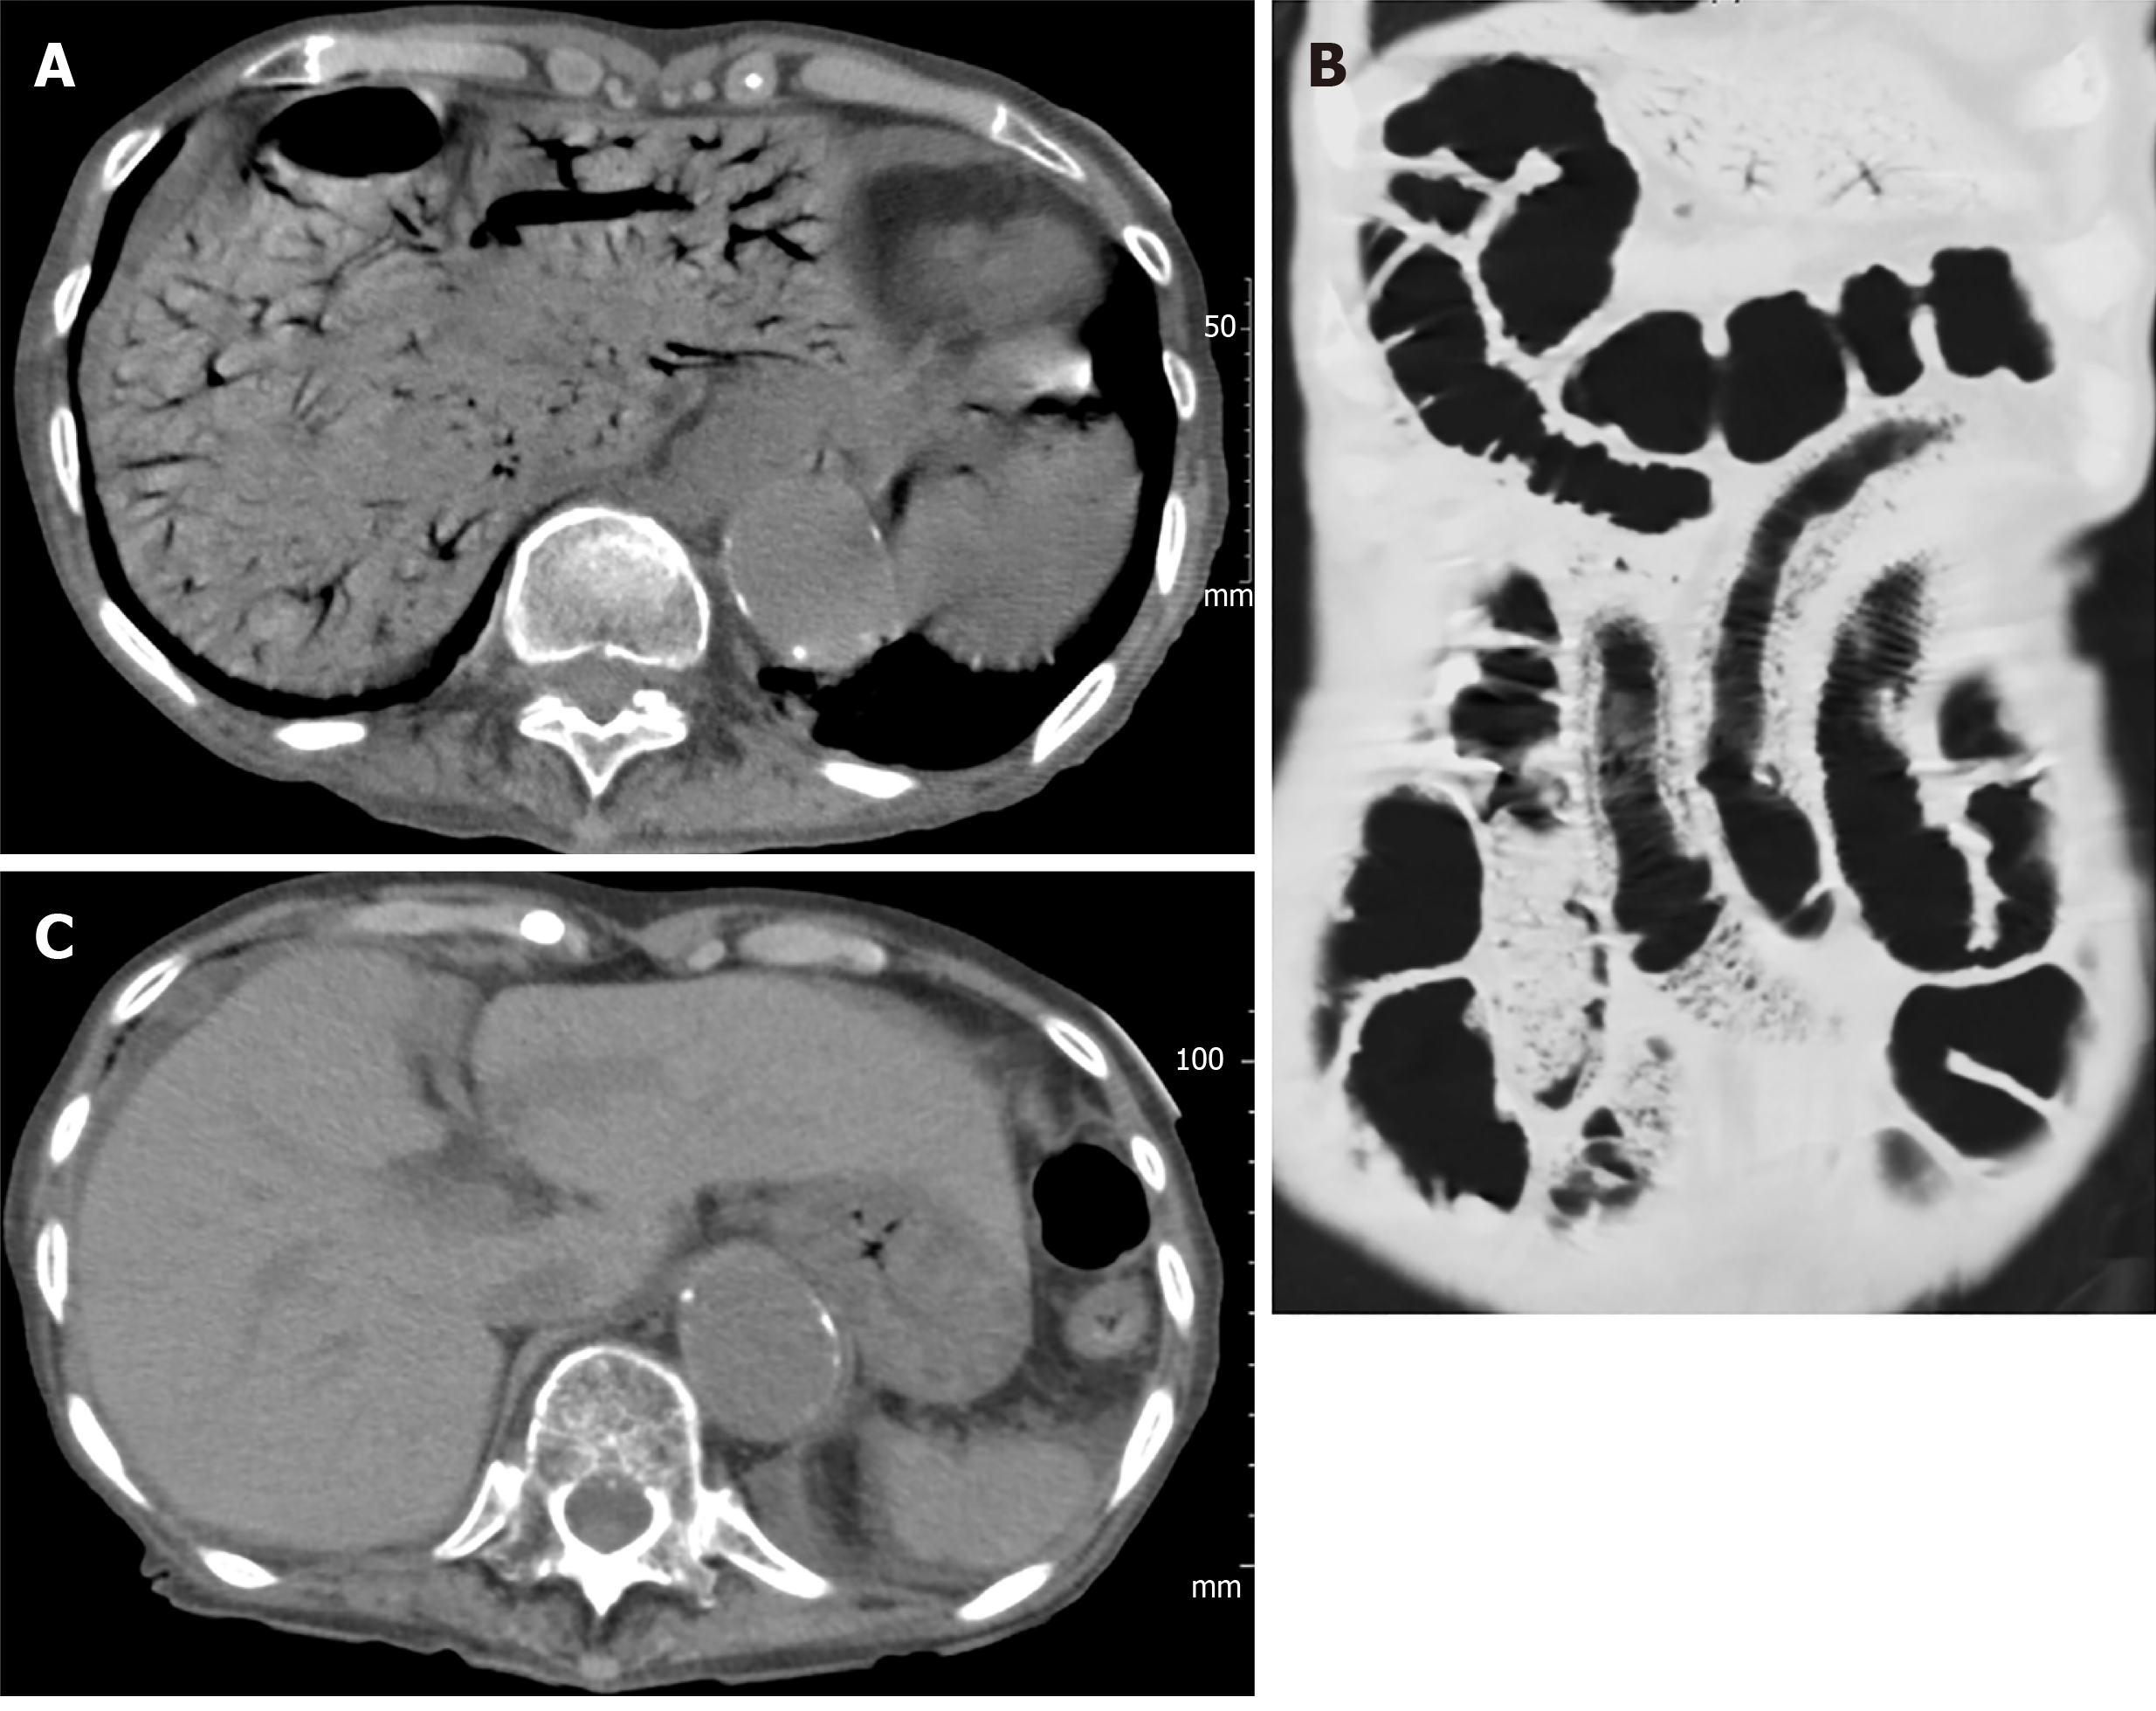
Figure 2 Abdominal computed tomography images of case 2.
A: Extensive hepatic portal venous gas; B: Intestinal pneumatosis were found on the first hospital day; C: However, hepatic portal venous gas disappeared on the seventh hospital day.
Figure 3 Abdominal computed tomography images of case 3 on admission.
Left lobe hepatic portal venous gas and the moderate amount of ascites are seen.
Figure 4 A treatment decision flowchart and outcomes.
CT: Computed tomography; HPVG: Hepatic portal venous gas.
- Citation: Gonda M, Osuga T, Ikura Y, Hasegawa K, Kawasaki K, Nakashima T. Optimal treatment strategies for hepatic portal venous gas: A retrospective assessment. World J Gastroenterol 2020; 26(14): 1628-1637
- URL: https://www.wjgnet.com/1007-9327/full/v26/i14/1628.htm
- DOI: https://dx.doi.org/10.3748/wjg.v26.i14.1628


