Copyright
©The Author(s) 2019.
World J Gastroenterol. Oct 21, 2019; 25(39): 6025-6040
Published online Oct 21, 2019. doi: 10.3748/wjg.v25.i39.6025
Published online Oct 21, 2019. doi: 10.3748/wjg.v25.i39.6025
Figure 1 Flowchart showing the process of study selection for the systematic review.
We identified 211 records. Totally 201 records were excluded as duplicated records, non-clinical trials, unrelated articles, and non-PTT/BCQT controlled trail. Another two records were excluded after full-text screening due to non-standard triple therapy of amoxicillin-bismuth-PPI and different triple therapy regimens in the allicin and control groups, respectively. Finally, a total of eight RCTs with 867 subjects were included. CNKI: the China National Knowledge Infrastructure Database; CMB: Chinese Medical Databases.
Figure 2 Eradication rates of Helicobacter pylori between allicin and control groups (intent-to-treat analysis).
The eradication rate of the allicin group (93.33%, 406/435) was significantly higher than that of the control group (83.56%, 361/432) for intent-to-treat (ITT) analysis (Odds ratio = 2.75, 95% confidence interval: 1.74-4.35), P < 0.001). CI: Confidence interval.
Figure 3 Healing rates of peptic ulcers between allicin and control groups (intent-to-treat analysis).
The healing rate of ulcers after H. pylori eradication therapy in the allicin group was significantly higher that of the control group for ITT analysis (86.17% (349/405) vs 75.87% (305/402), odds ratio = 2.05, 95% confidence interval: 1.39-3.03, P < 0.001). CI: Confidence interval.
Figure 4 Total remission rates of peptic ulcers between allicin and control groups (intent-to-treat/per-protocol analysis).
The total remission rate across allicin groups was significantly higher than that of the control group for ITT/PP analyses [95.99% (359/374) vs 89.25% (332/372), odds ratio = 3.13, 95% confidence interval: 1.51-6.51, P = 0.002]. CI: Confidence interval.
Figure 5 Side effect rates between allicin and control groups (intent-to-treat/per-protocol analysis).
There was no statistical significance in side effect rates between the allicin group and control group for ITT analysis [5.90% (18/305) vs 9.53% (29/304), odds ratio = 0.61, 95% confidence interval: 0.32-1.16, P = 0.133]. CI: Confidence interval.
Figure 6 Abdominal pain disappearance times between allicin and control groups.
Meta-analysis showed more rapid cessation of abdominal pain in the allicin group (standard mean difference = -0.653, 95% confidence interval: -0.88--0.43, P < 0.001). CI: Confidence interval; Std diff in means: Standard difference in means.
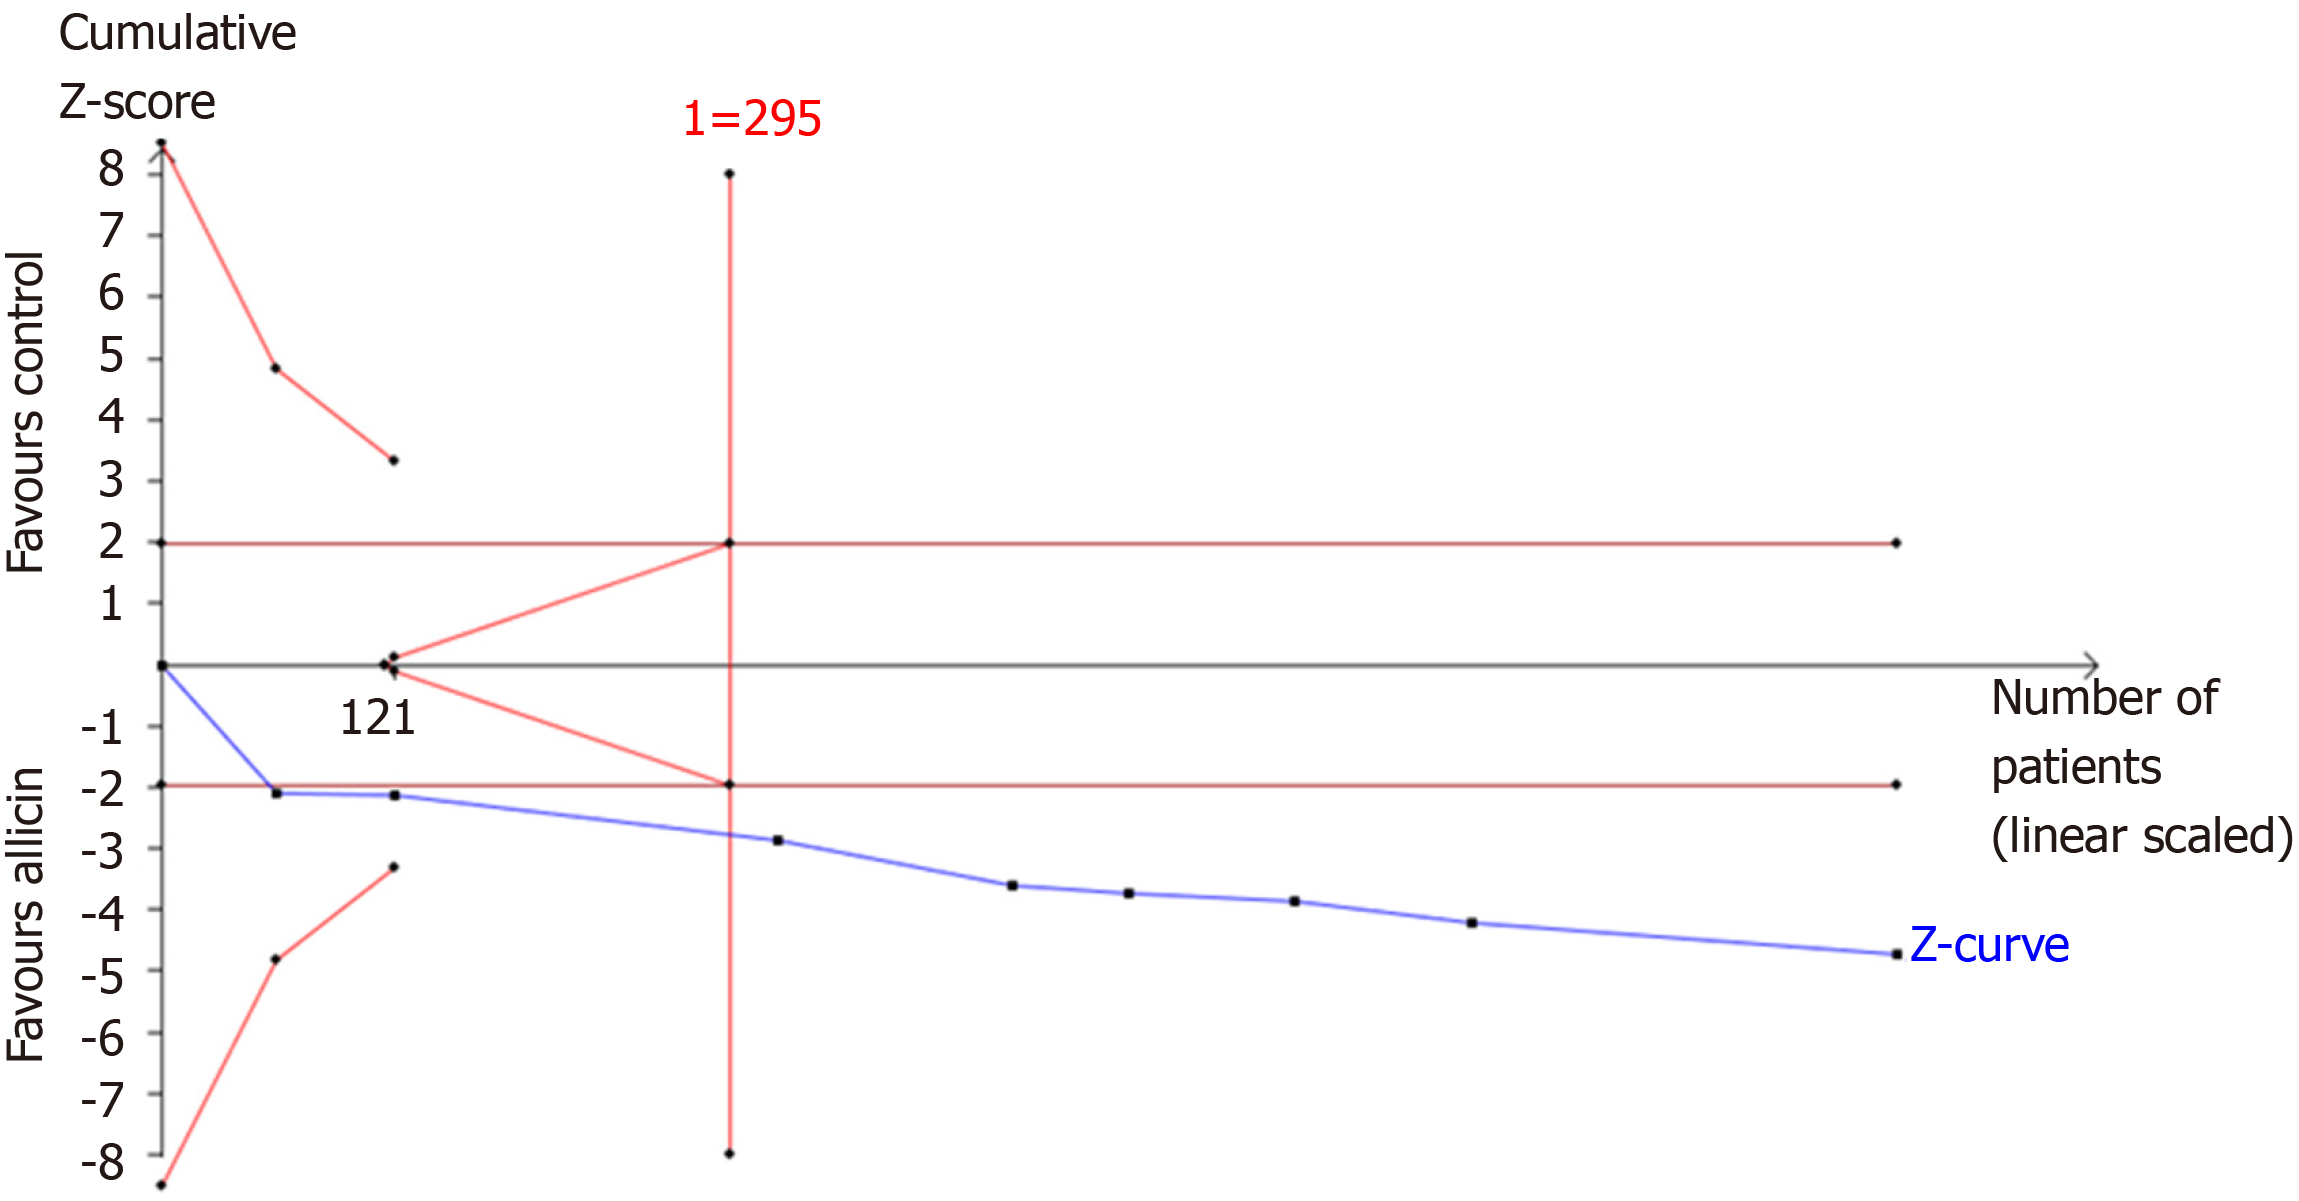
Figure 7 Trial sequential analysis of the eradication rates.
Trial sequential analysis of the eradication rates showed that an information size of 295 participants was required. Cumulative Z-curve crossed the trial sequential monitoring boundary, showing significant evidence of eradication rates. The cumulative values of the Z scores crossed conventional boundary values, trial sequential monitoring boundaries, and RIS line, suggesting that the trials were sufficient, and no alterations of the conclusions were likely.
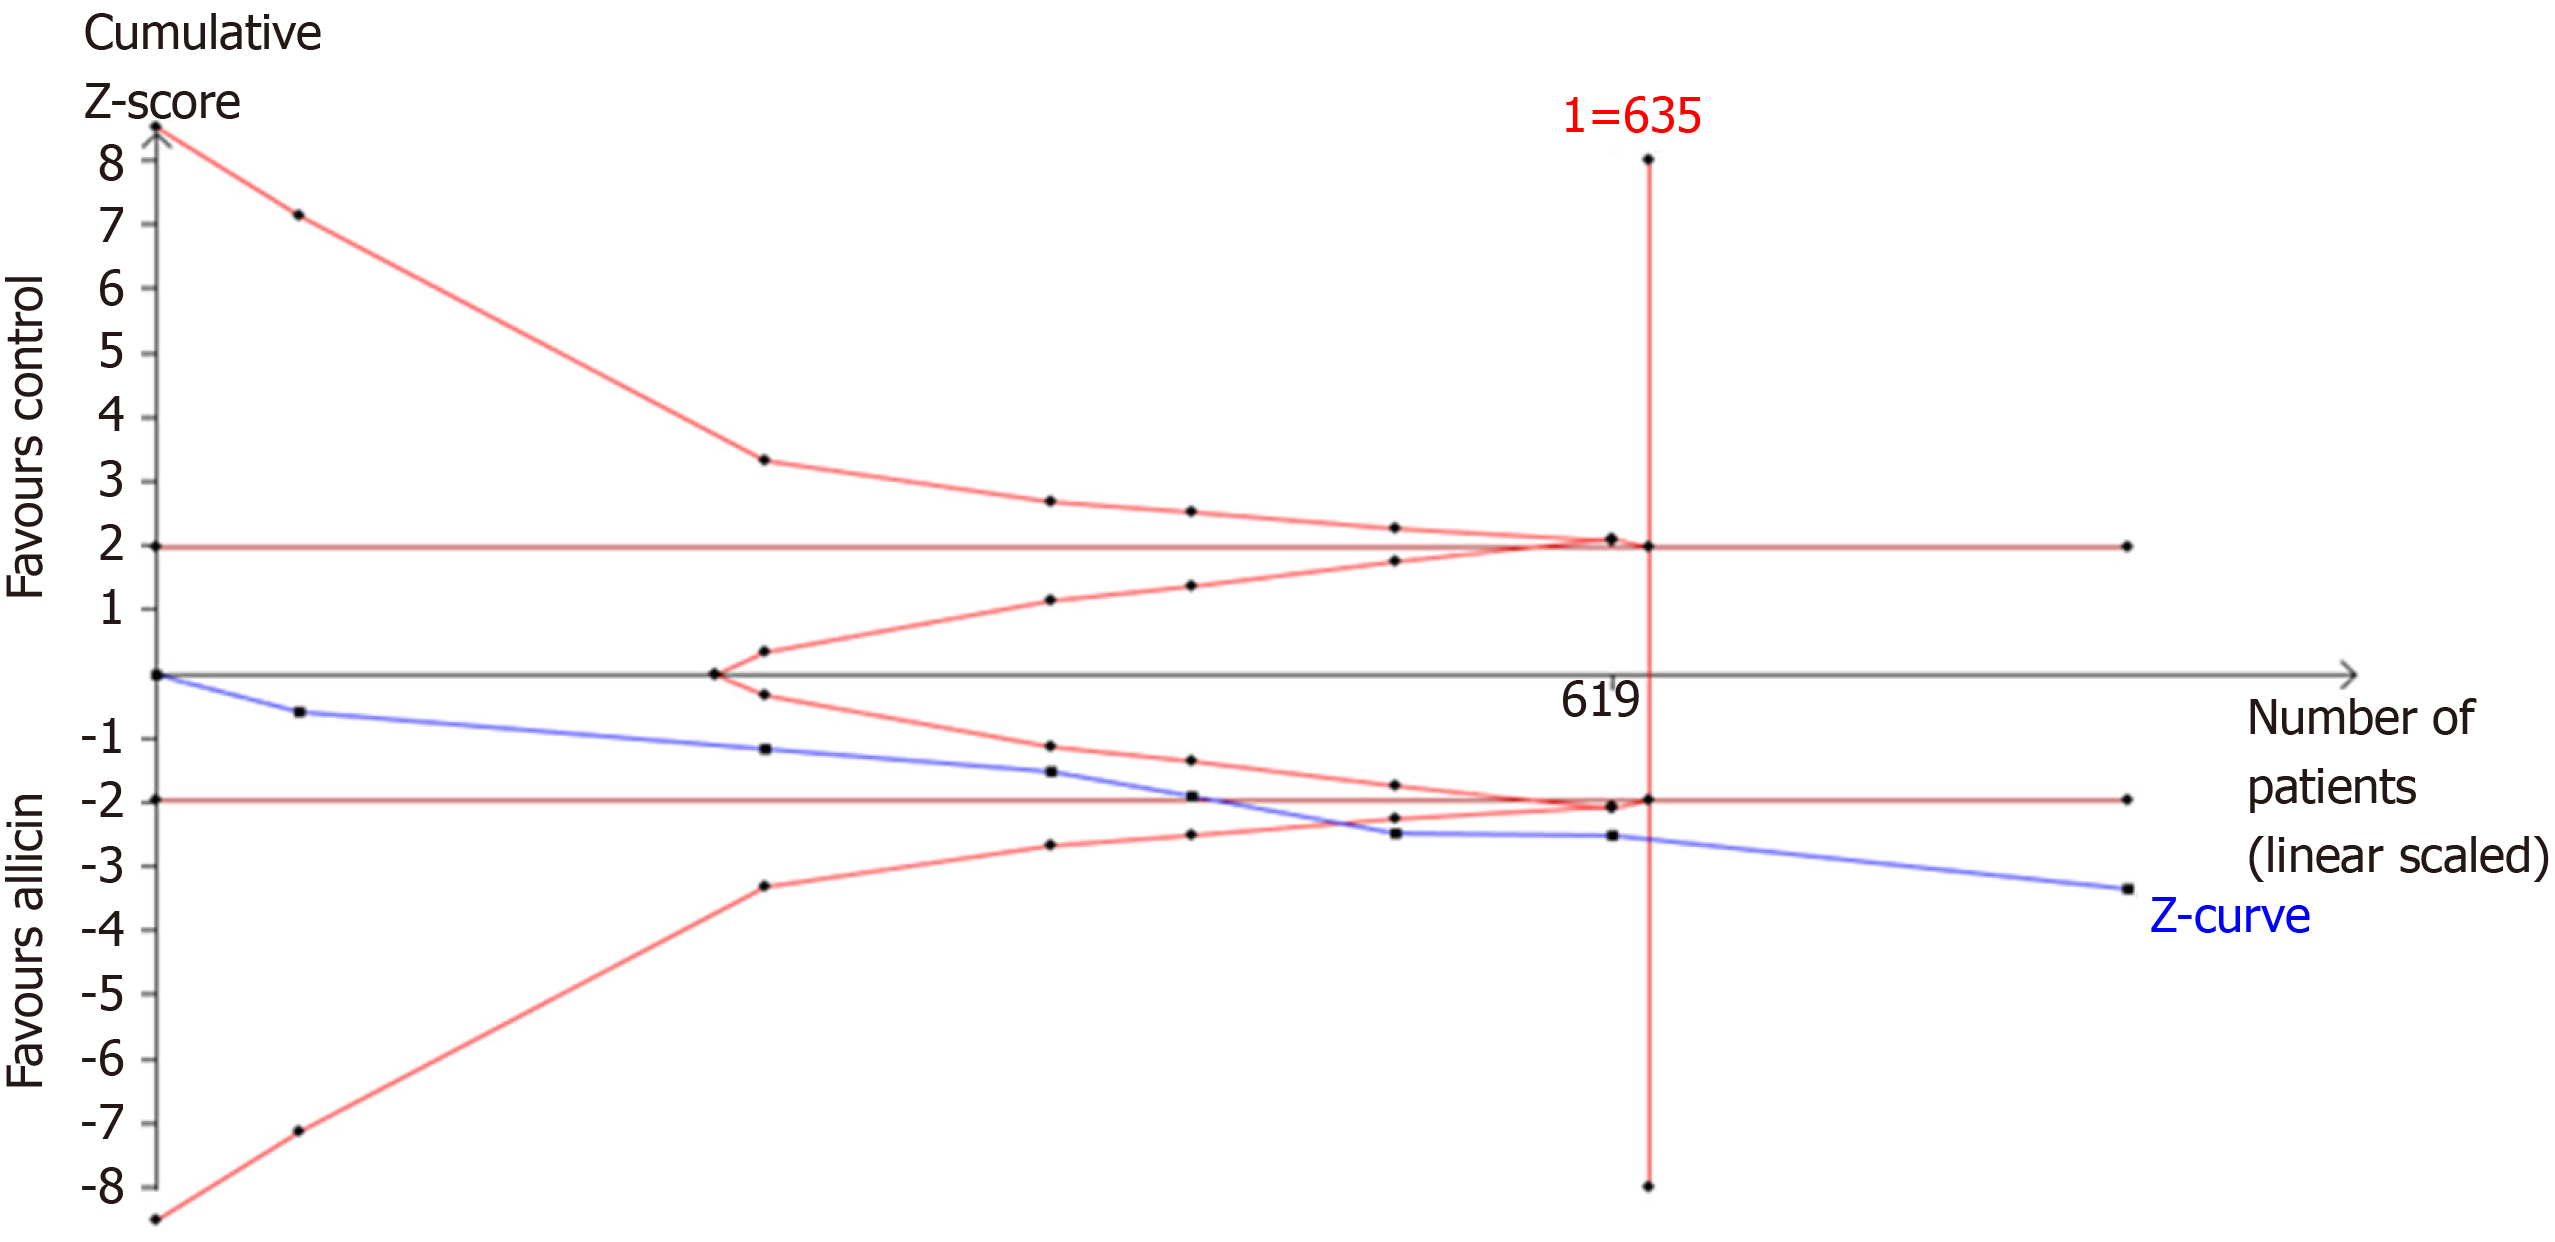
Figure 8 Trial sequential analysis of the healing rates of peptic ulcers.
Trial sequential analysis of the healing rates showed that an information size of 635 participants was required. Cumulative Z-curve crossed the trial sequential monitoring boundary, showing significant evidence of eradication rates. The cumulative values of the Z scores crossed conventional boundary values, trial sequential monitoring boundaries, and RIS line, suggesting that the trials were sufficient, and no alterations of the conclusions were likely.
- Citation: Si XB, Zhang XM, Wang S, Lan Y, Zhang S, Huo LY. Allicin as add-on therapy for Helicobacter pylori infection: A systematic review and meta-analysis. World J Gastroenterol 2019; 25(39): 6025-6040
- URL: https://www.wjgnet.com/1007-9327/full/v25/i39/6025.htm
- DOI: https://dx.doi.org/10.3748/wjg.v25.i39.6025


