Copyright
©The Author(s) 2019.
World J Gastroenterol. Oct 21, 2019; 25(39): 5973-5990
Published online Oct 21, 2019. doi: 10.3748/wjg.v25.i39.5973
Published online Oct 21, 2019. doi: 10.3748/wjg.v25.i39.5973
Figure 1 Differentially expressed long noncoding RNAs between tumor tissue and adjacent nontumor tissue samples.
A: Volcano map for differentially expressed long noncoding RNAs (lncRNAs); B: Heat map for differentially expressed lncRNAs. FDR: False discovery rate; FC: Fold change.
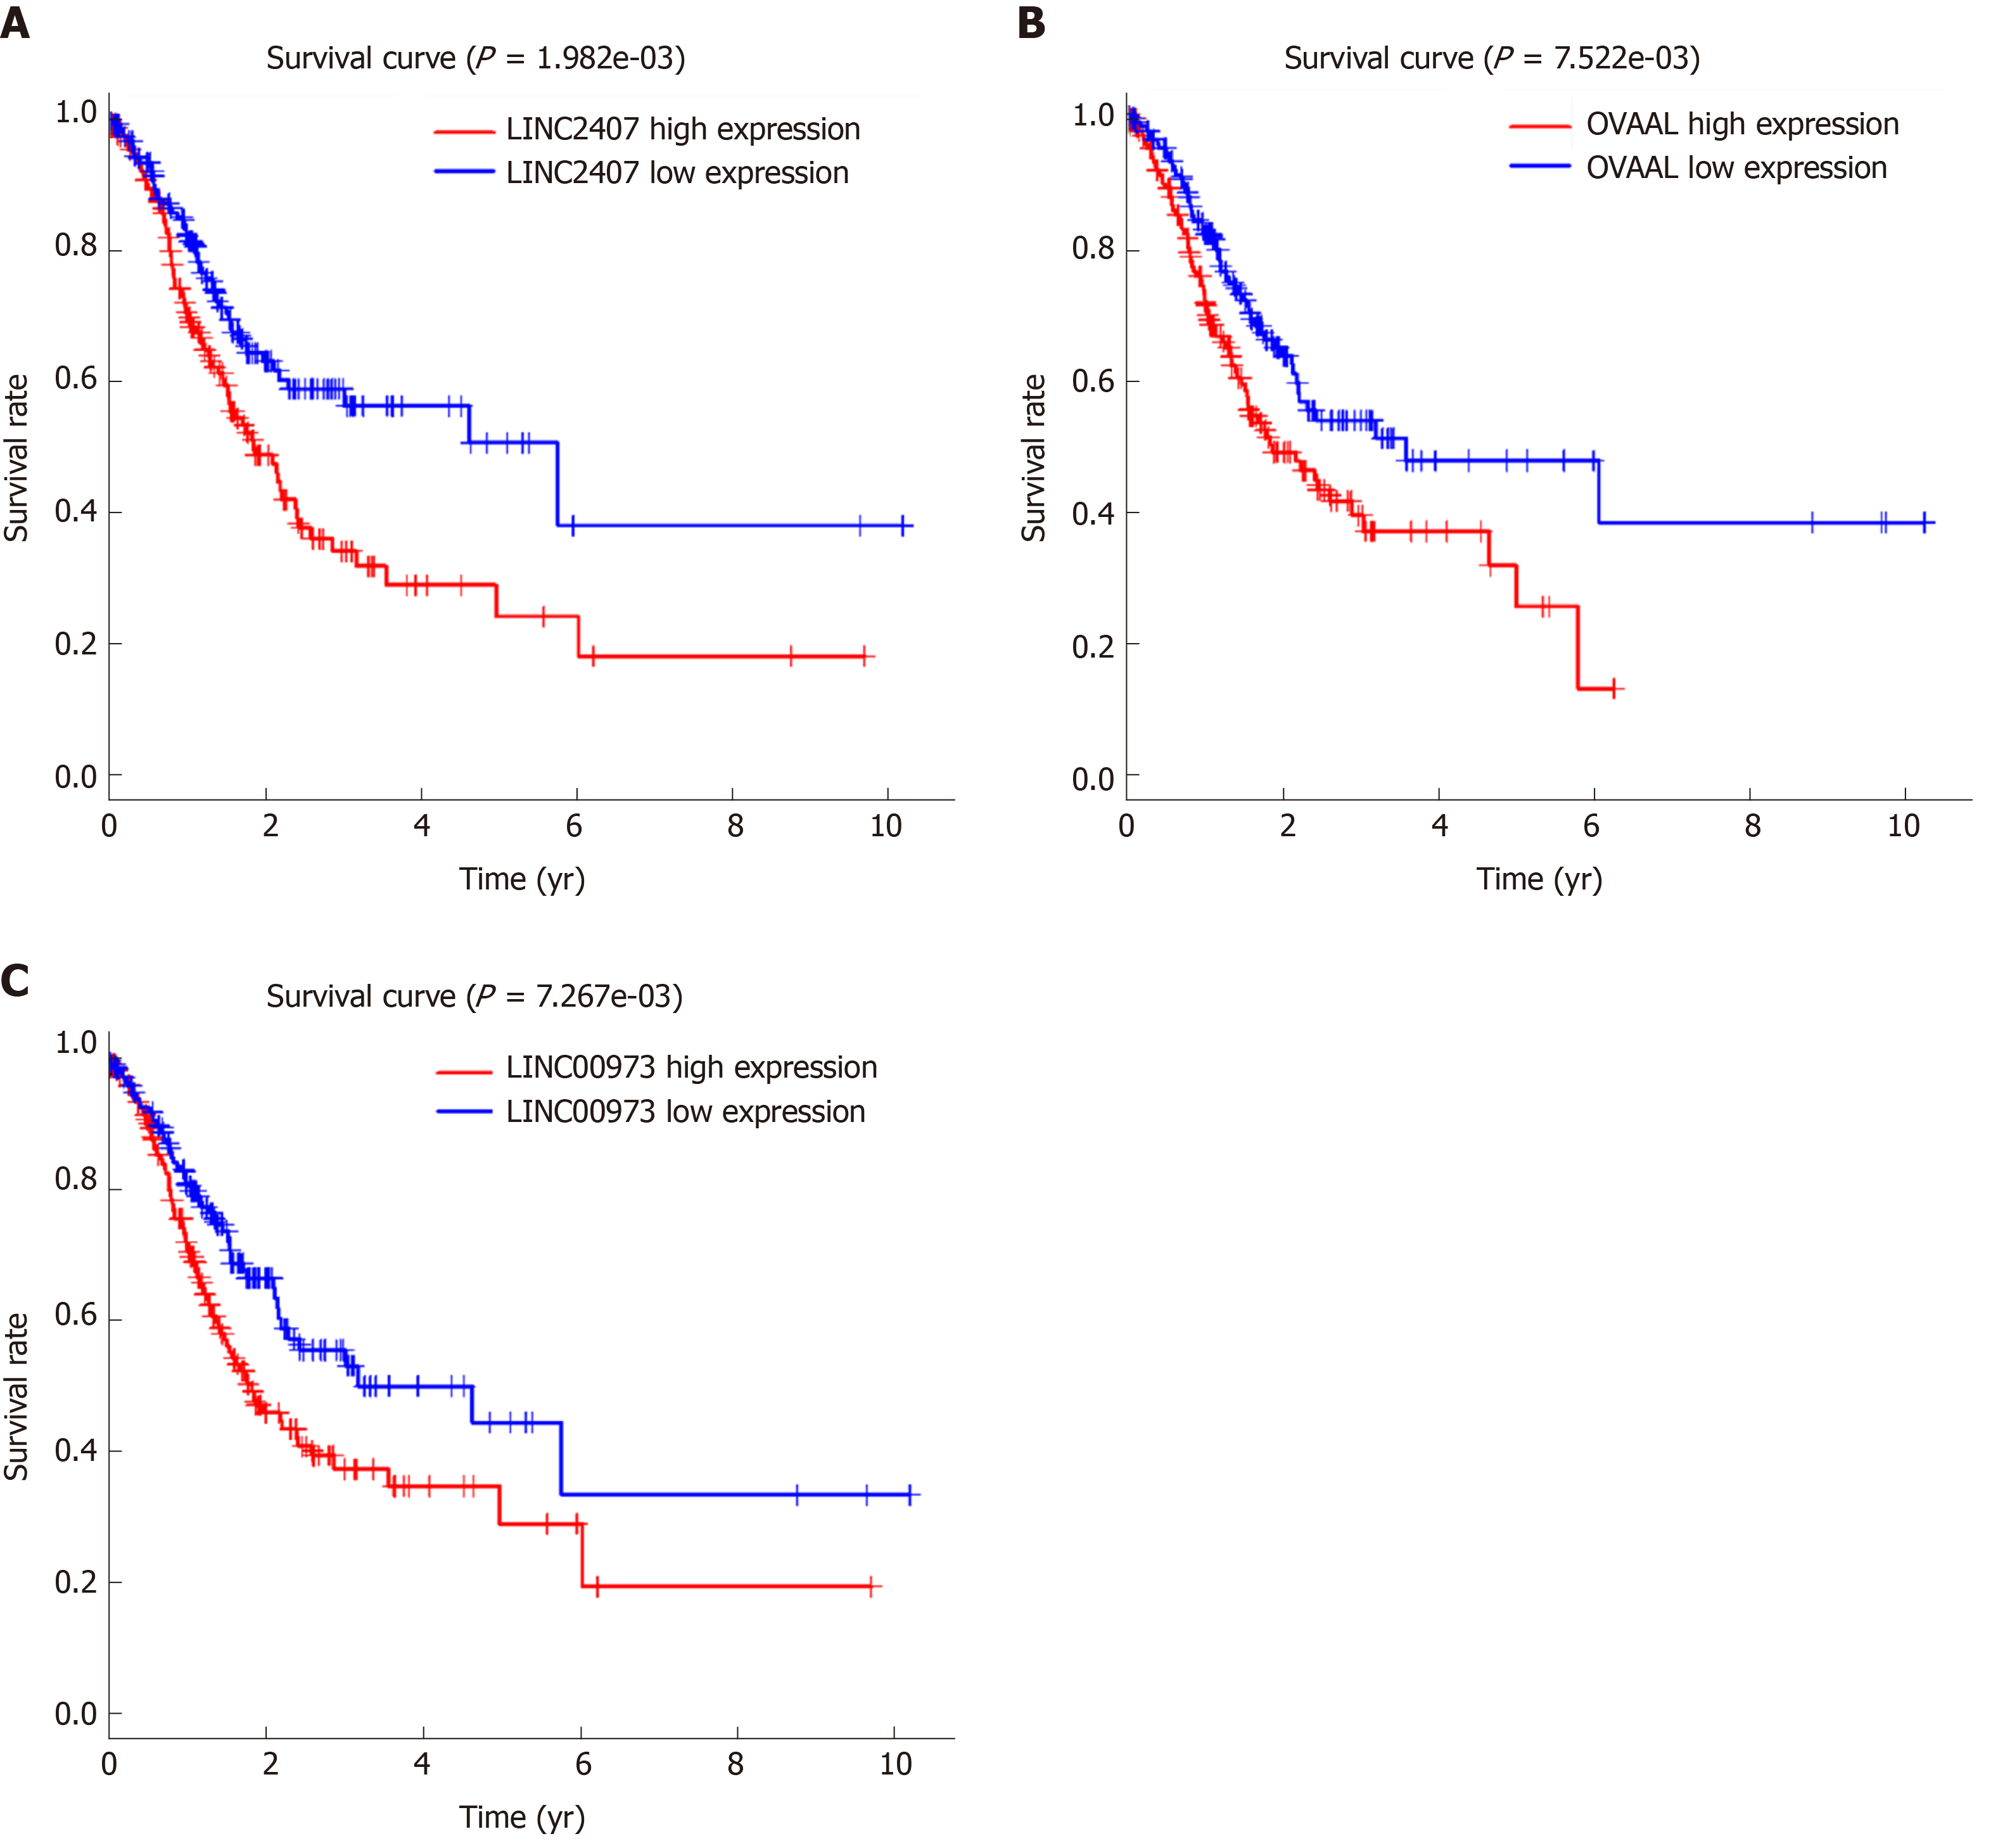
Figure 2 Kaplan-Meier survival curves for three long noncoding RNAs associated with overall survival.
Kaplan-Meier analysis and log-rank test were performed to estimate the relations between (A) LINC02407, (B) OVAAL, and (C) LINC00973 expression and the overall survival of gastric cancer (GC) patients. OVAAL: Ovarian adenocarcinoma amplified long non-coding RNA.
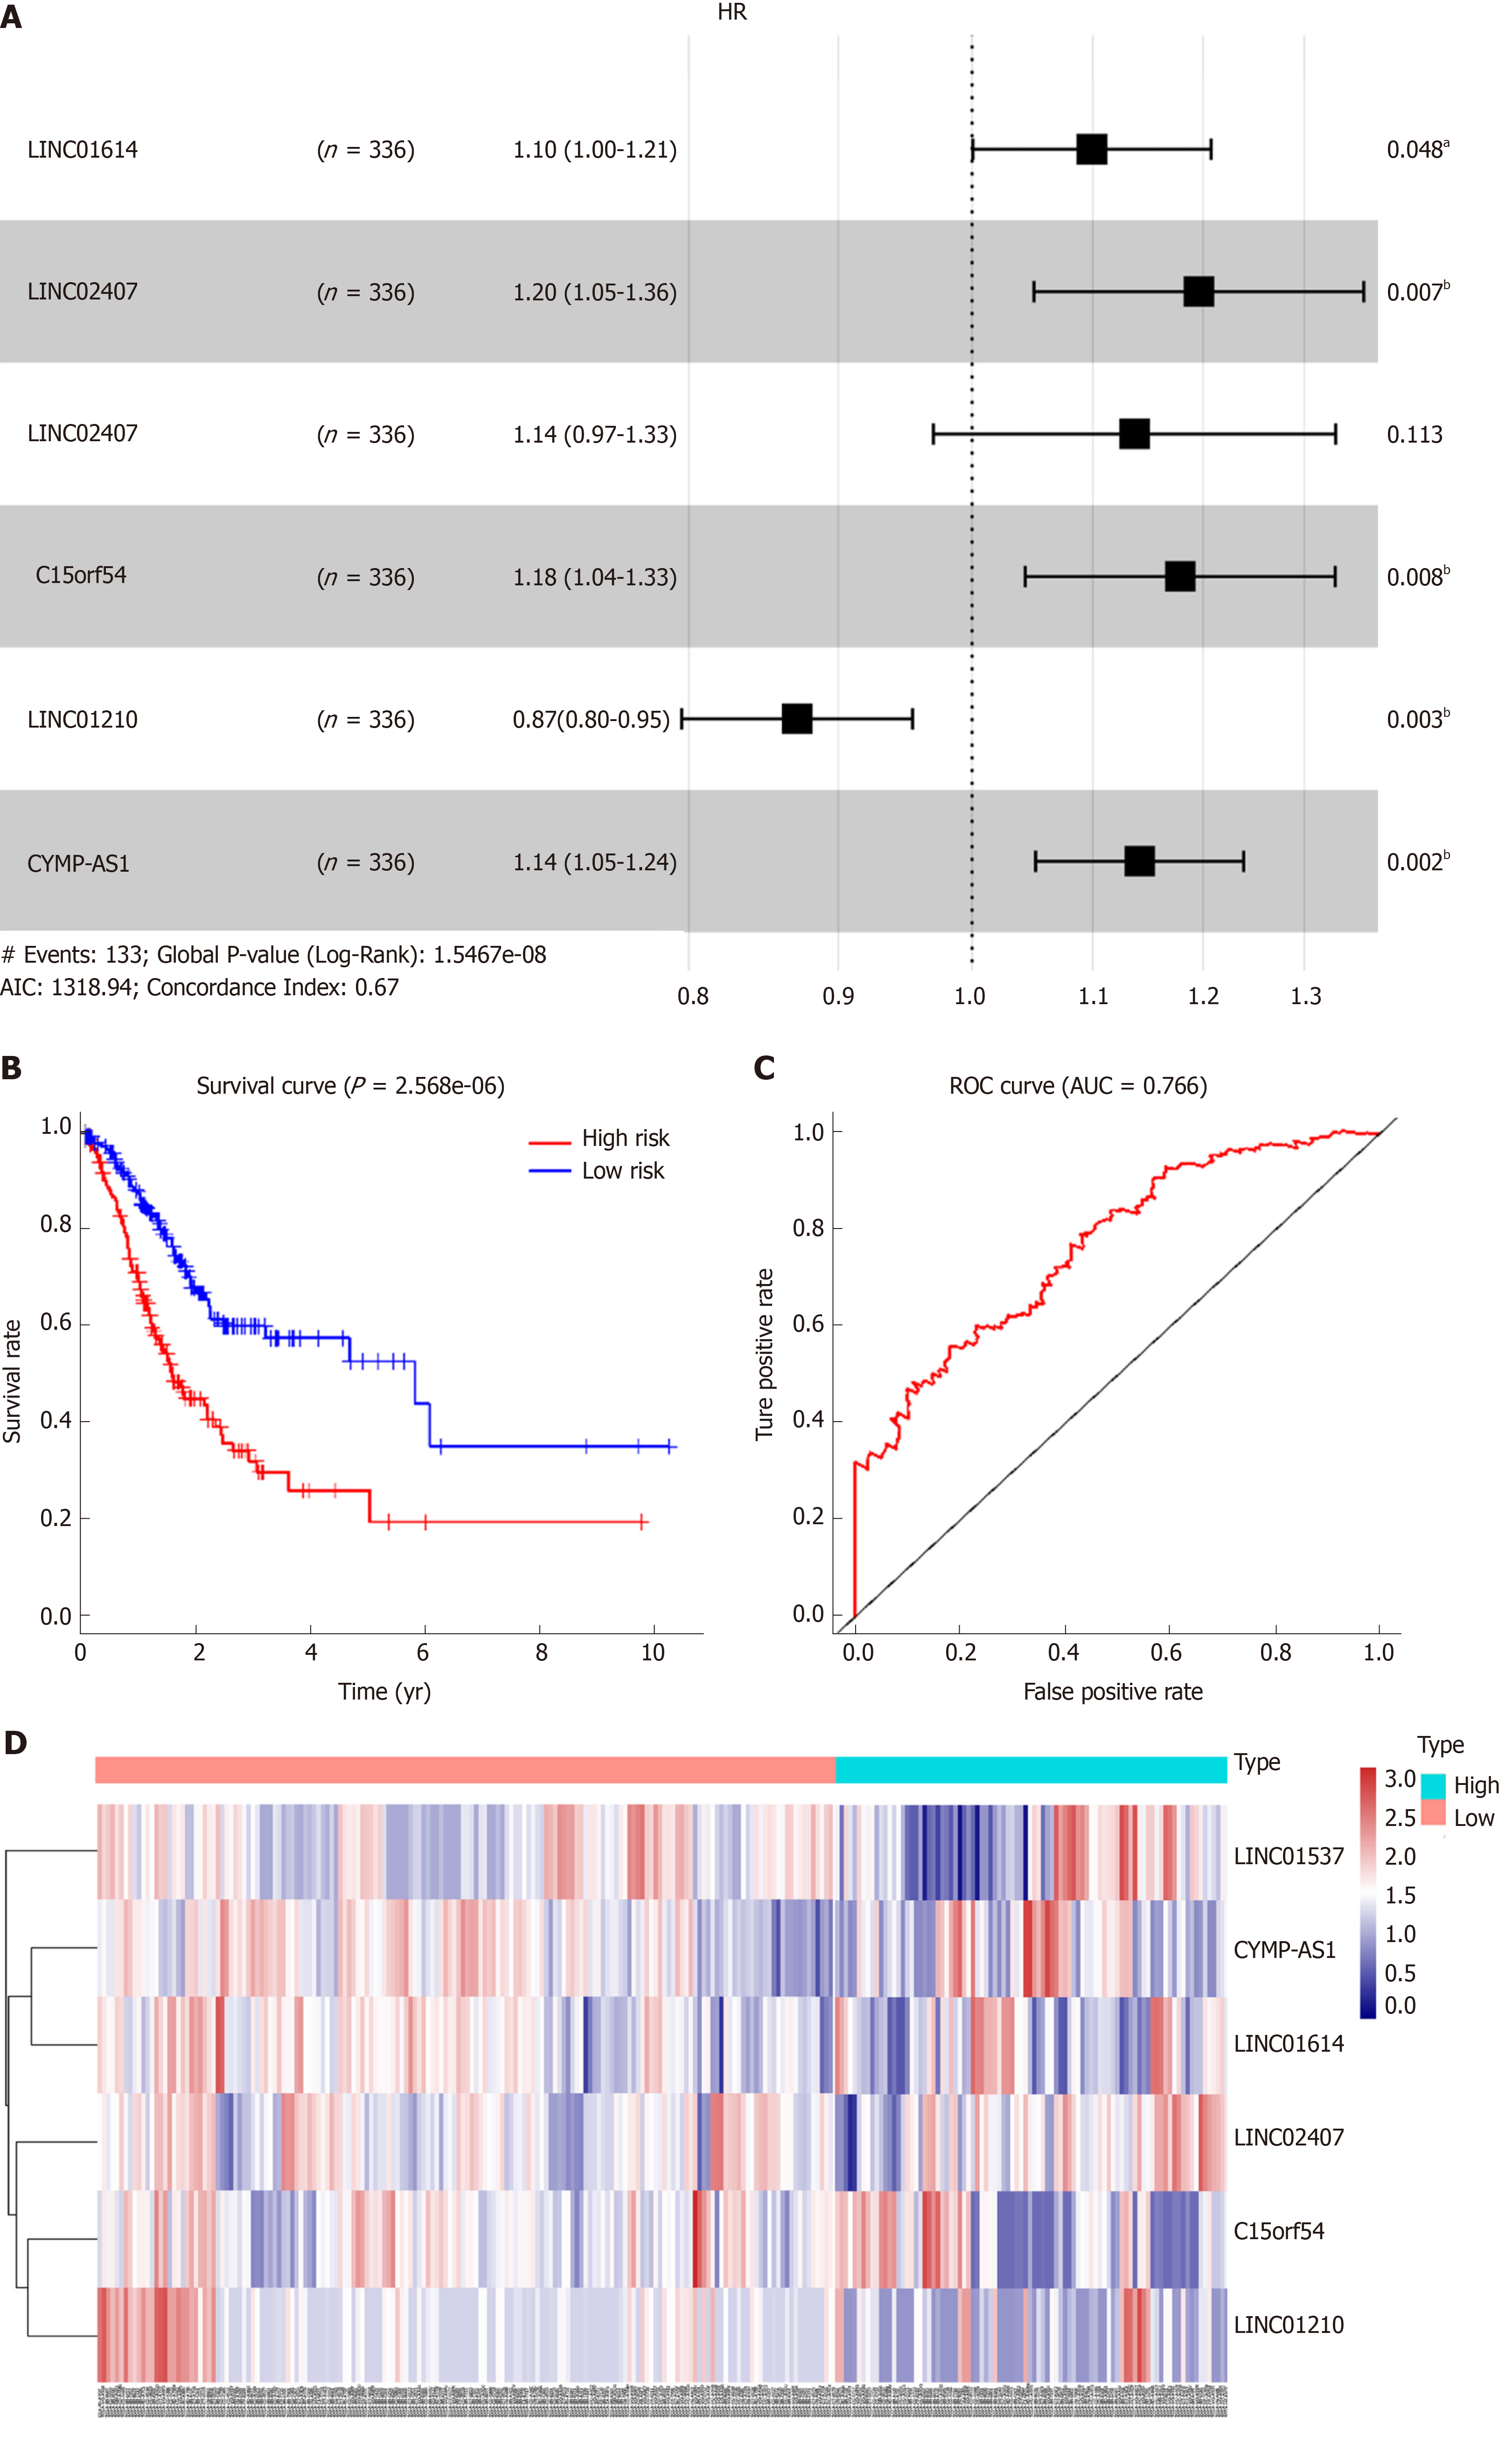
Figure 3 Association between long noncoding RNA expression and survival.
A: Forest plot showing the hazard ratio (HR) and P value for overall survival (OS) in patients with gastric cancer (GC) based on long noncoding RNA (lncRNA) high vs low expression; B: Kaplan-Meier analysis of OS according lncRNA expression levels; C: Receiver operating characteristic curve analysis based on a forest plot showing the hazard ratio and OS; D: HR heatmap representing associations between LIN01614, LIN01537, LIN02407, C15orf54, and CYMP-AS1 expression and OS in patients with different clinicopathological characteristics. Only HRs with P values less than 0.05 are shown. HR: Hazard ratio; ROC: Receiver operating characteristic; AUC: Area under curve.
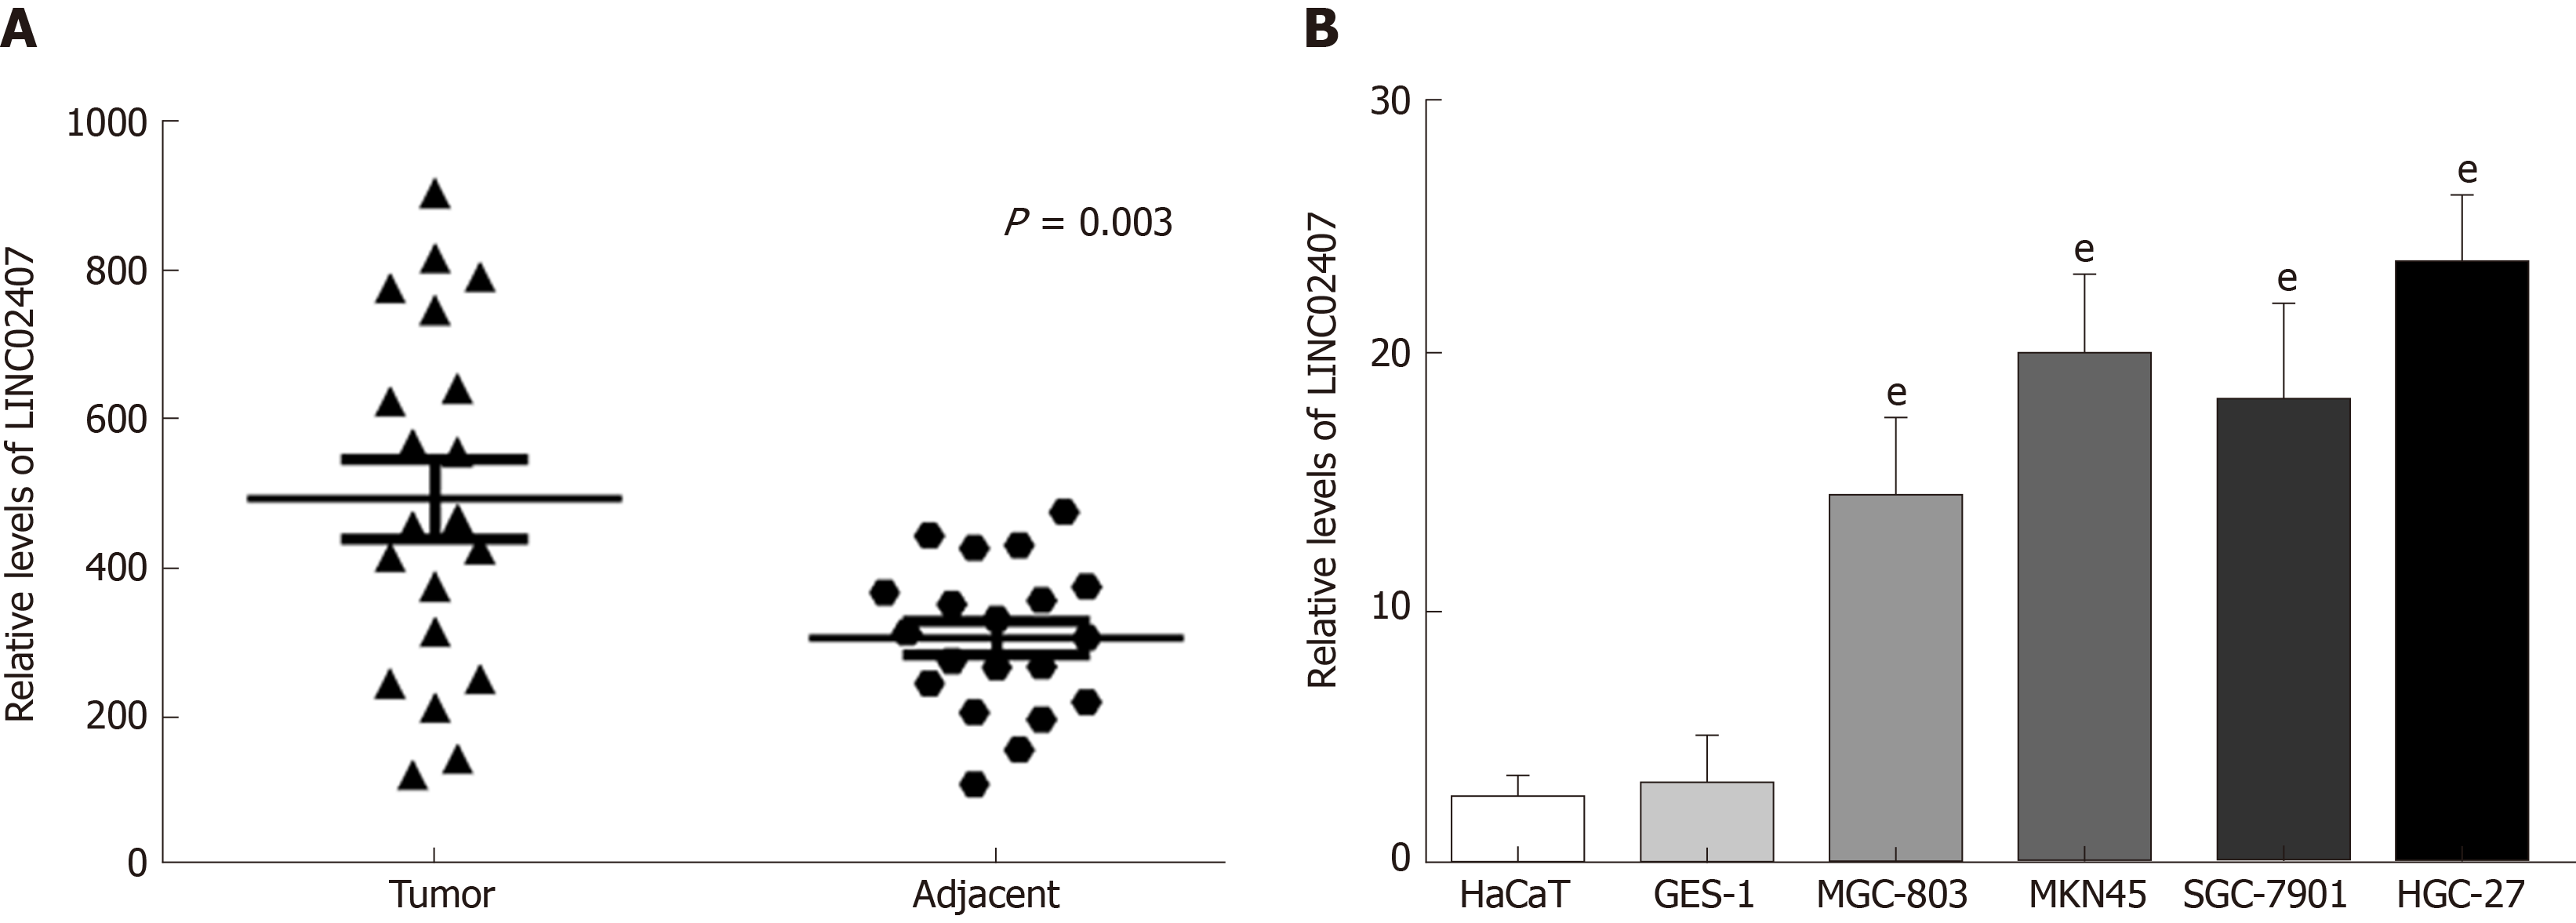
Figure 4 LINC02407 is upregulated in clinical gastric cancer specimens and cell lines.
A: The relative expression of LINC02407 determined by qRT-PCR in 20 paired gastric cancer tissues and adjacent normal tissues; B: The relative expression of LINC02407 determined by q-RT-PCR in six cell lines (HaCaT, GES-1, MGC-803, MKN45, SGC-7901, and HGC-27). Data are reported as the mean ± SD. aP < 0.05, bP < 0.01, and eP < 0.001 for between-group comparisons.
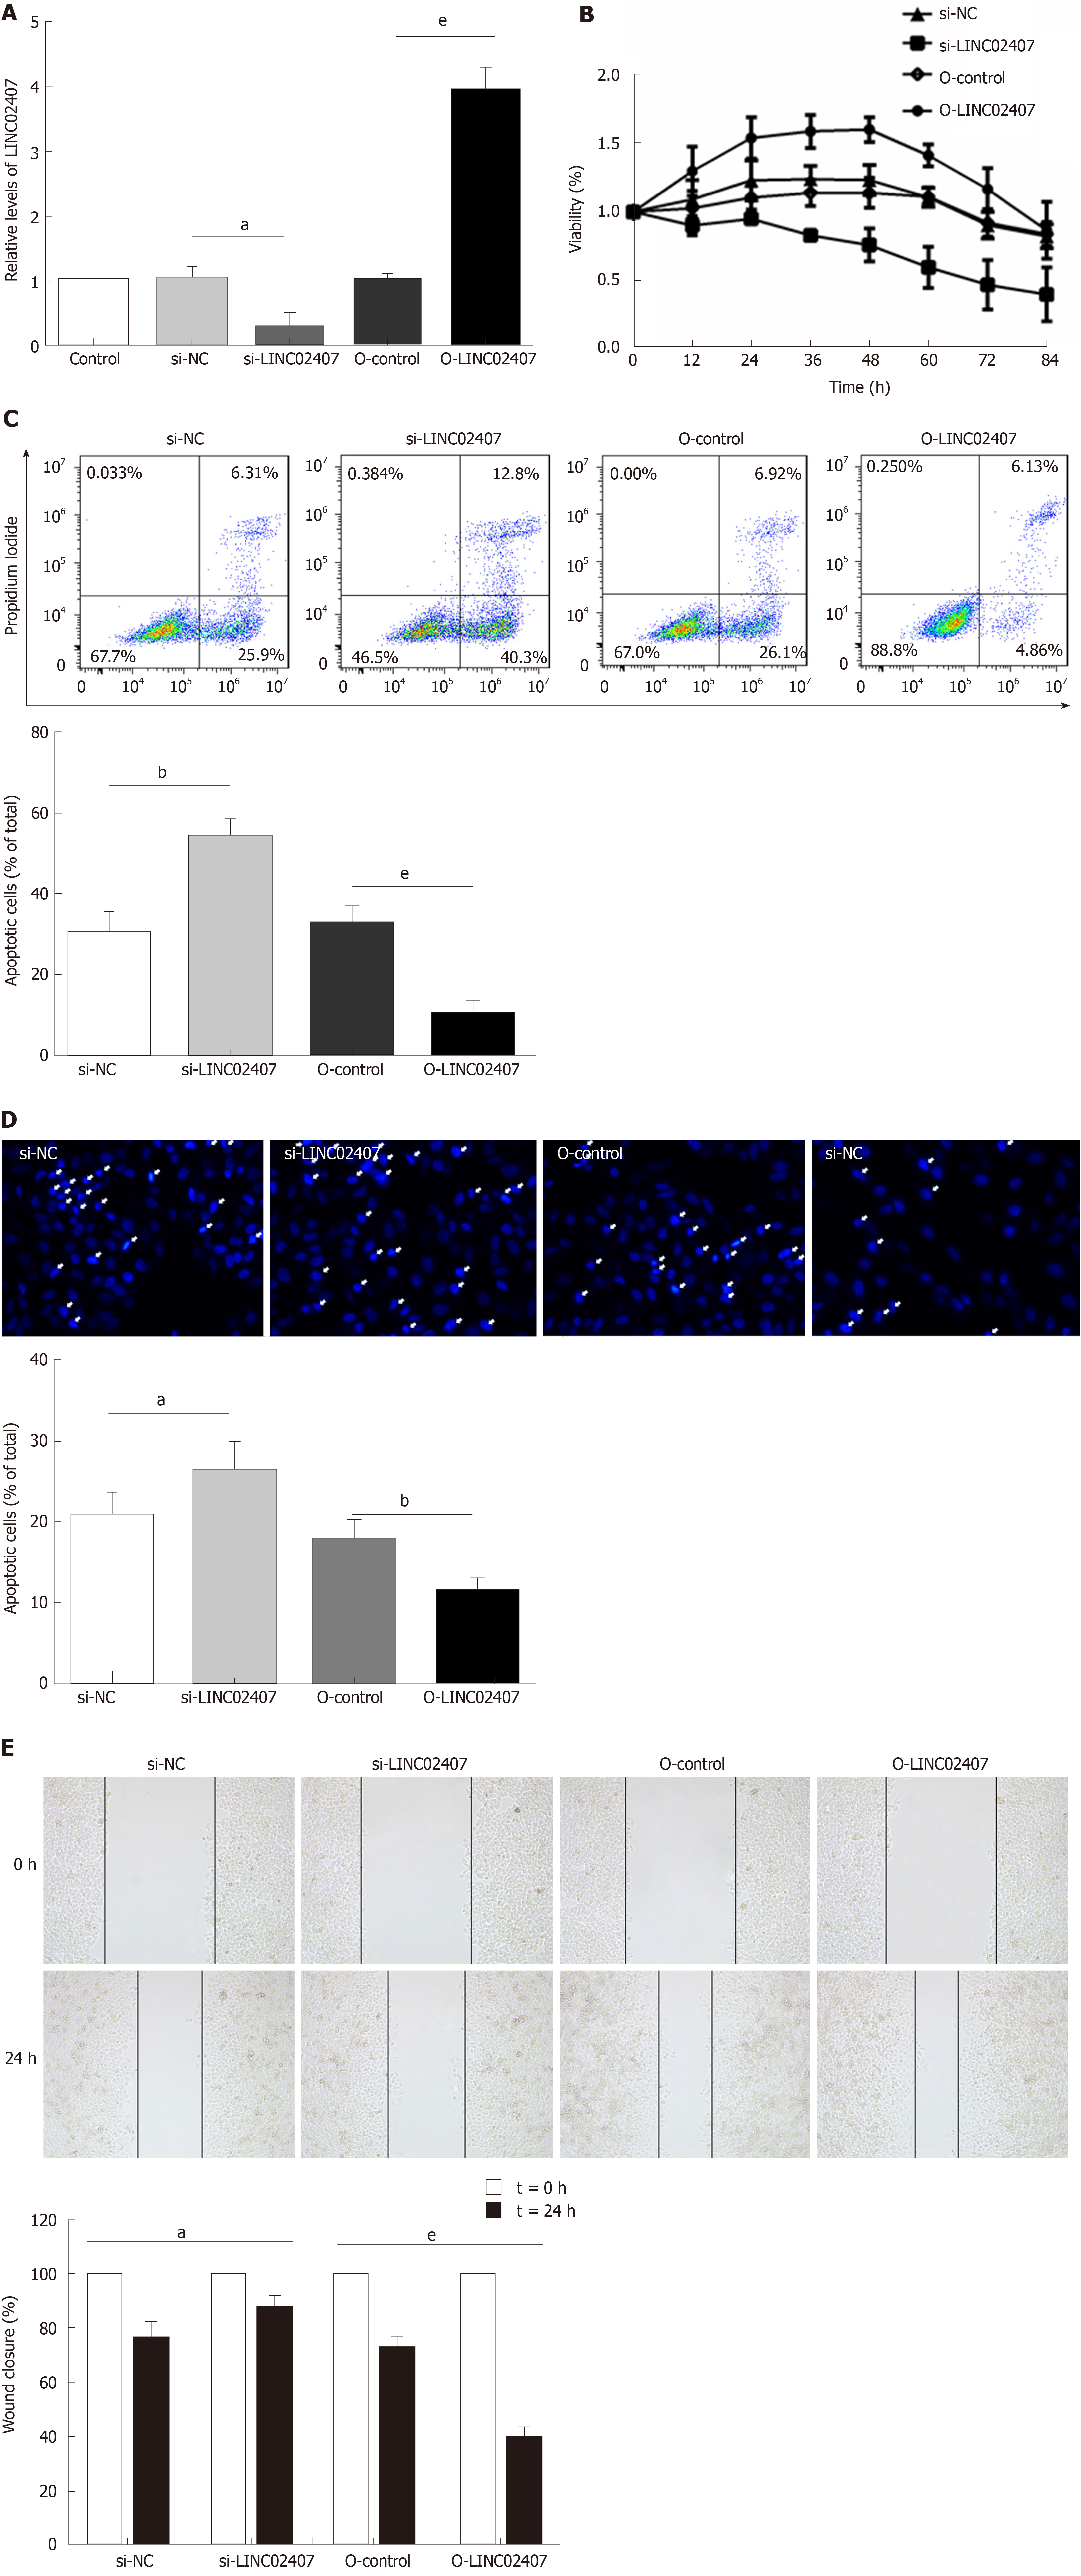
Figure 5 Effect of LINC02407 on HGC-27 cells.
A: Quantitative real-time polymerase chain reaction to determine LINC02407 relative expression in LINC02407-overexpressing lentivirus, overexpression-control, si-LINC02407, and si-NC-transfected HGC-27 cells; B: Determination of proliferation of different groups of HGC-27 cells; C: Hoechst staining assay of different groups of HGC-27 cells; D: Flow cytometry analysis of apoptosis rates of different groups of HGC-27 cells; E: Wound healing assay of different groups of HGC-27 cells. Data are reported as the mean ± SD. aP < 0.05, bP < 0.01, and eP < 0.001 for between-group comparisons. NC: Negative control.
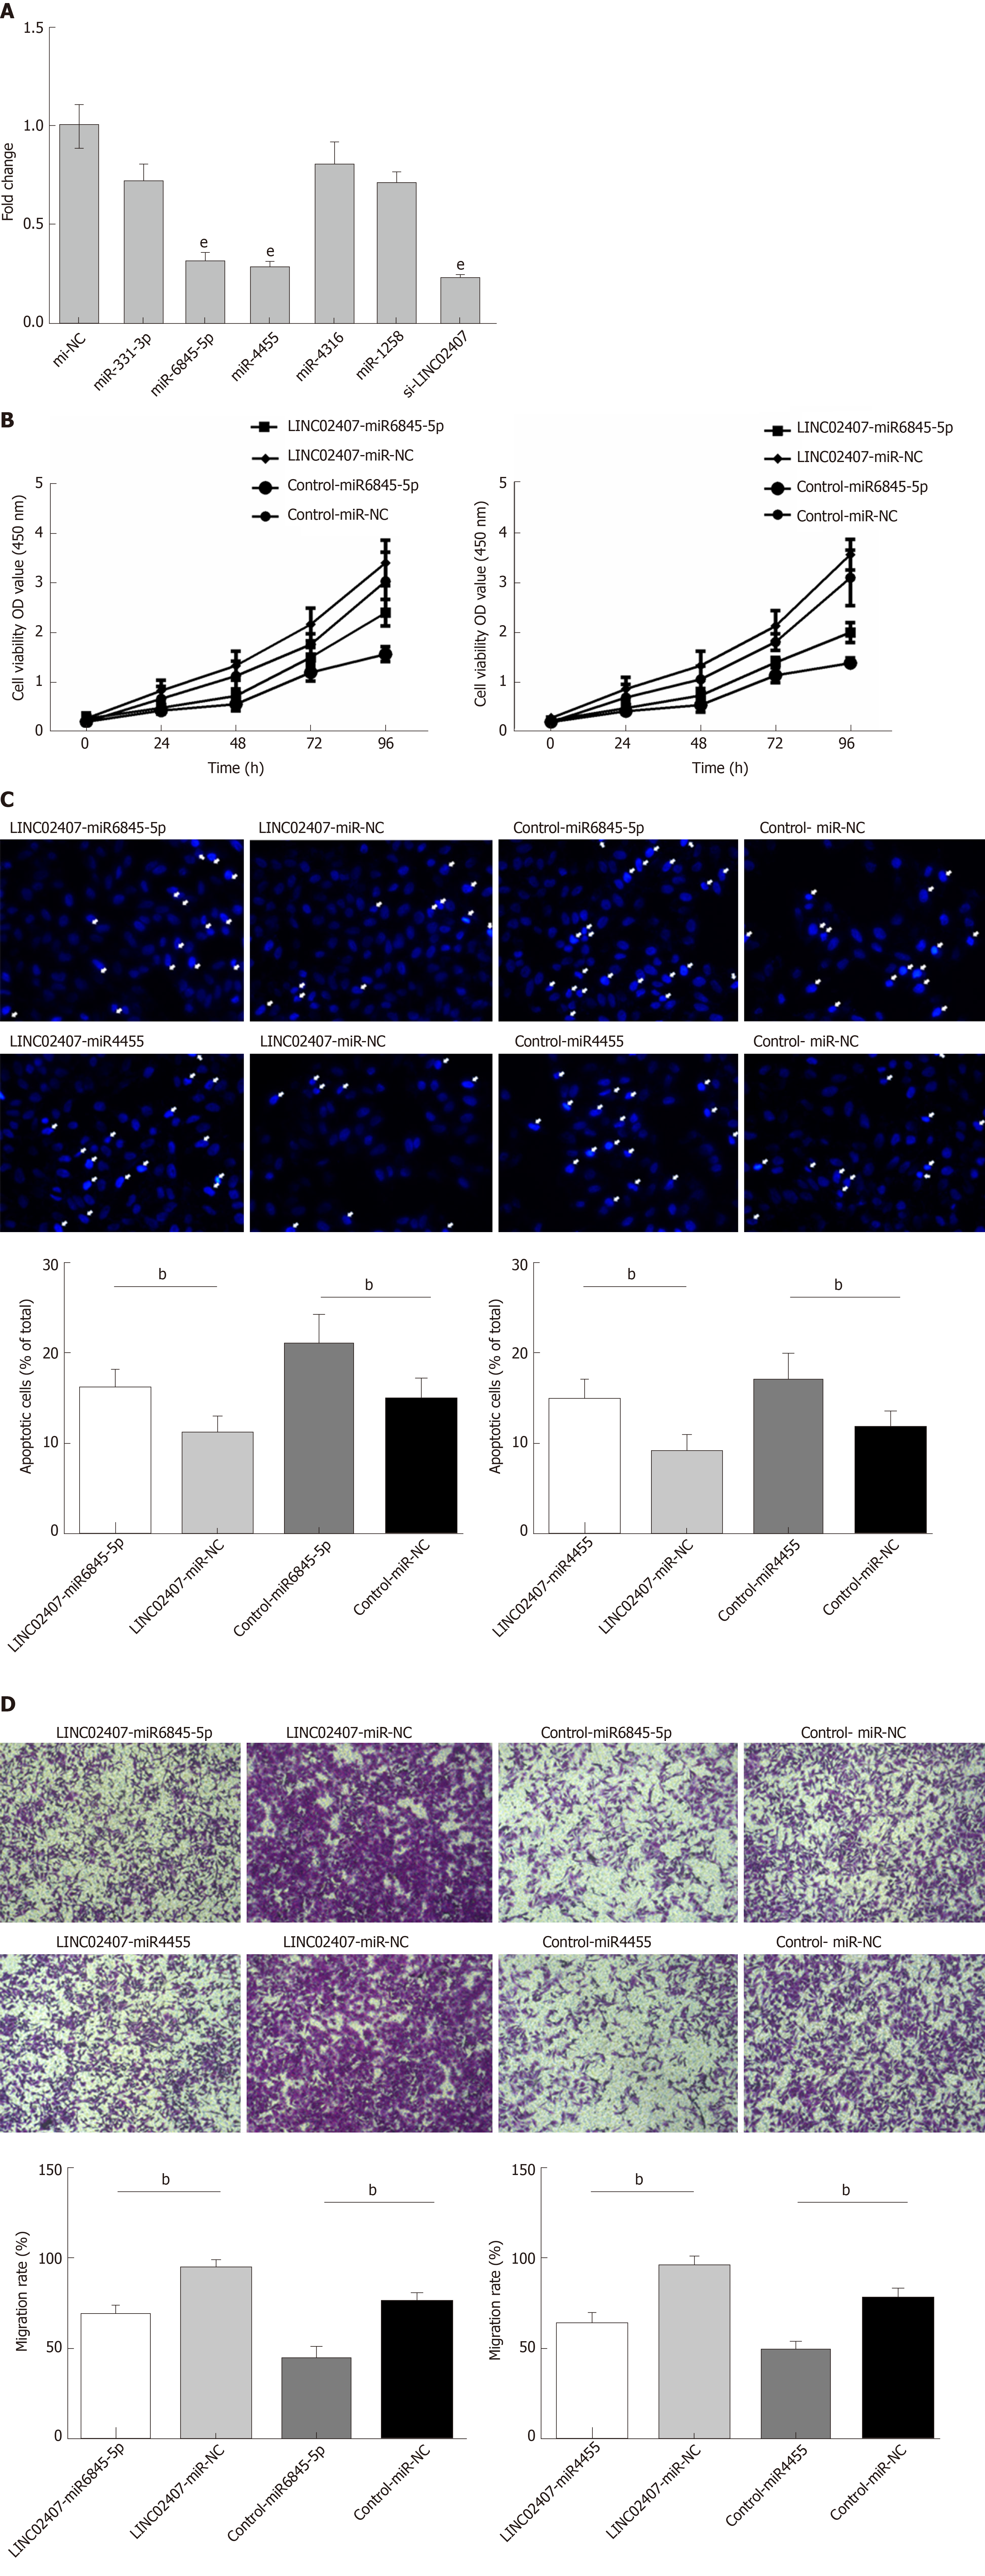
Figure 6 Hsa-miR-6845-5p and hsa-miR-4455 have negative effects on gastric cancer.
A: Luciferase reporter assay verifying hsa-miR-6845-5p and hsa-miR-4455 as direct targets of hsa-miR-6845-5p and hsa-miR-4455; B: Determination of the effects of hsa-miR-6845-5p-mimic and hsa-miR-4455-mimic on cell viability in HGC-27 cells; C: Evaluation of the influence of hsa-miR-6845-5p-mimic and hsa-miR-4455-mimic on HGC-27 cell apoptosis; D: Evaluation of the effect of hsa-miR-6845-5p-mimic and hsa-miR-4455-mimic on invasion of HGC-27 cells. Data are reported as the mean ± SD. aP < 0.05, bP < 0.01, and eP < 0.001 for between-group comparisons. NC: Negative control.
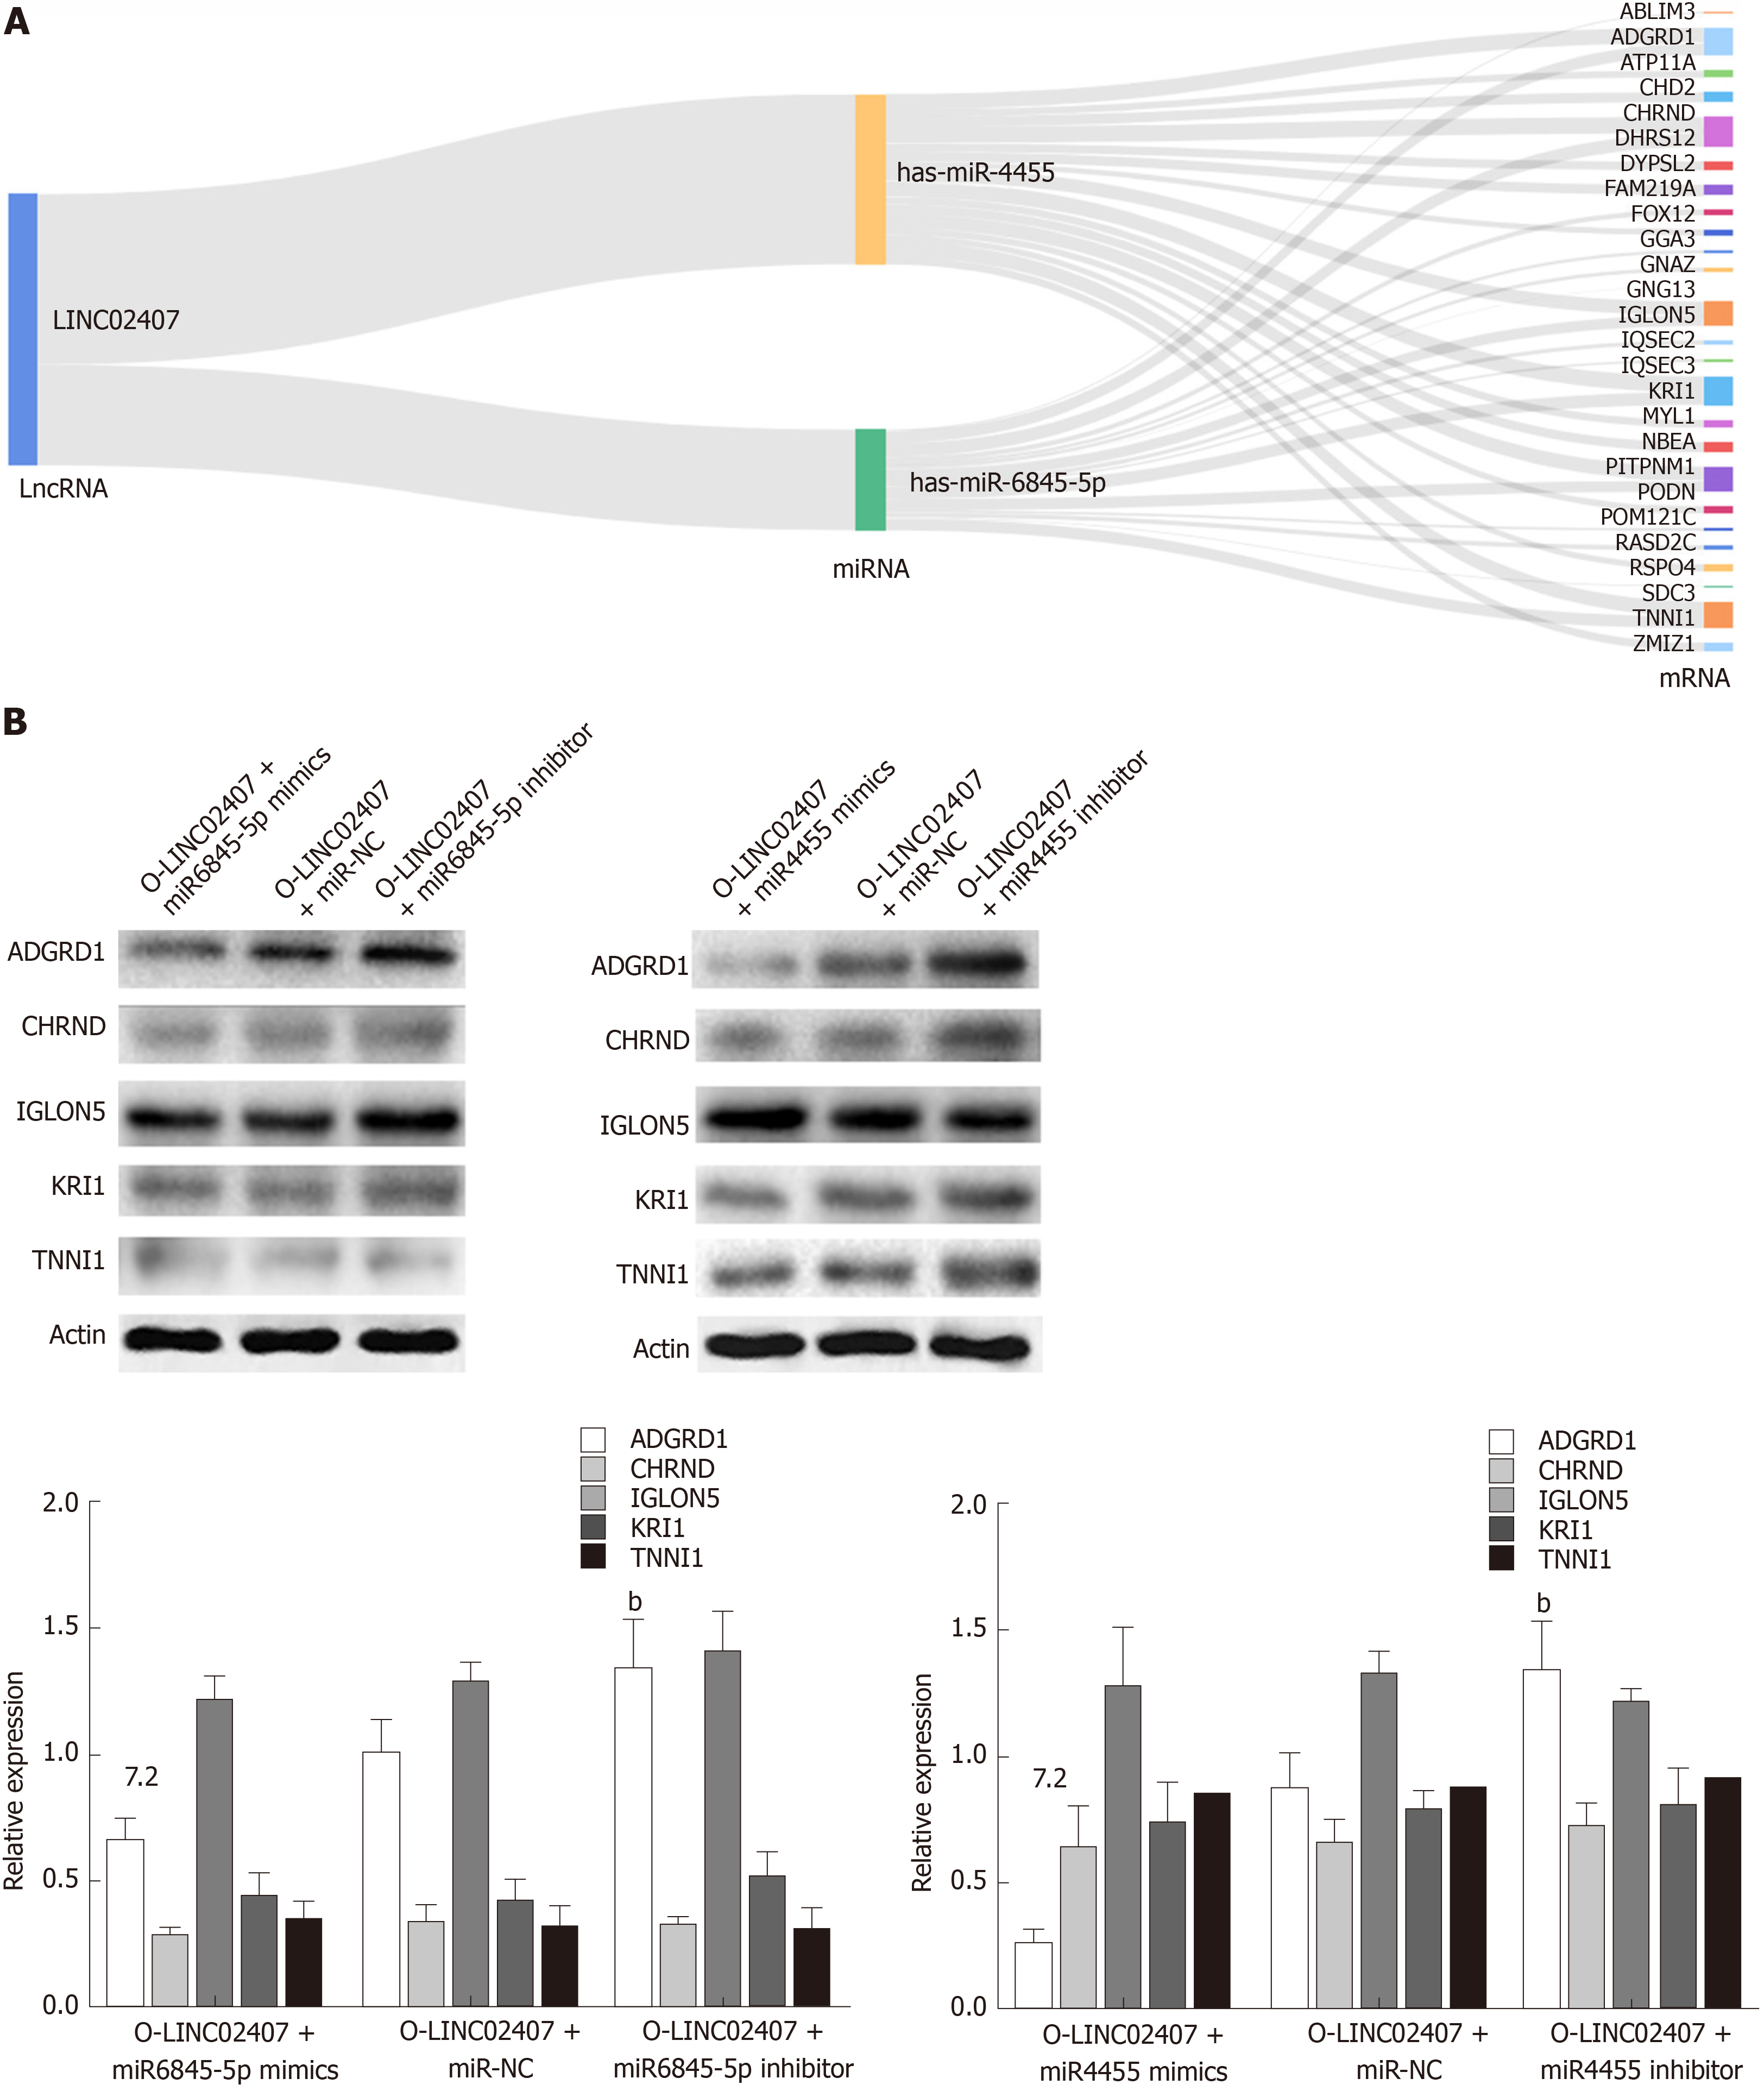
Figure 7 LINC02407 influences gastric cancer through the LINC02407-miR-6845-5p and miR-4455-adhesion G protein-coupled receptor D1 pathways.
A: Sankey diagram for the competing endogenous RNA network in LINC02407. This Sankey plot shows the quantity of evidence for LINC02407 on the left-hand side, miR-6845-5p and miR-4455 in the middle, and the quantity of evidence for potential target mRNAs on the right-hand side of the plot. Each rectangle represents a gene, and the size of the rectangle represents the degree of connection of each gene; B: Western blot assay of adhesion G protein-coupled receptor D1, cholinergic receptor nicotinic delta, IGLON5, KRI1, and troponin I1 proteins differentially expressed in HGC-27 cells under different treatments. Data are reported as the mean ± SD. aP < 0.05, bP < 0.01, and eP < 0.001 for between-group comparisons. NC: Negative control; ADGRD1: Adhesion G protein-coupled receptor D1; CHRND: Cholinergic receptor nicotinic delta; IGLON5: IgLON family member 5; TNNI1: Troponin I1; LncRNA: Long noncoding RNA; miRNA: MicroRNA.
- Citation: Zhou LL, Jiao Y, Chen HM, Kang LH, Yang Q, Li J, Guan M, Zhu G, Liu FQ, Wang S, Bai X, Song YQ. Differentially expressed long noncoding RNAs and regulatory mechanism of LINC02407 in human gastric adenocarcinoma. World J Gastroenterol 2019; 25(39): 5973-5990
- URL: https://www.wjgnet.com/1007-9327/full/v25/i39/5973.htm
- DOI: https://dx.doi.org/10.3748/wjg.v25.i39.5973


