©The Author(s) 2019.
World J Gastroenterol. Jan 21, 2019; 25(3): 346-355
Published online Jan 21, 2019. doi: 10.3748/wjg.v25.i3.346
Published online Jan 21, 2019. doi: 10.3748/wjg.v25.i3.346
Figure 1 Comparison of the rat portal venous blood flow at 0, 6, and 24 h after repeated +Gz exposures in the blank control group, +6 Gz/5 min stress group, and +10 Gz/5 min stress group.
A: Portal vein blood flow; B: Portal flow velocity.
Figure 2 Comparison of rat serum alanine aminotransferase and aspartate aminotransferase levels at 0, 6, and 24 h after repeated +Gz exposures in the blank control group, +6 Gz/5 min stress group, and +10 Gz/5 min stress group.
A: Alanine aminotransferase; B: Aspartate aminotransferase. ALT: Alanine aminotransferase; AST: Aspartate aminotransferase.
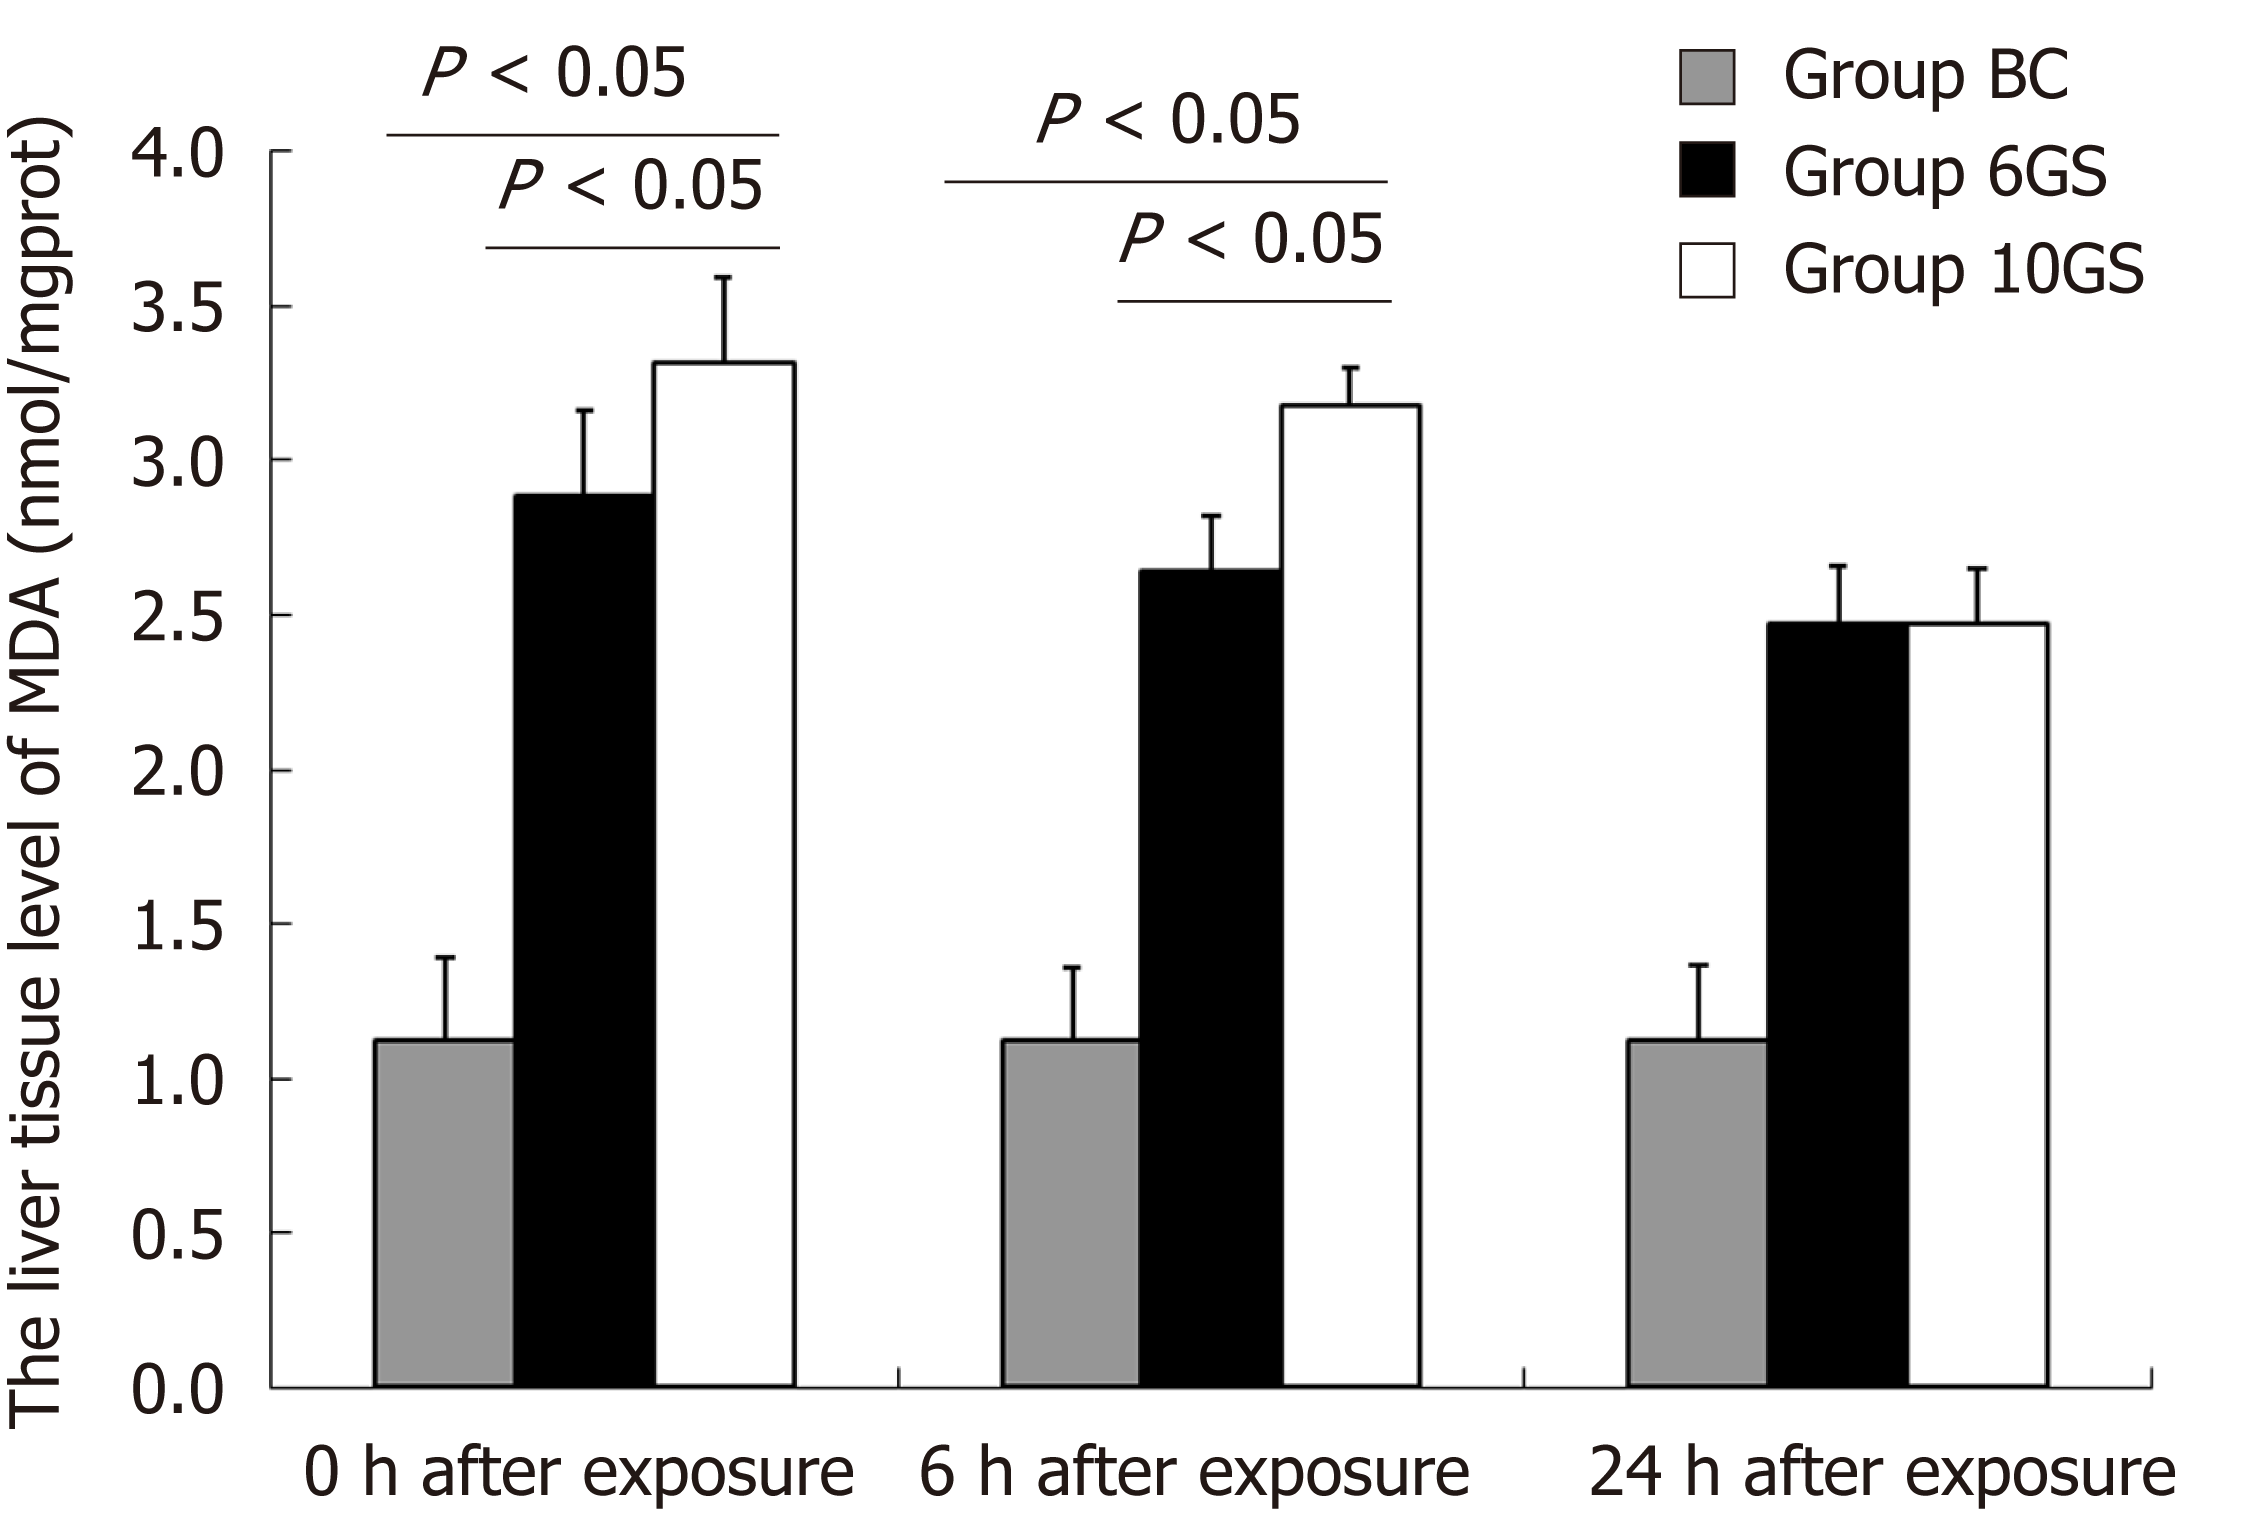
Figure 3 Comparison of the liver tissue malondialdehyde levels at 0, 6, and 24 h after repeated +Gz exposures in the blank control group, +6 Gz/5 min stress group, and +10 Gz/5 min stress group.
MDA: Malondialdehyde.
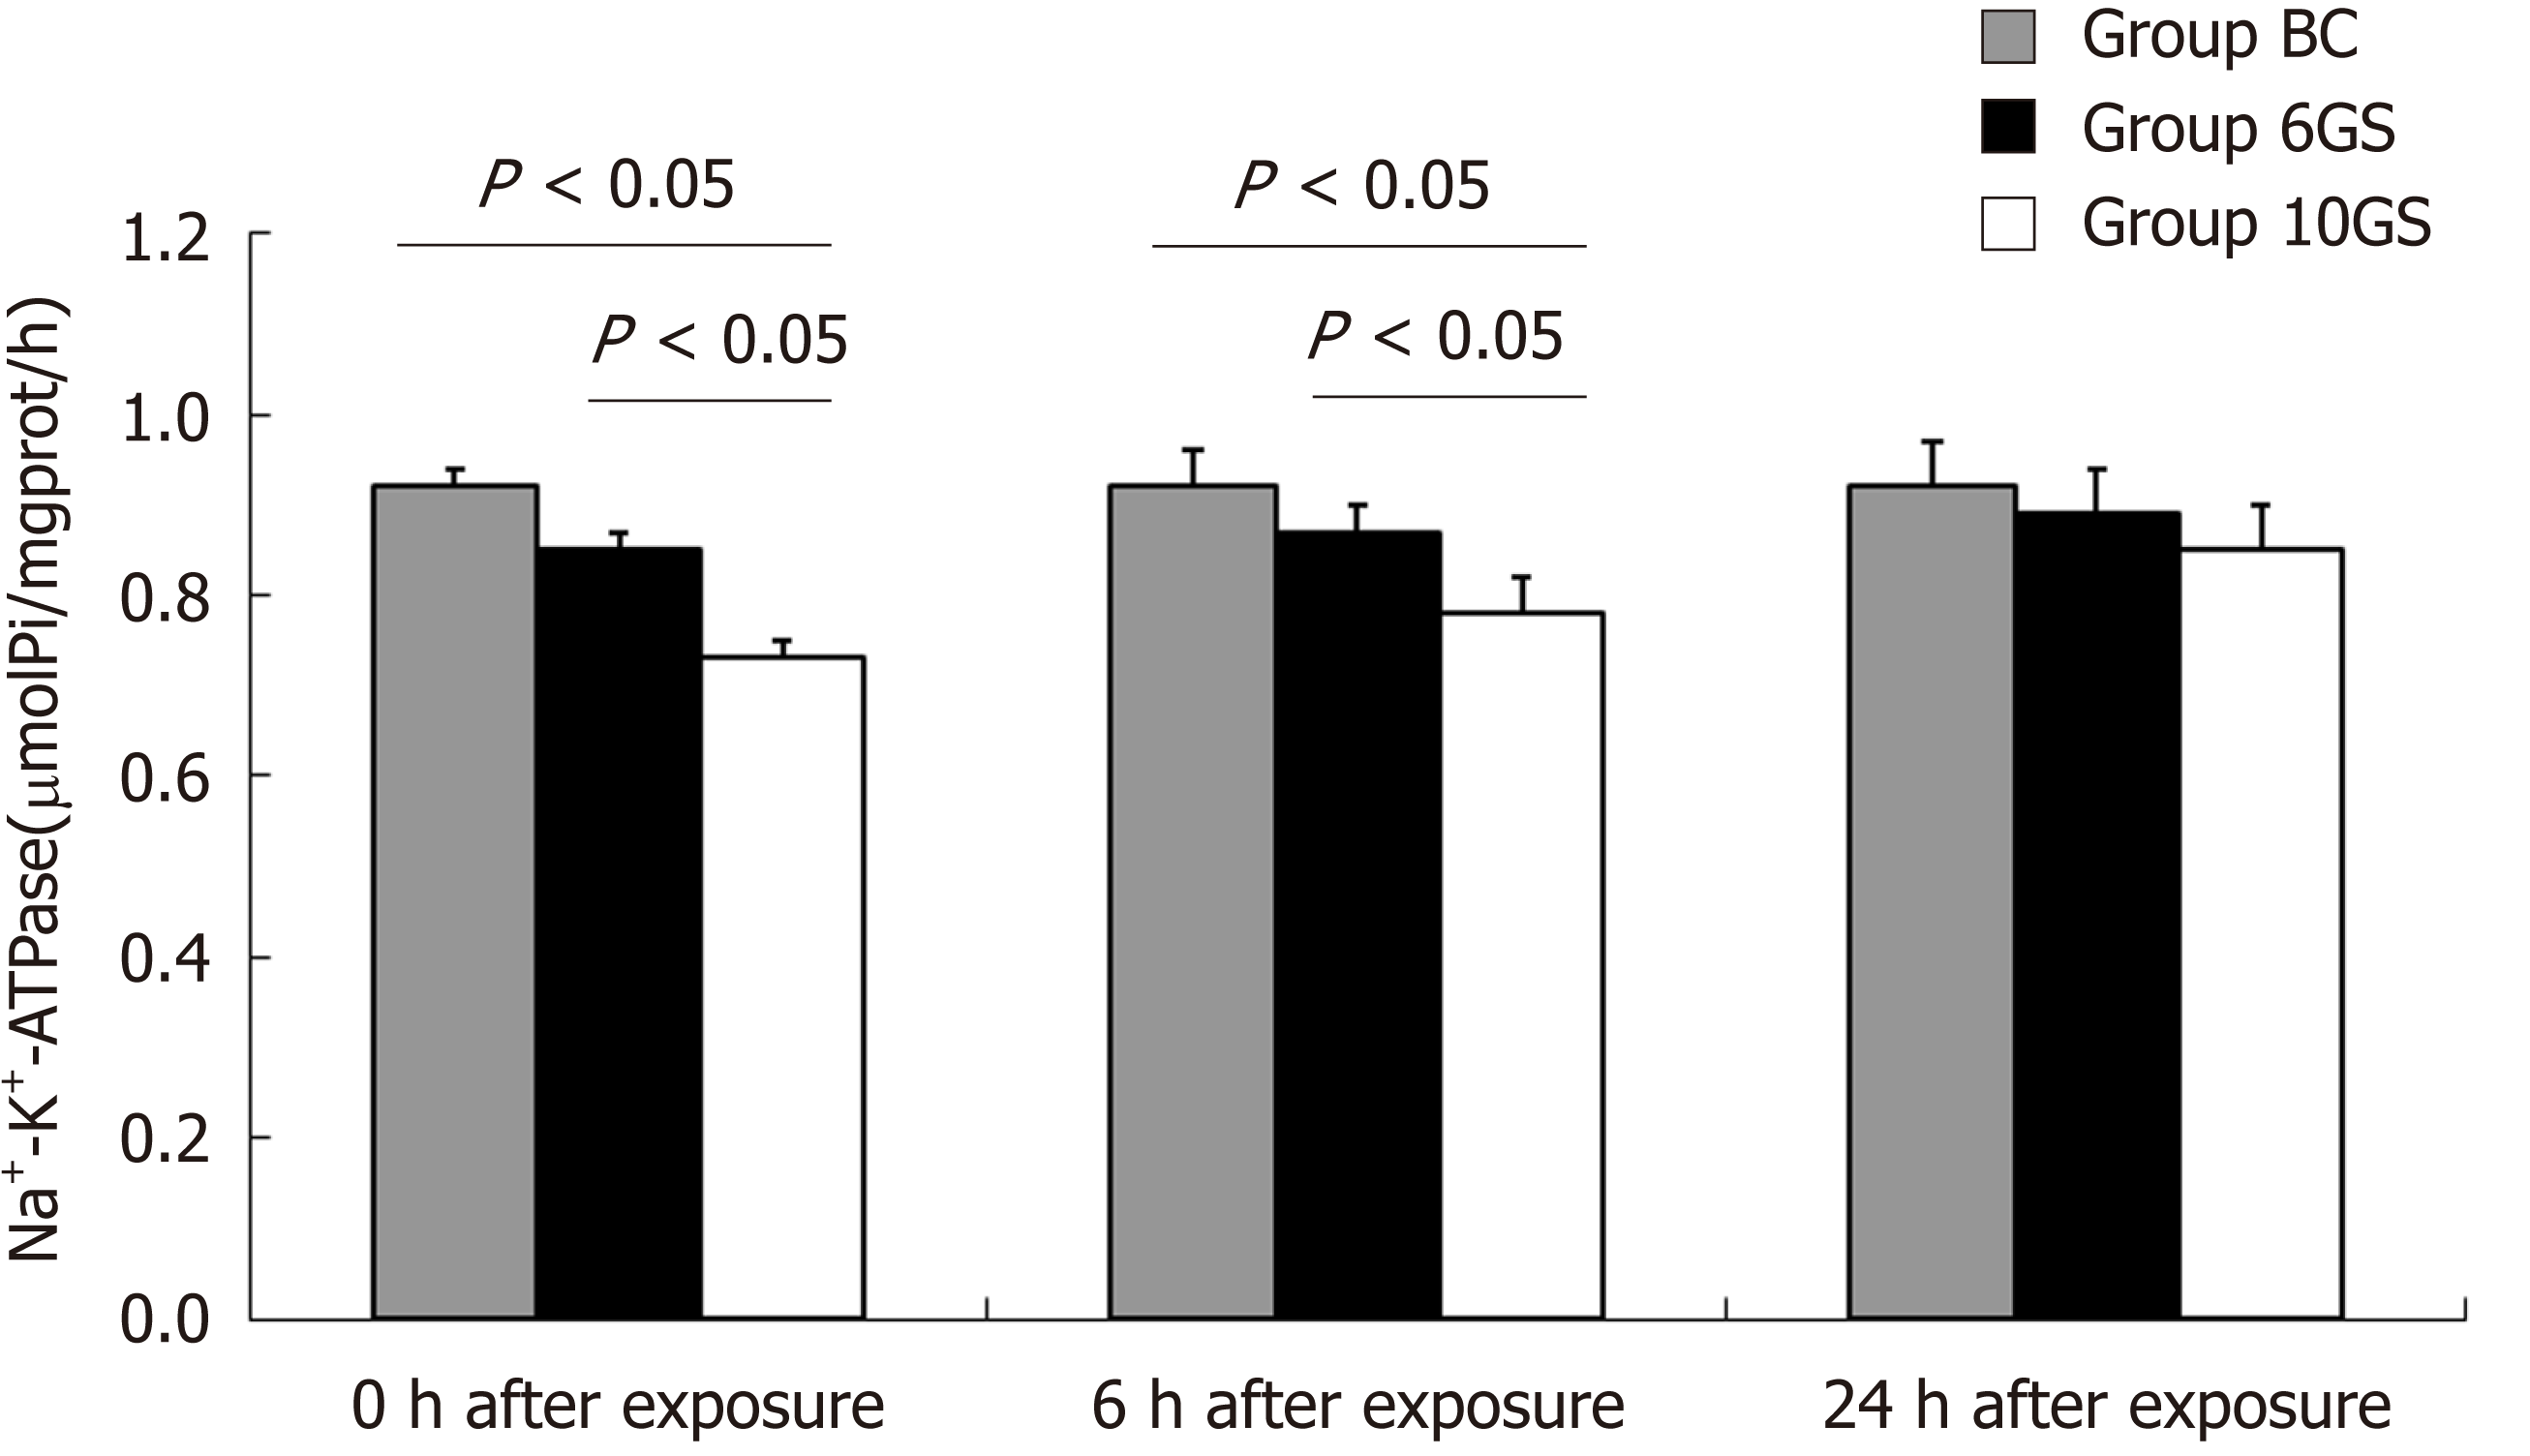
Figure 4 Comparison of the rat liver Na+-K+-ATPase activity at 0, 6, and 24 h after repeated +Gz exposures in the blank control group, +6 Gz/5 min stress group, and +10 Gz/5 min stress group.
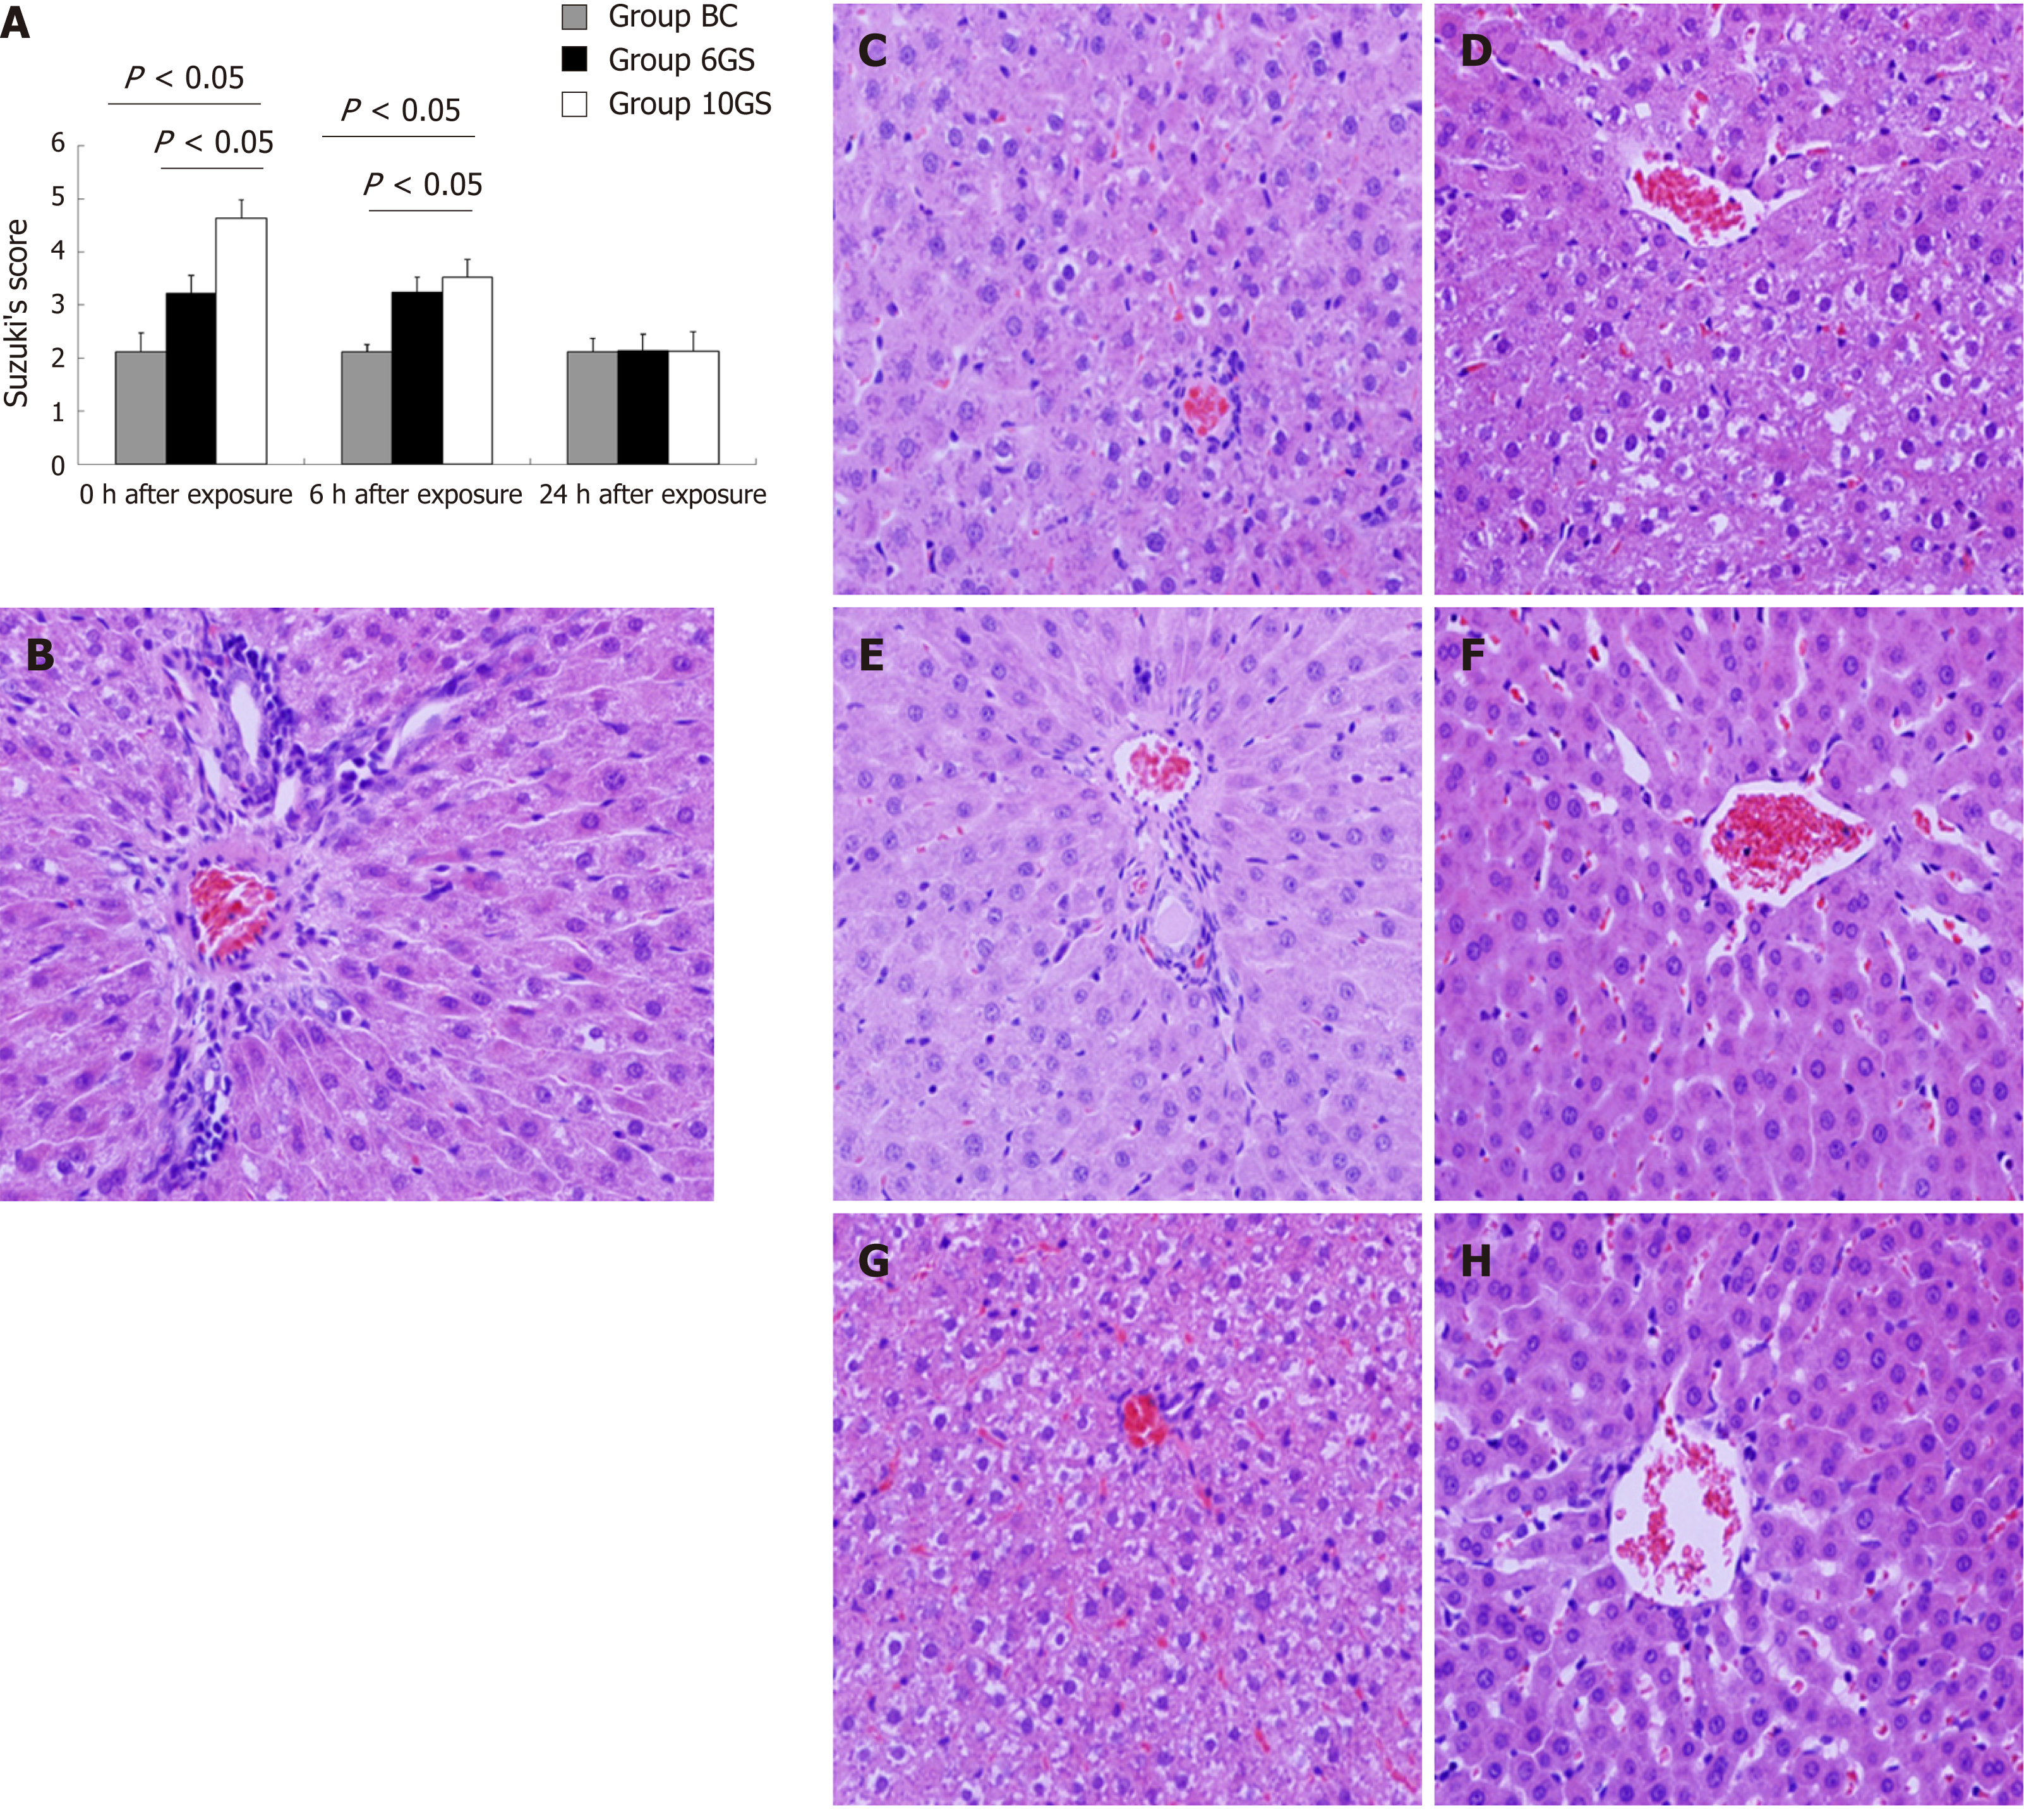
Figure 5 Pathological changes in the liver tissue at 0, 6, and 24 h after repeated +Gz exposures in the blank control group, +6 Gz/5 min stress group, and +10 Gz/5 min stress group.
A: The hepatic pathological injury after repeated +Gz exposures was assessed and scored according to Suzuki’s criteria. B: The structures of the hepatic lobules and liver antrum were clear, and cellular edema was not obvious in the BC group. C: At the 0 h time-point after exposure, the hepatic sinus cord-like structure was maintained in the 6GS group. D: It was less well maintained in the 10GS group, which presented with hepatocyte edema. E: There was no significant score difference between the 0 and 6 h time-points after exposure in the 6GS group. F: At the 6 h time-point post exposure, hepatocyte edema had been significantly relieved in the 10GS group. G and H: The hepatic histology profiles in both the 6GS and the 10GS groups were nearly normal 24 h after exposure.
- Citation: Shi B, Wang XQ, Duan WD, Tan GD, Gao HJ, Pan YW, Guo QJ, Zhang HY. Effects of positive acceleration (+Gz stress) on liver enzymes, energy metabolism, and liver histology in rats. World J Gastroenterol 2019; 25(3): 346-355
- URL: https://www.wjgnet.com/1007-9327/full/v25/i3/346.htm
- DOI: https://dx.doi.org/10.3748/wjg.v25.i3.346


