Copyright
©The Author(s) 2019.
World J Gastroenterol. Jul 14, 2019; 25(26): 3392-3407
Published online Jul 14, 2019. doi: 10.3748/wjg.v25.i26.3392
Published online Jul 14, 2019. doi: 10.3748/wjg.v25.i26.3392
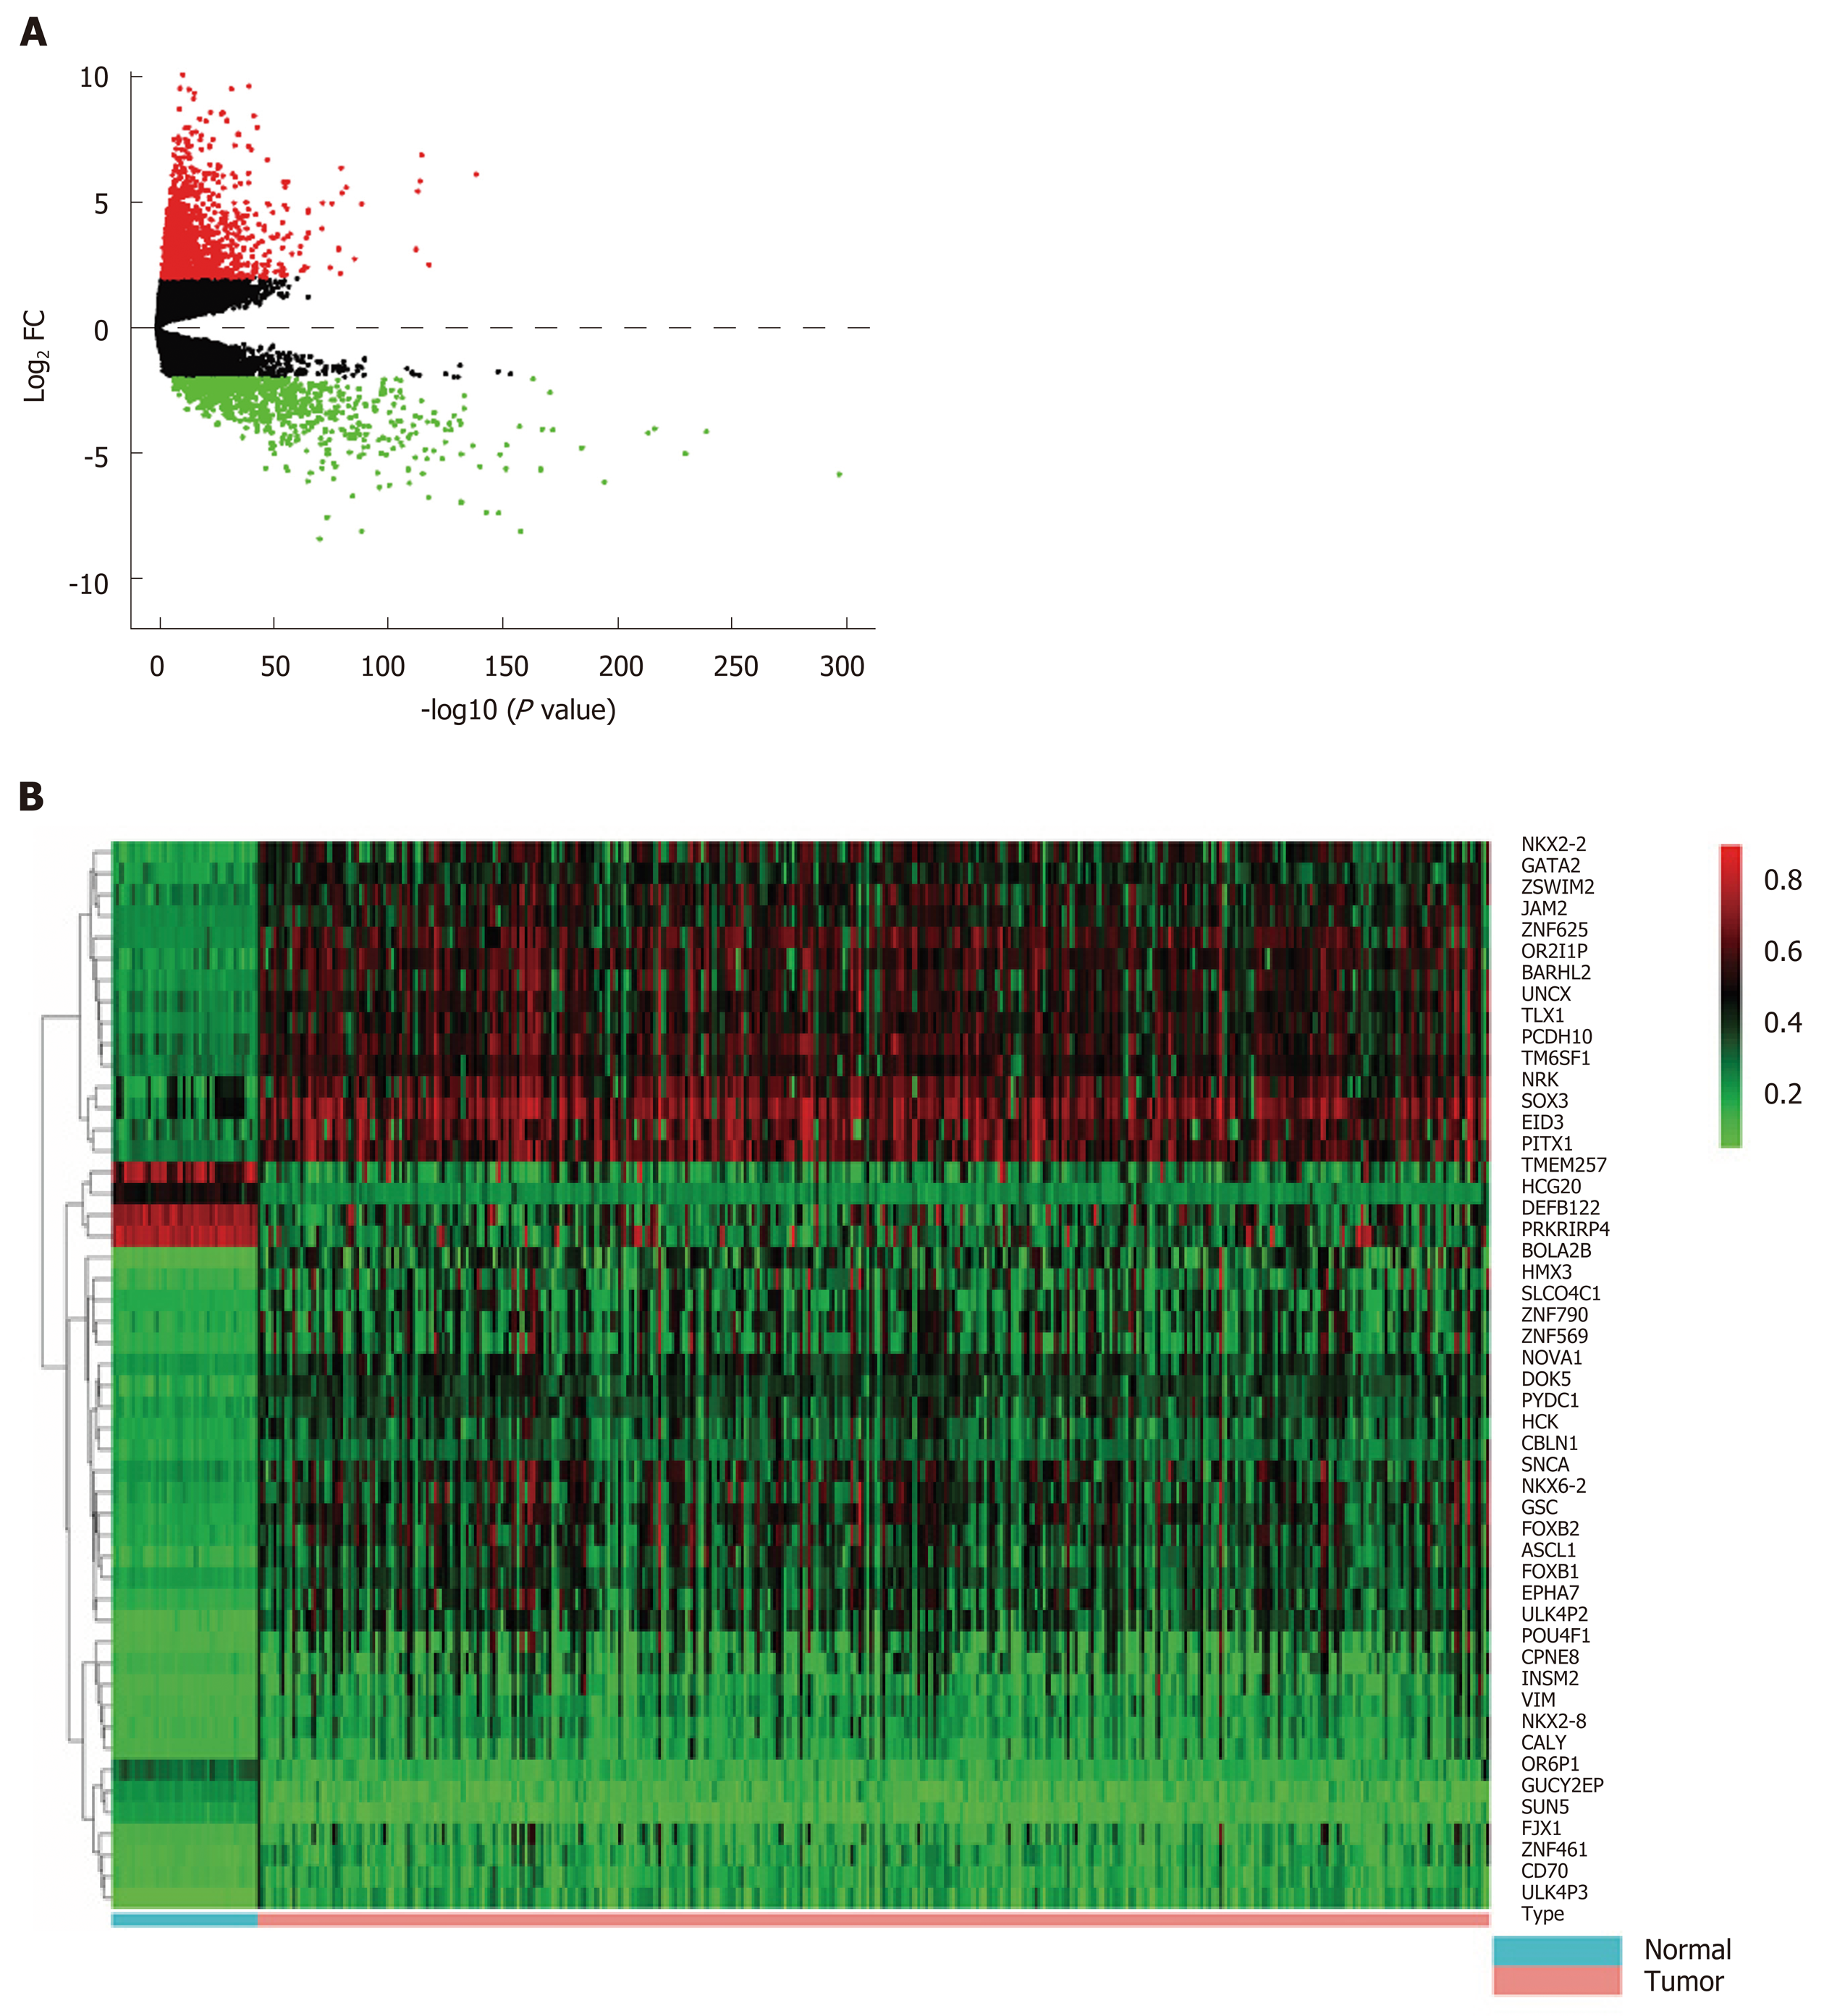
Figure 1 Differentially expressed genes and differentially methylated genes identified from The Cancer Genome Atlas project database.
A: Volcano plot of differentially expressed genes between colon cancer and normal tissues [log2 fold change (FC) > 2, P < 0.01]. Red dots represent up-regulated genes and green dots represent down-regulated genes. Black dots represent the genes with a fold-change in expression of <2; B: Heat map of the top 50 differentially methylated genes (DMGs) (log2 FC > 1, P < 0.01). The left vertical axis shows clusters of DMGs and right vertical axis represents gene names. Red represents hypermethylated genes and green represents hypomethylated genes. DMGs: Differentially methylated genes; FC: Fold change.
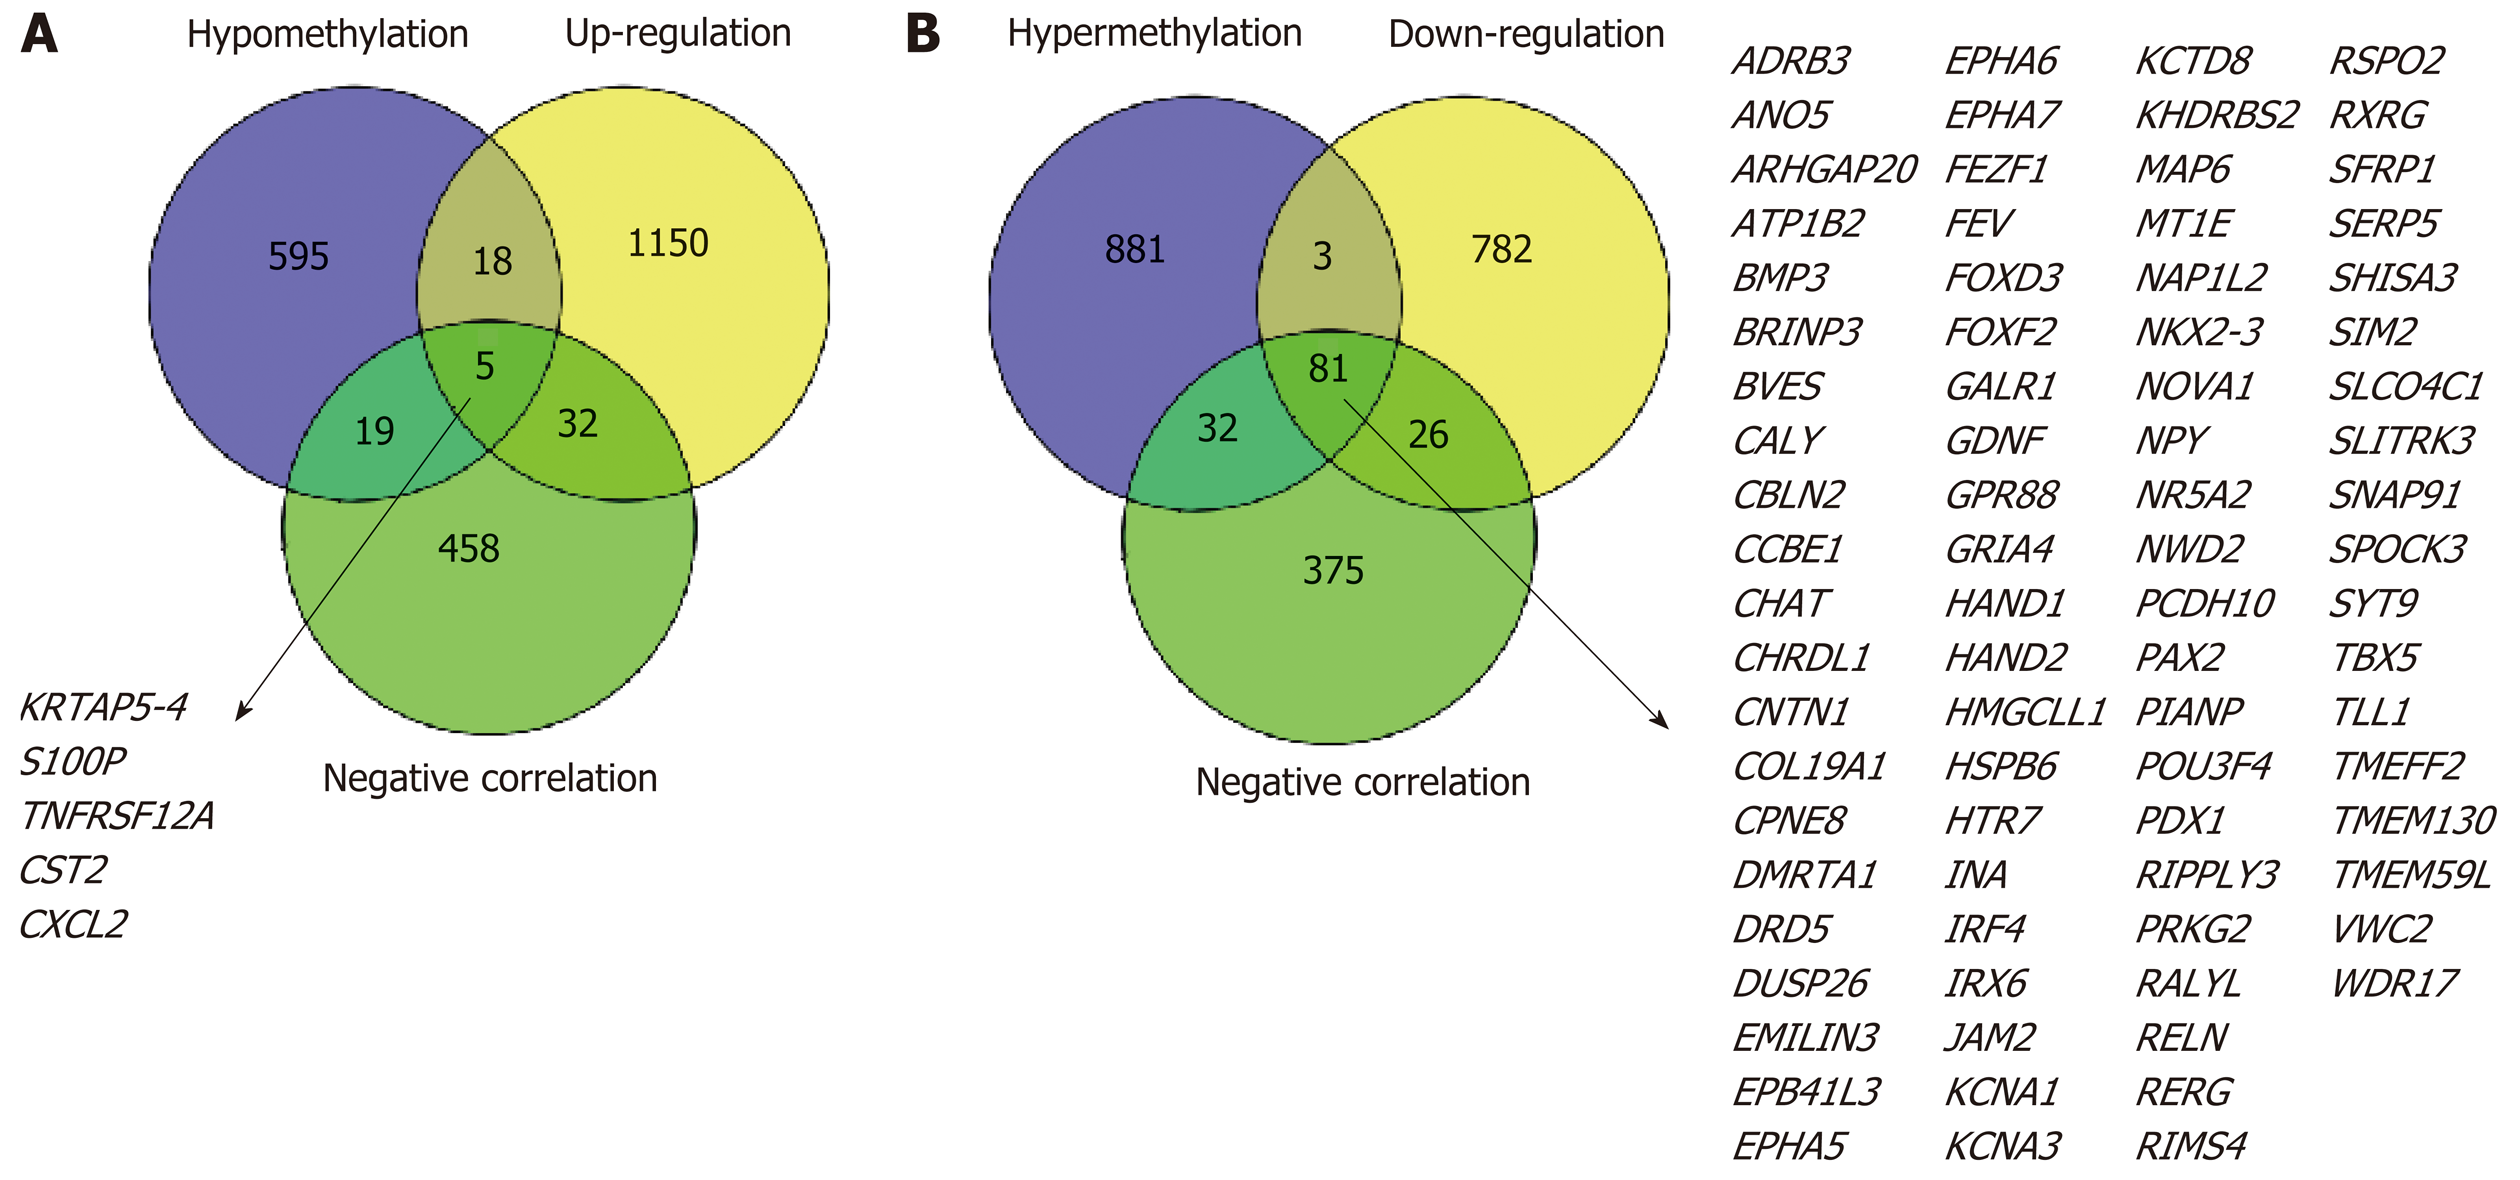
Figure 2 Identification of methylation-regulated differentially expressed genes.
A: A total of five genes were identified as methylation-regulated differentially expressed genes (MeDEGs) by taking the intersection of three gene sets (hypomethylation, up-regulation, and negative correlation); B: A total of 81 genes were identified as MeDEGs by taking the intersection of three gene sets (hypermethylation, down-regulation, and negative correlation). MeDEGs: Methylation-regulated differentially expressed genes.
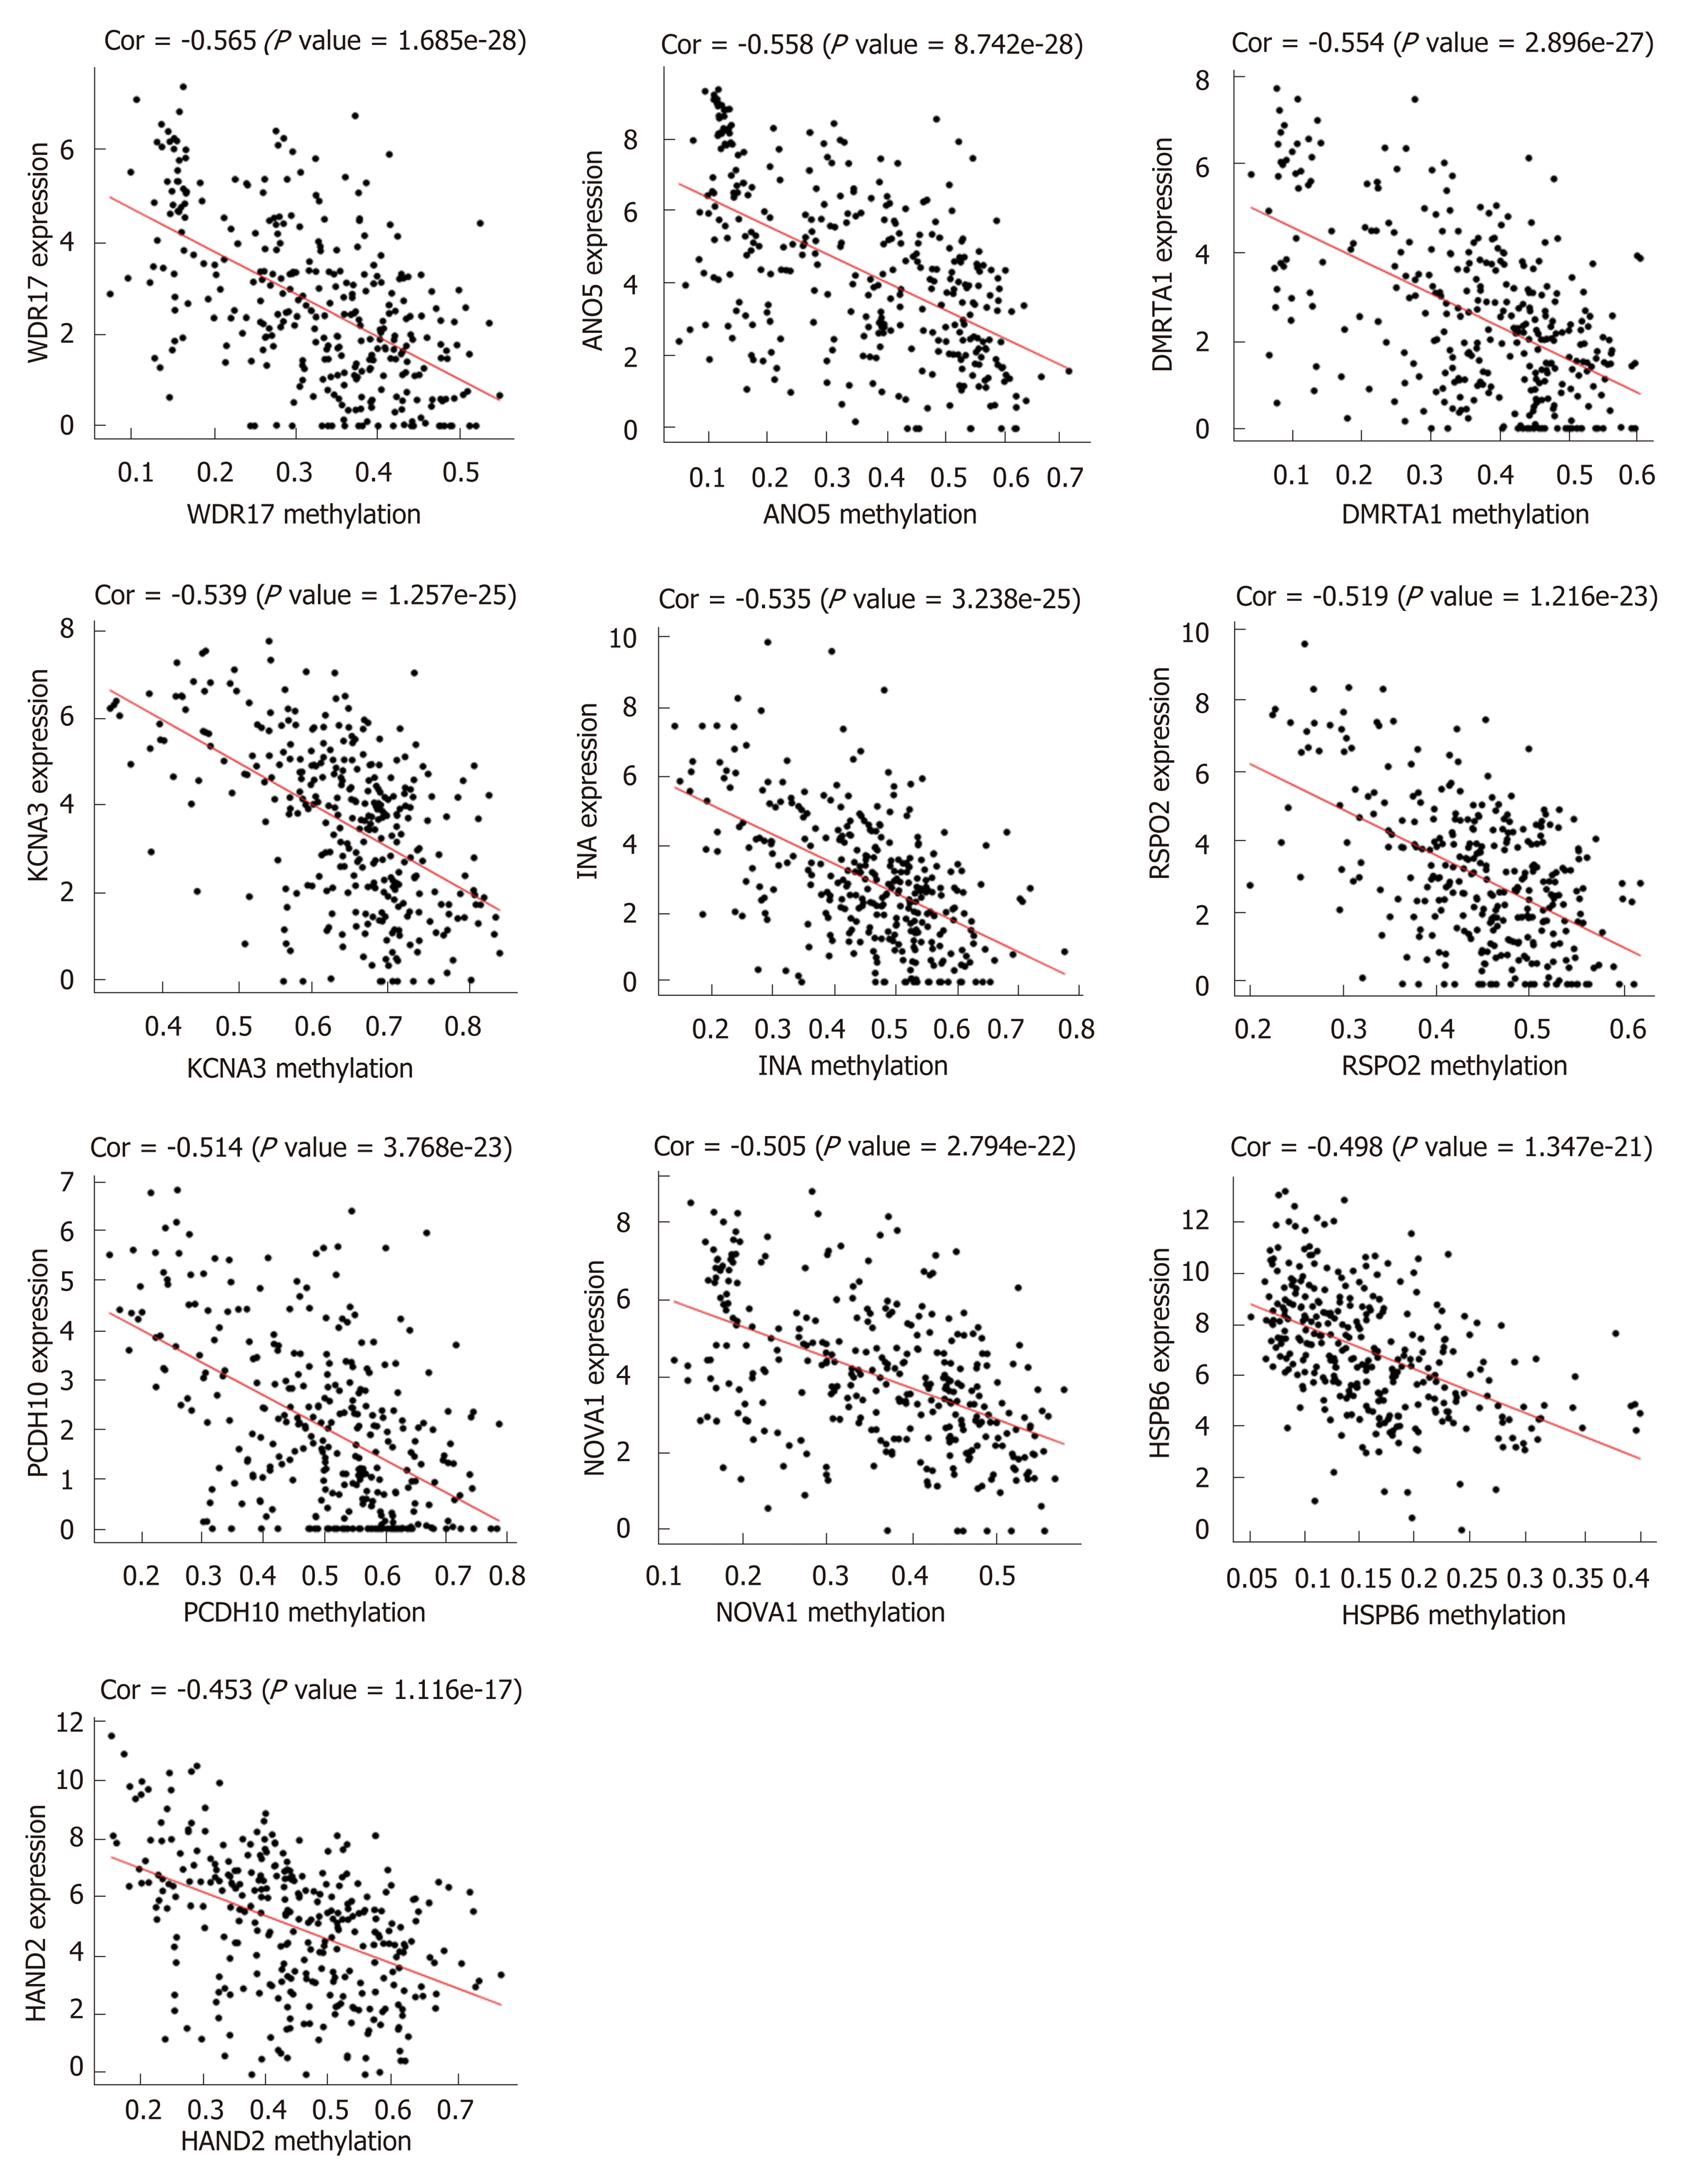
Figure 3 The methylation-regulated differentially expressed genes with the top 10 correlation coefficients.
Spearman’s correlation analysis was performed between methylation (horizontal axis) and expression (vertical axis) of methylation-regulated differentially expressed genes. Spearman’s correlation coefficient and P-values are shown in each plot.
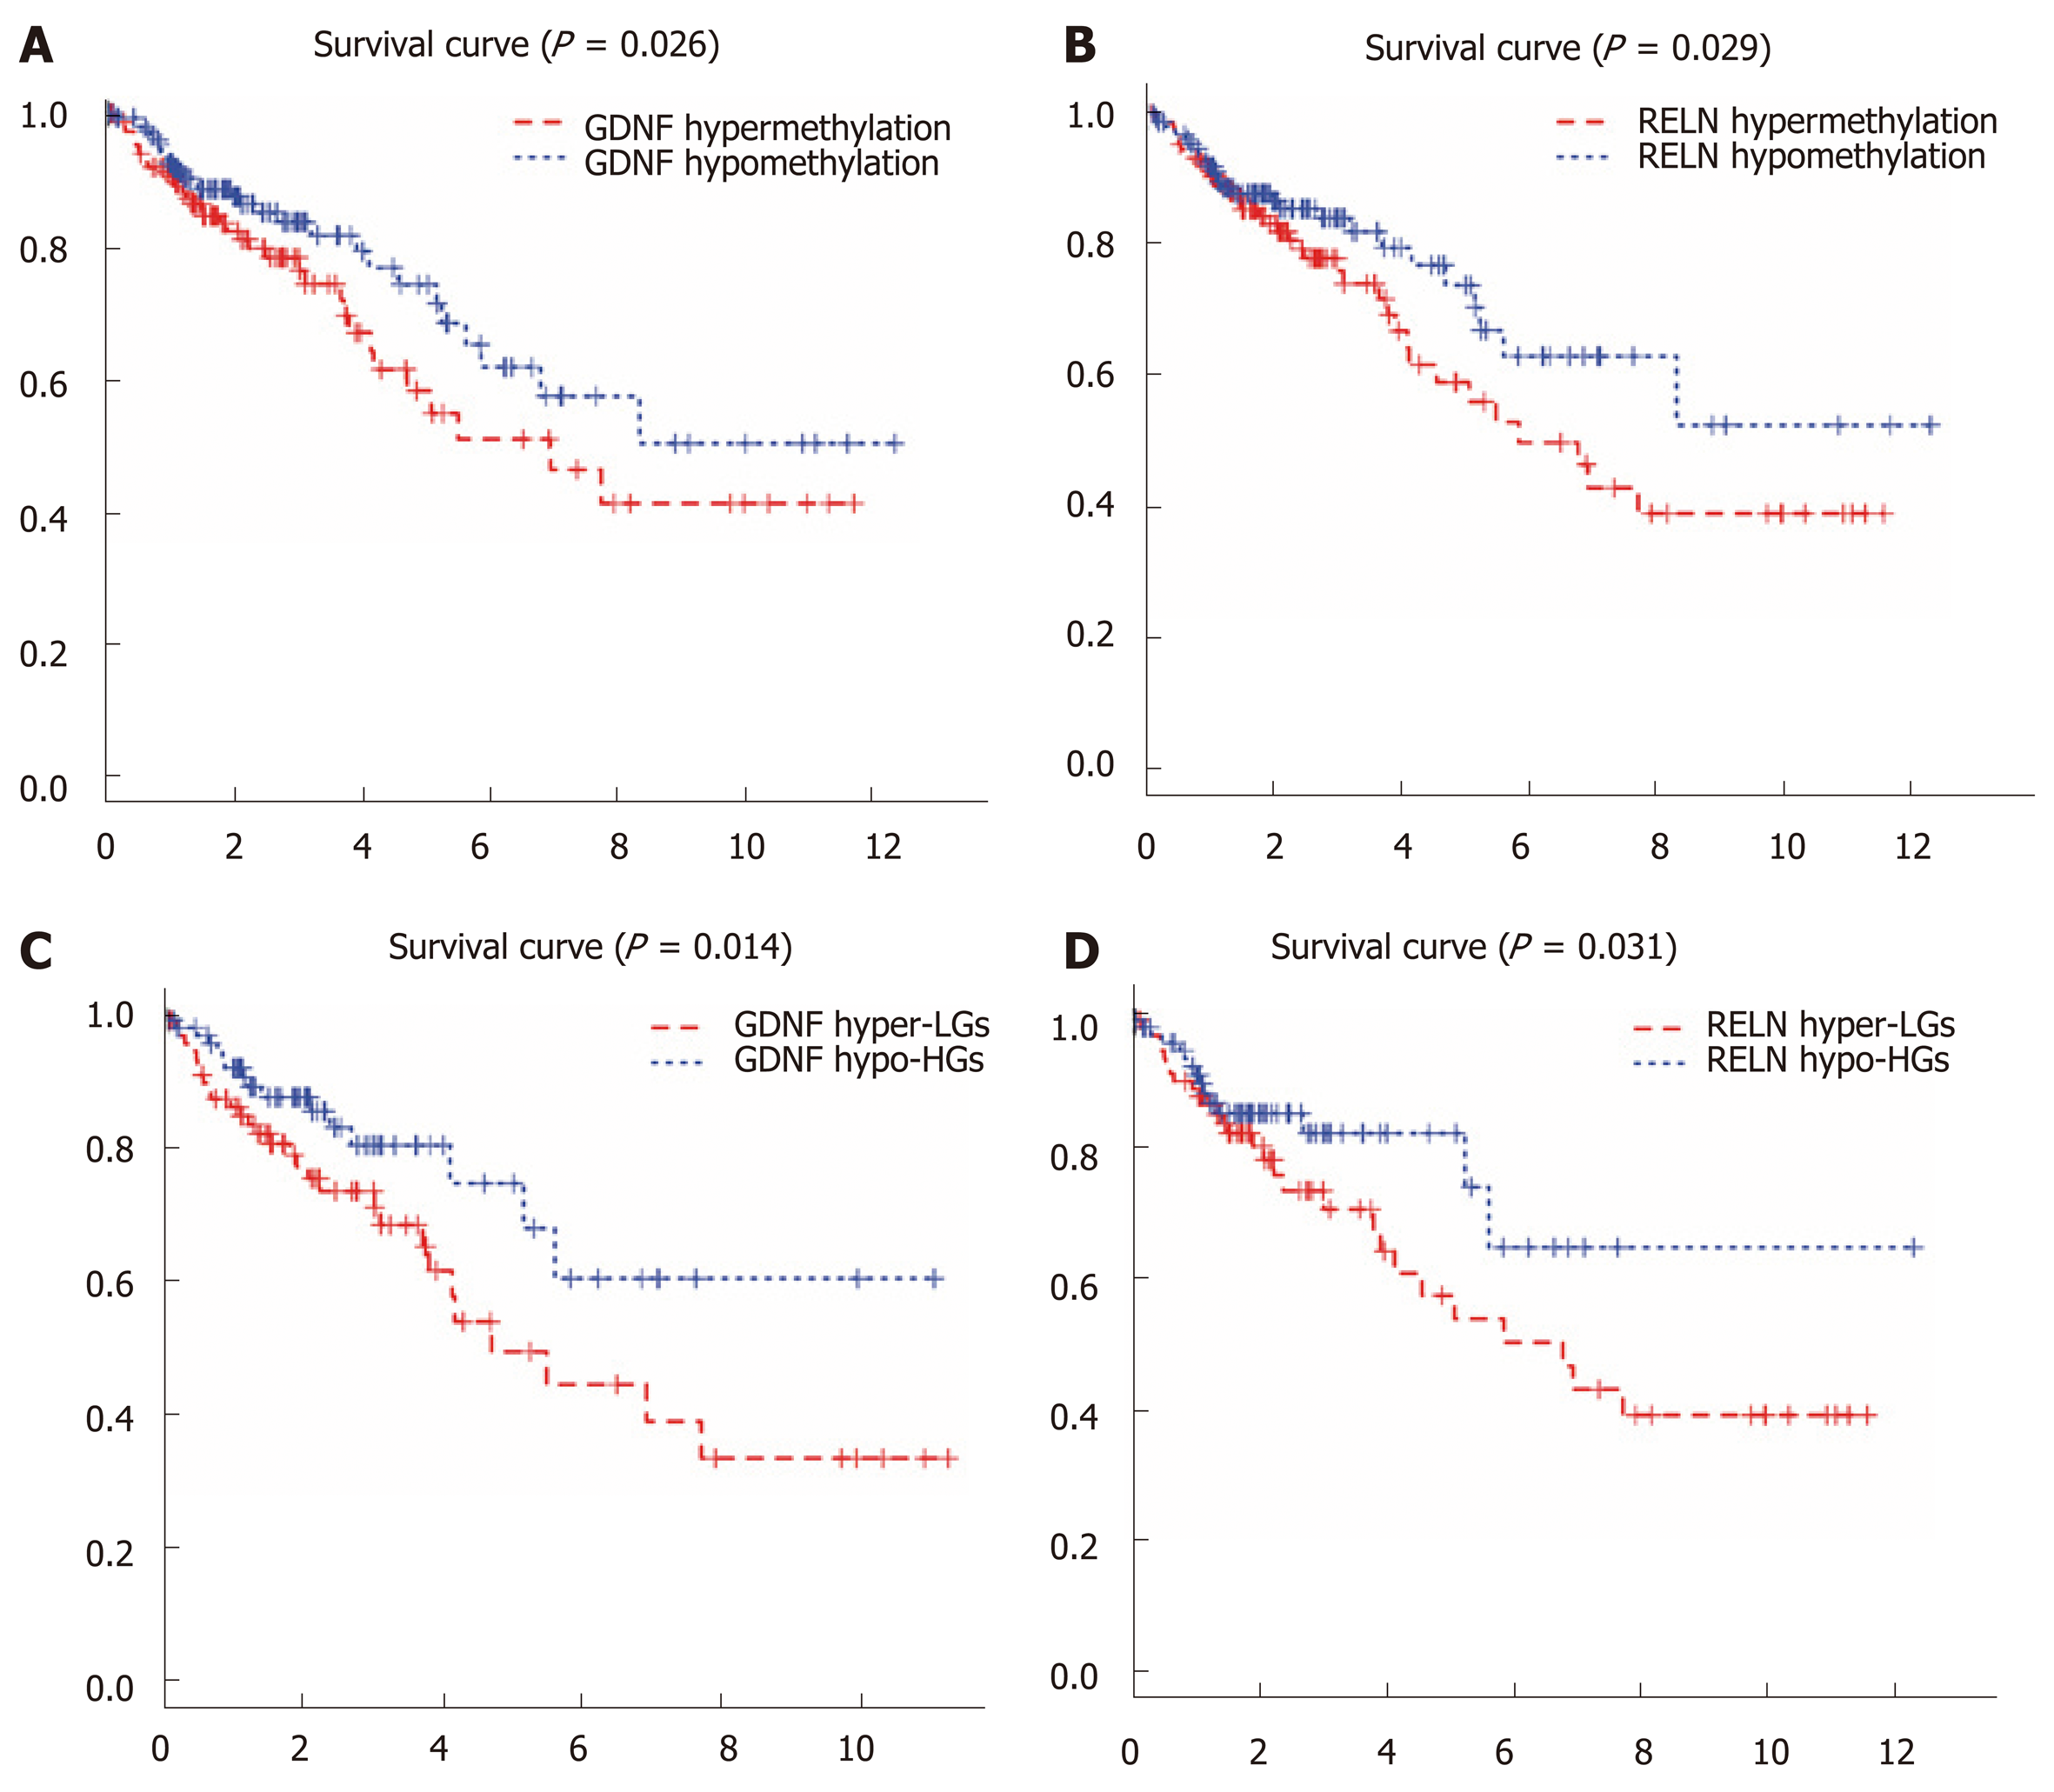
Figure 4 Kaplan-Meier curves for the methylation and methylation-expression of glial cell-derived neurotrophic factor and reelin.
A and B: Glial cell-derived neurotrophic factor (GDNF) and reelin (RELN) were ranked by the median of methylation and then scored for each colon cancer patient in accordance with high- or low-level methylation value; C and D: GDNF and RELN were ranked by the median of methylation and expression and then scored for each colon cancer patient in accordance with high- or low-level methylation value and high or low-level expression value. The horizontal axis represents the overall survival time and the vertical axis represents survival function. Hyper-LGs: Hypermethylation and low expression methylation-regulated differentially expressed genes; Hypo-HGs: Hypomethylation and high expression methylation-regulated differentially expressed genes; GDNF: Glial cell-derived neurotrophic factor; RELN: Reelin.
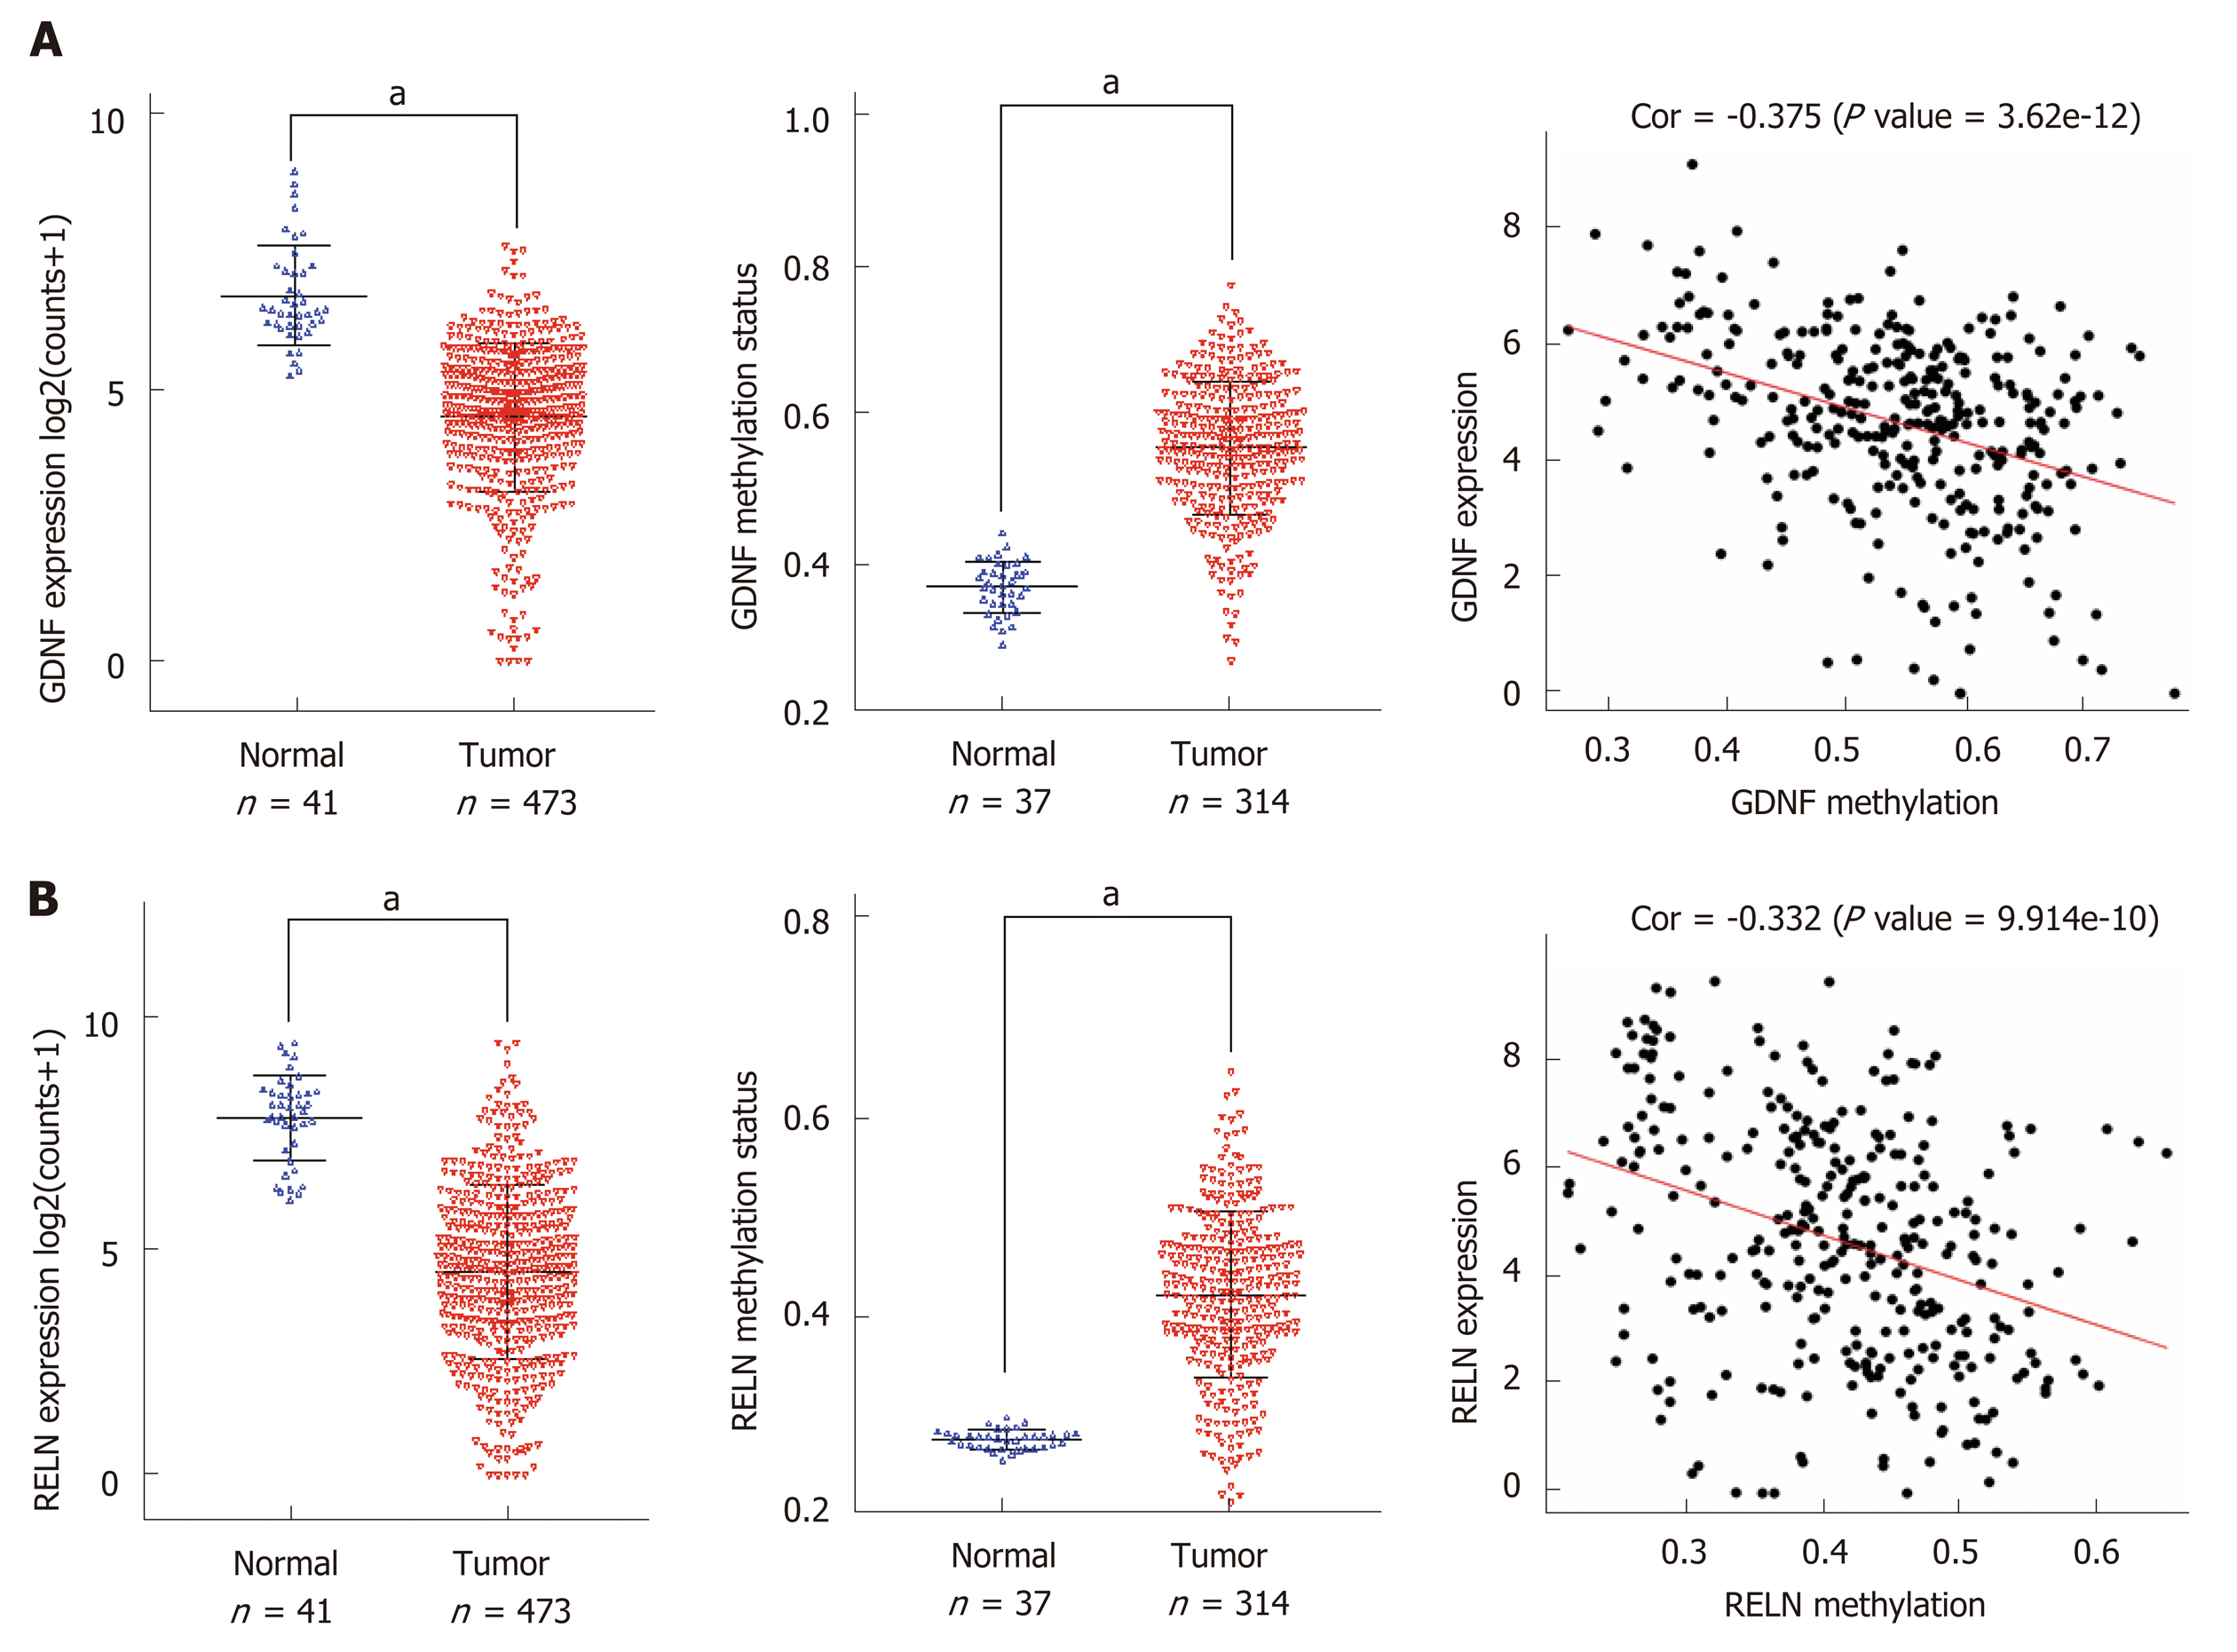
Figure 5 The expression, methylation status, and Spearman’s correlation analysis of glial cell-derived neurotrophic factor and reelin.
A: The Cancer Genome Atlas (TCGA) database was utilized to analyze the expression and methylation status of glial cell-derived neurotrophic factor and the correlation between them; B: The TCGA database was utilized to analyze the expression and methylation status of reelin and the correlation between them. aP < 0.01. GDNF: Glial cell-derived neurotrophic factor; RELN: Reelin; TCGA: The Cancer Genome Atlas.
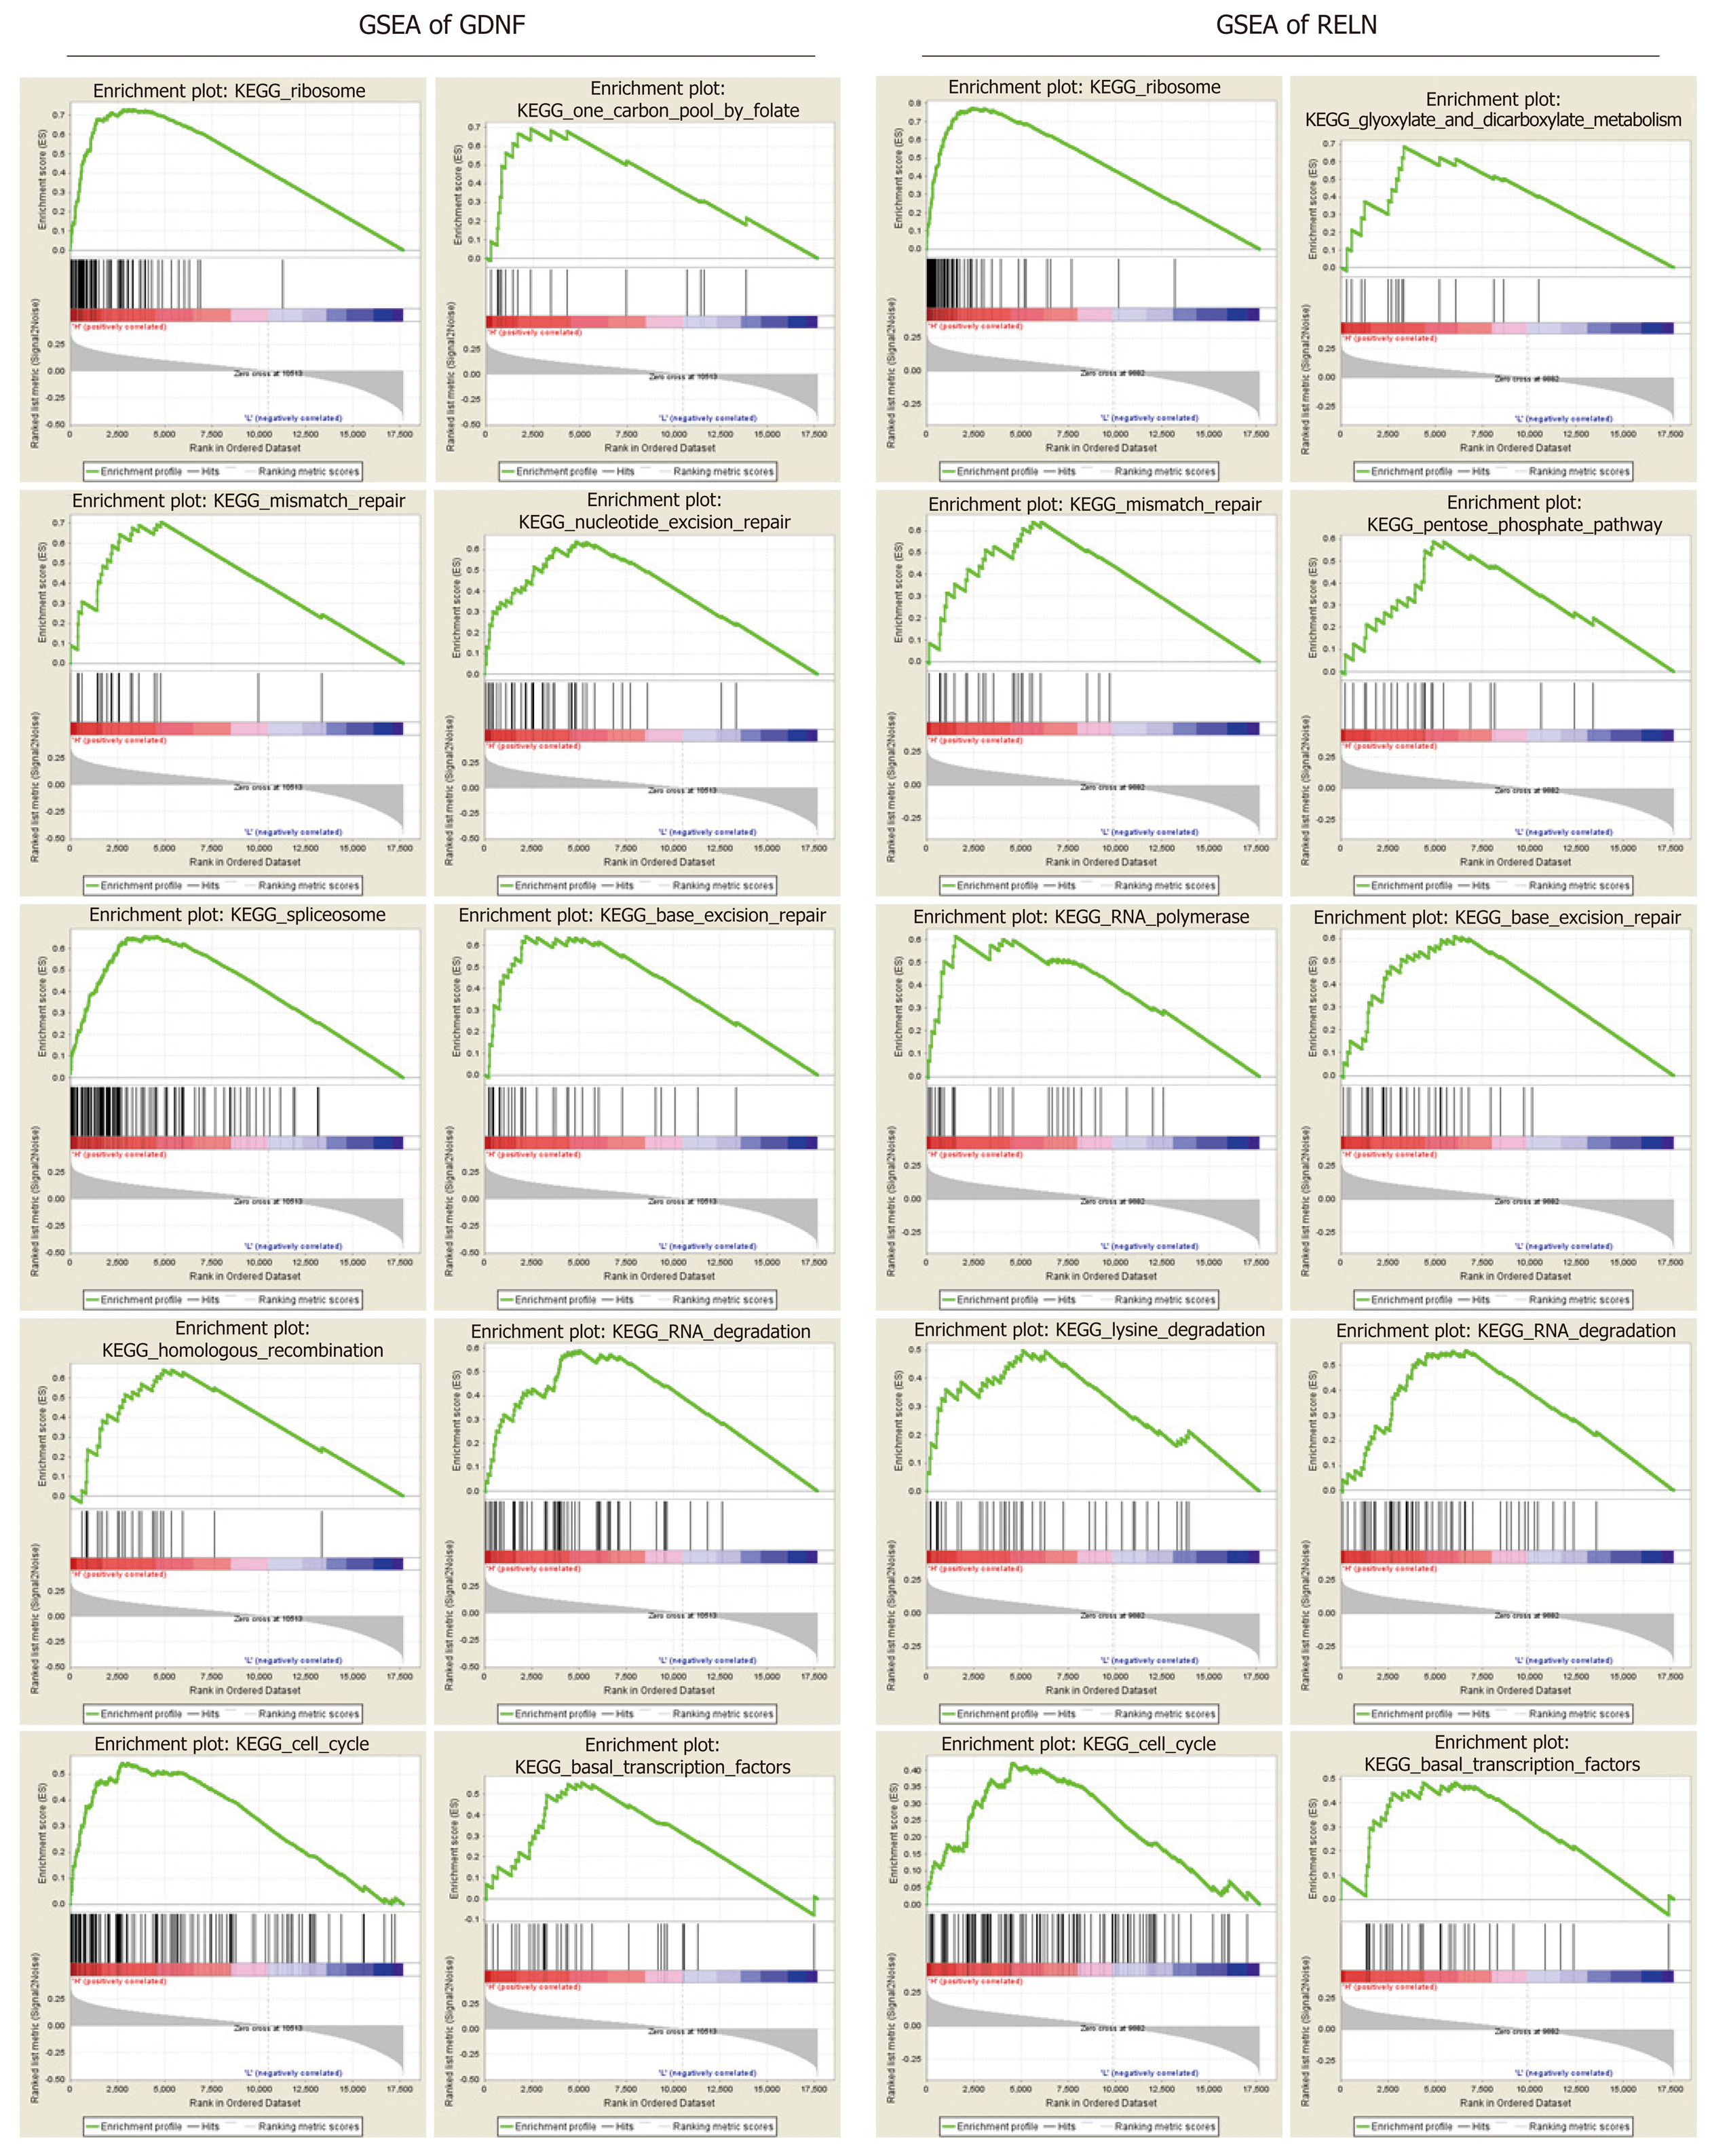
Figure 6 Gene set enrichment analysis of glial cell-derived neurotrophic factor and reelin.
A: Gene set enrichment analysis (GSEA) of glial cell-derived neurotrophic factor (GDNF); B: GSEA of reelin (RELN). GSEA of GDNF and RELN showing that hypermethylation of GDNF and RELN were enriched in multiple cancer-related pathways. GDNF: Glial cell-derived neurotrophic factor; RELN: Reelin; GSEA: Gene set enrichment analysis; KEGG: Kyoto Encyclopedia of Genes and Genomes.
Figure 7 Protein–protein interactions of glial cell-derived neurotrophic factor and reelin.
The STRING protein database was utilized to analyze the protein-protein interactions of glial cell-derived neurotrophic factor and reelin.
- Citation: Liang Y, Zhang C, Dai DQ. Identification of differentially expressed genes regulated by methylation in colon cancer based on bioinformatics analysis. World J Gastroenterol 2019; 25(26): 3392-3407
- URL: https://www.wjgnet.com/1007-9327/full/v25/i26/3392.htm
- DOI: https://dx.doi.org/10.3748/wjg.v25.i26.3392


