Copyright
©The Author(s) 2019.
World J Gastroenterol. Jun 21, 2019; 25(23): 2887-2897
Published online Jun 21, 2019. doi: 10.3748/wjg.v25.i23.2887
Published online Jun 21, 2019. doi: 10.3748/wjg.v25.i23.2887
Figure 1 An example showing measurement of the area of submucosal invasion on a digital slide of a pT1 colorectal cancer (green area).
The position of the destroyed muscularis mucosae has been estimated. The scale bar signifies 2 mm.
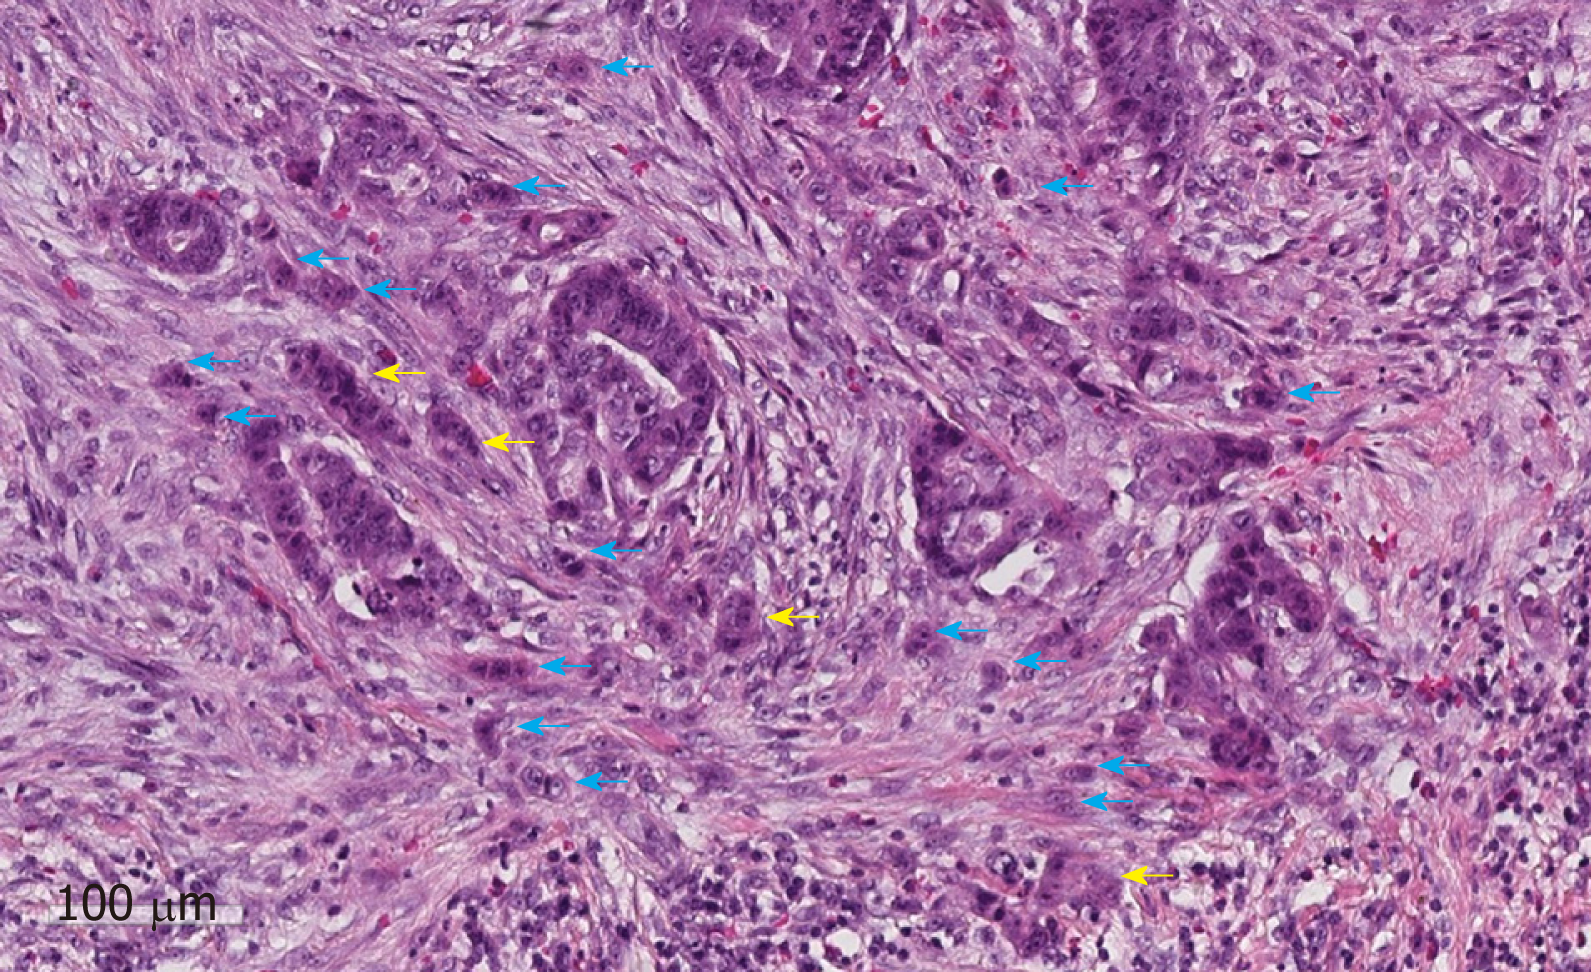
Figure 2 An example of tumour budding (blue arrows) and poorly differentiated clusters (yellow arrows) at the invasive edge of a pT1 colorectal cancer.
The scale bar signifies 100 µm.
- Citation: Brockmoeller SF, West NP. Predicting systemic spread in early colorectal cancer: Can we do better? World J Gastroenterol 2019; 25(23): 2887-2897
- URL: https://www.wjgnet.com/1007-9327/full/v25/i23/2887.htm
- DOI: https://dx.doi.org/10.3748/wjg.v25.i23.2887


