Copyright
©The Author(s) 2018.
World J Gastroenterol. Nov 28, 2018; 24(44): 4989-5004
Published online Nov 28, 2018. doi: 10.3748/wjg.v24.i44.4989
Published online Nov 28, 2018. doi: 10.3748/wjg.v24.i44.4989
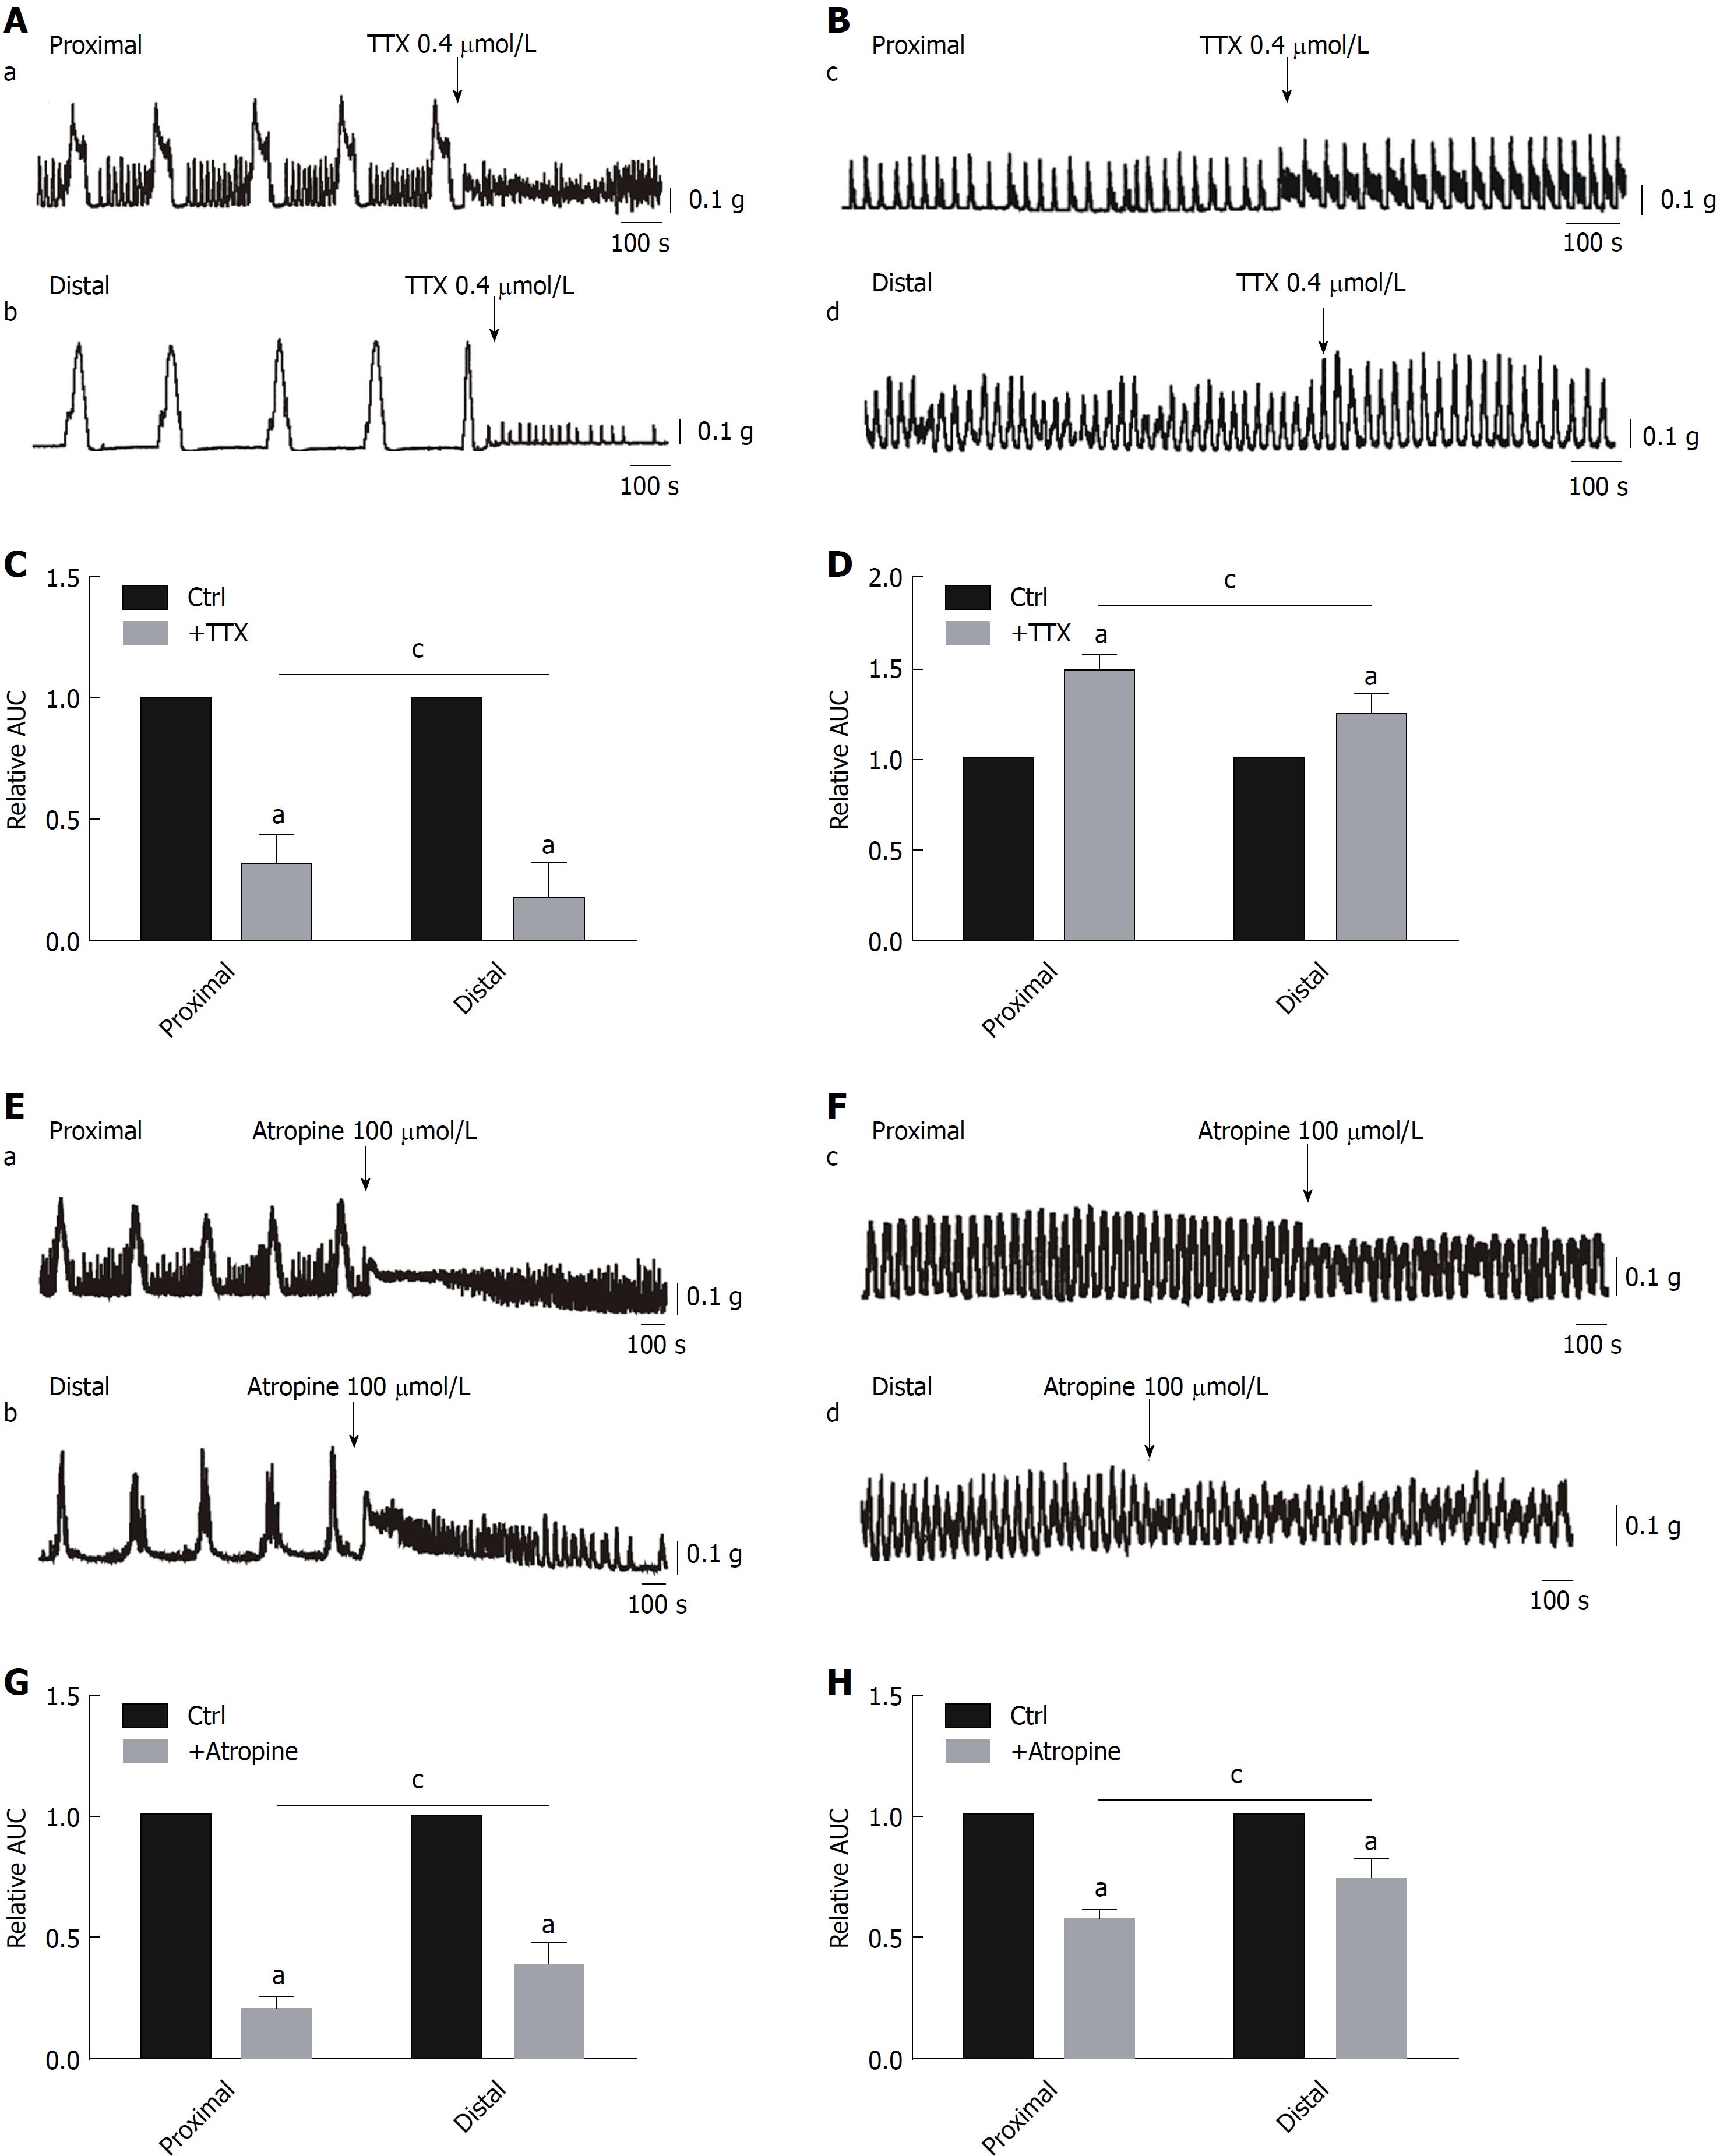
Figure 1 Effects of tetrodotoxin and atropine on smooth muscle contractions of the colon.
A and C: Inhibitory effects of tetrodotoxin (TTX) treatment on colonic migrating motor complexes (CMMCs) in the proximal and distal colon, and summary data of the area under the curve (AUC) at 300 s. It is worth noting that AUC measurements can demonstrate the sum of both the amplitudes and frequencies. The data are normalized to the control value (before the application of TTX) (n = 6; aP < 0.05 vs control; cP < 0.05 vs proximal colon). B and D: Enhanced effects of TTX on spontaneous contractions in the proximal and distal colon of mice and summary of the contractile responses to TTX, as indicated by the AUC at 200 s, in the smooth muscle tissues of the proximal and distal colon of mice. The data are normalized to the control value (before the application of TTX) (n = 7; aP < 0.05 vs control; cP < 0.05 vs proximal colon). E and G: Responses of CMMCs to atropine in the proximal and distal colon and summary of data as indicated by the AUC at 300 s. The data are normalized to the control value (before the application of atropine) (n = 5; aP < 0.05 vs control; cP < 0.05 vs proximal colon). F and H: Inhibitory effects of atropine on spontaneous contraction in the proximal and distal colon and summary of data showing contractile responses to atropine as indicated by the AUC at 200 s. The data are normalized to the control value (before the application of atropine) (n = 7; aP < 0.05 vs control; cP < 0.05 vs proximal colon). TTX: Tetrodotoxin; AUC: Area under the curve.
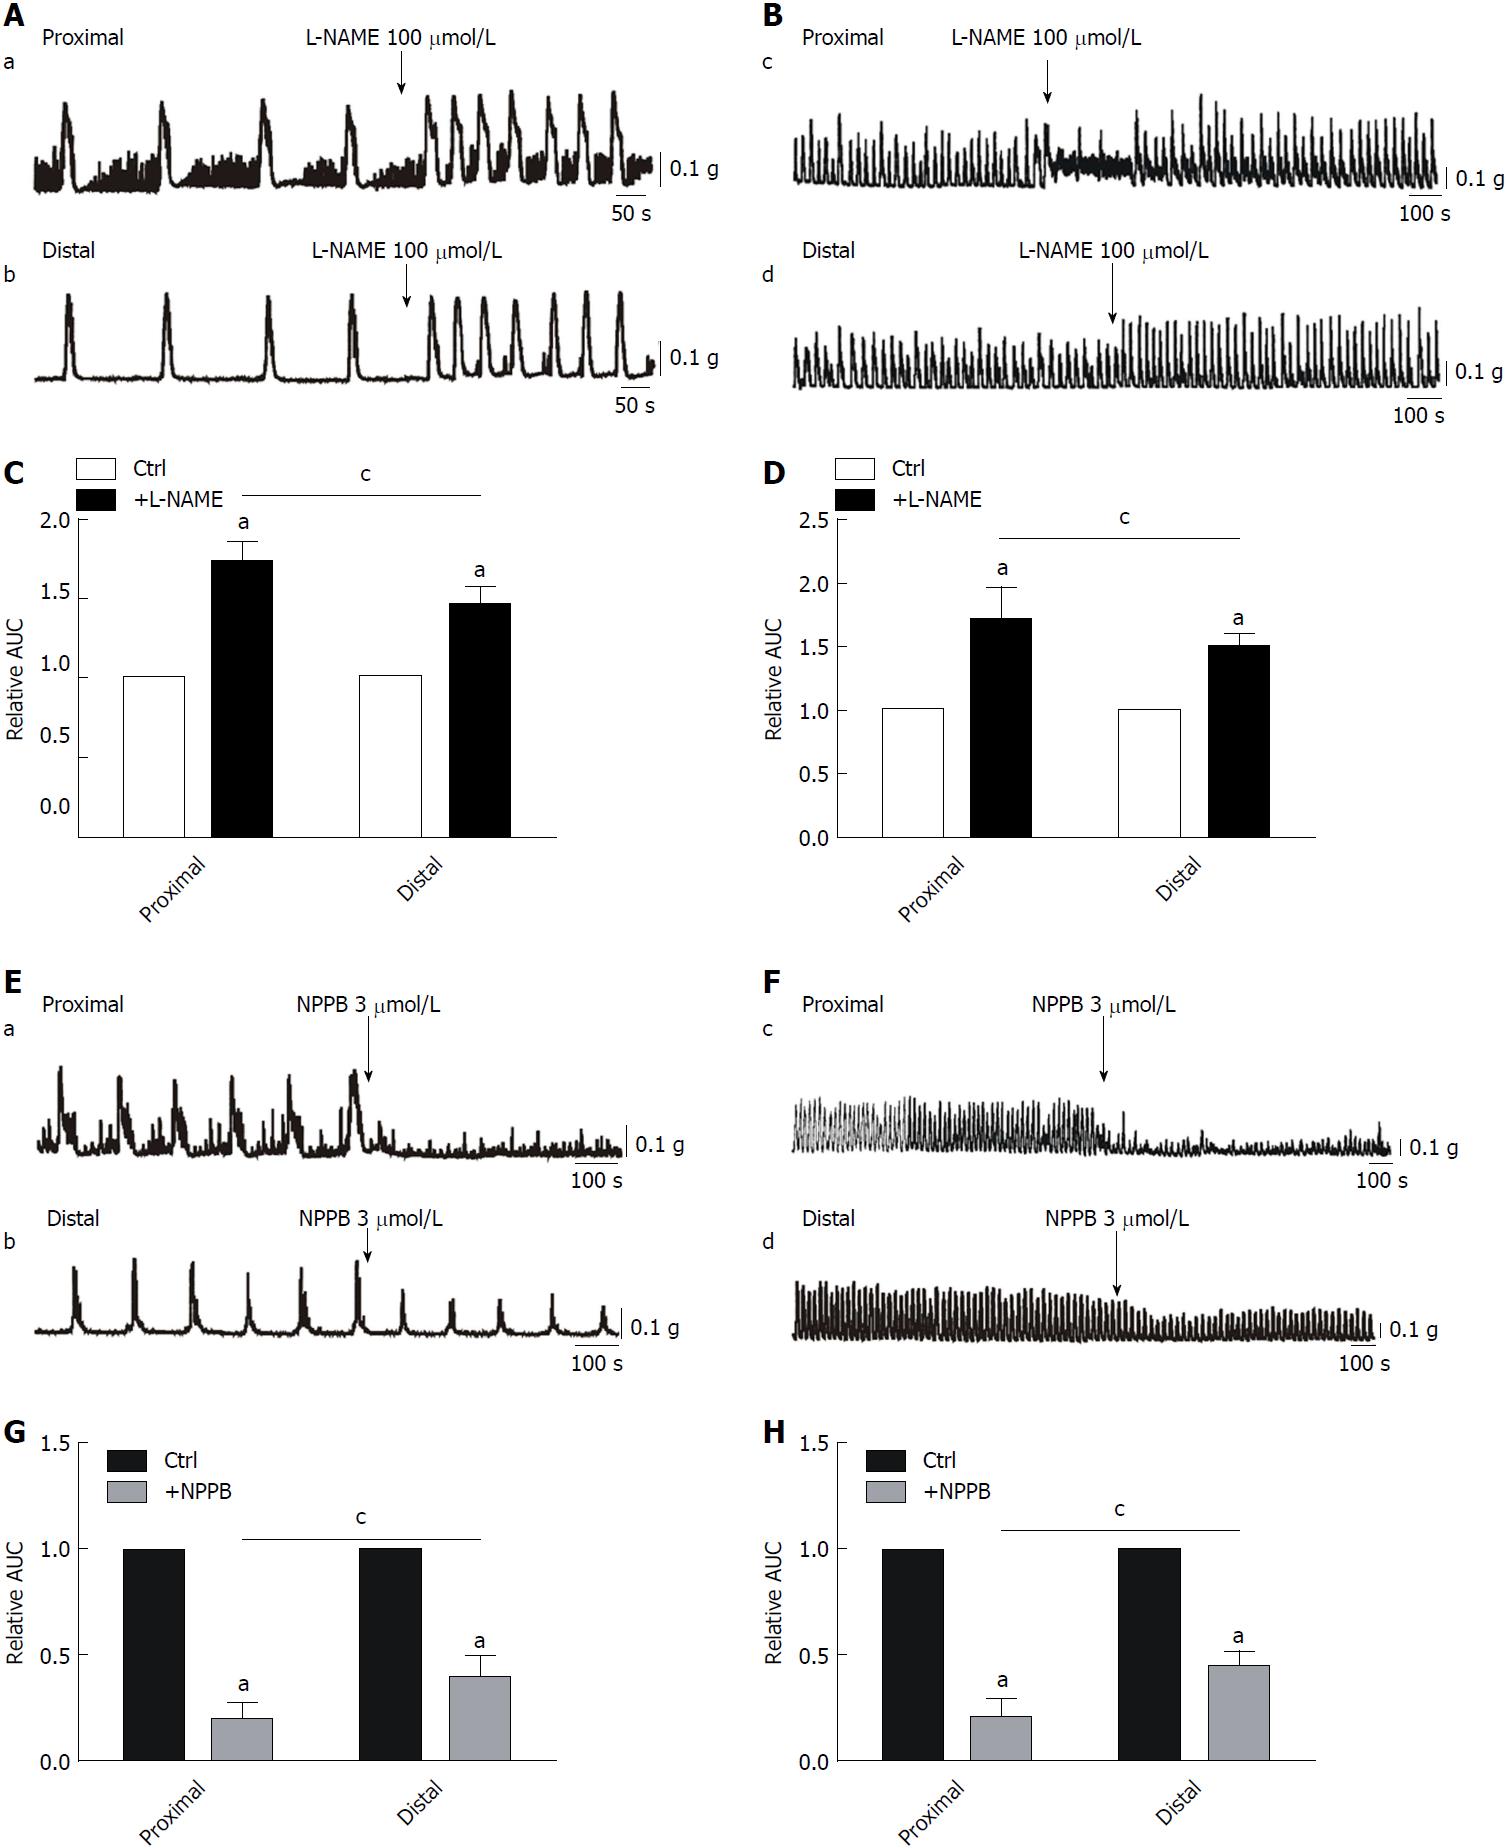
Figure 2 Effects of L-NAME and NPPB on smooth muscle contractions of the colon.
A and C: Increased effects of L-NAME on colonic migrating motor complexes (CMMCs) in the proximal and distal colon and summary data of the area under the curve (AUC) at 300 s. The data are normalized to the control value (before the application of L-NAME) (n = 7; aP < 0.05 vs control; cP < 0.05 vs proximal colon). B and D: Enhanced effects of L-NAME on spontaneous contraction in the proximal and distal colon of mice and summary of the contractile responses to L-NAME as indicated by the AUC at 200 s. The data are normalized to the control value (before the application of L-NAME) (n = 7; aP < 0.05 vs control; cP < 0.05 vs proximal colon). E and G: Responses of CMMCs to NPPB in the proximal and distal colon and the summary of data as indicated by the AUC at 300 s. The data are normalized to the control value (before the application of NPPB) (n = 5; aP < 0.05 vs control; cP < 0.05 vs proximal colon). F and H: Inhibitory effects of NPPB (3 μmol/L) on spontaneous contraction in the proximal and distal colon and summary of the data showing contractile responses to NPPB as indicated by the AUC at 200 s. The data are normalized to the control value (before the application of NPPB) (n = 5; aP < 0.05 vs control; cP < 0.05 vs proximal colon). AUC: Area under the curve.
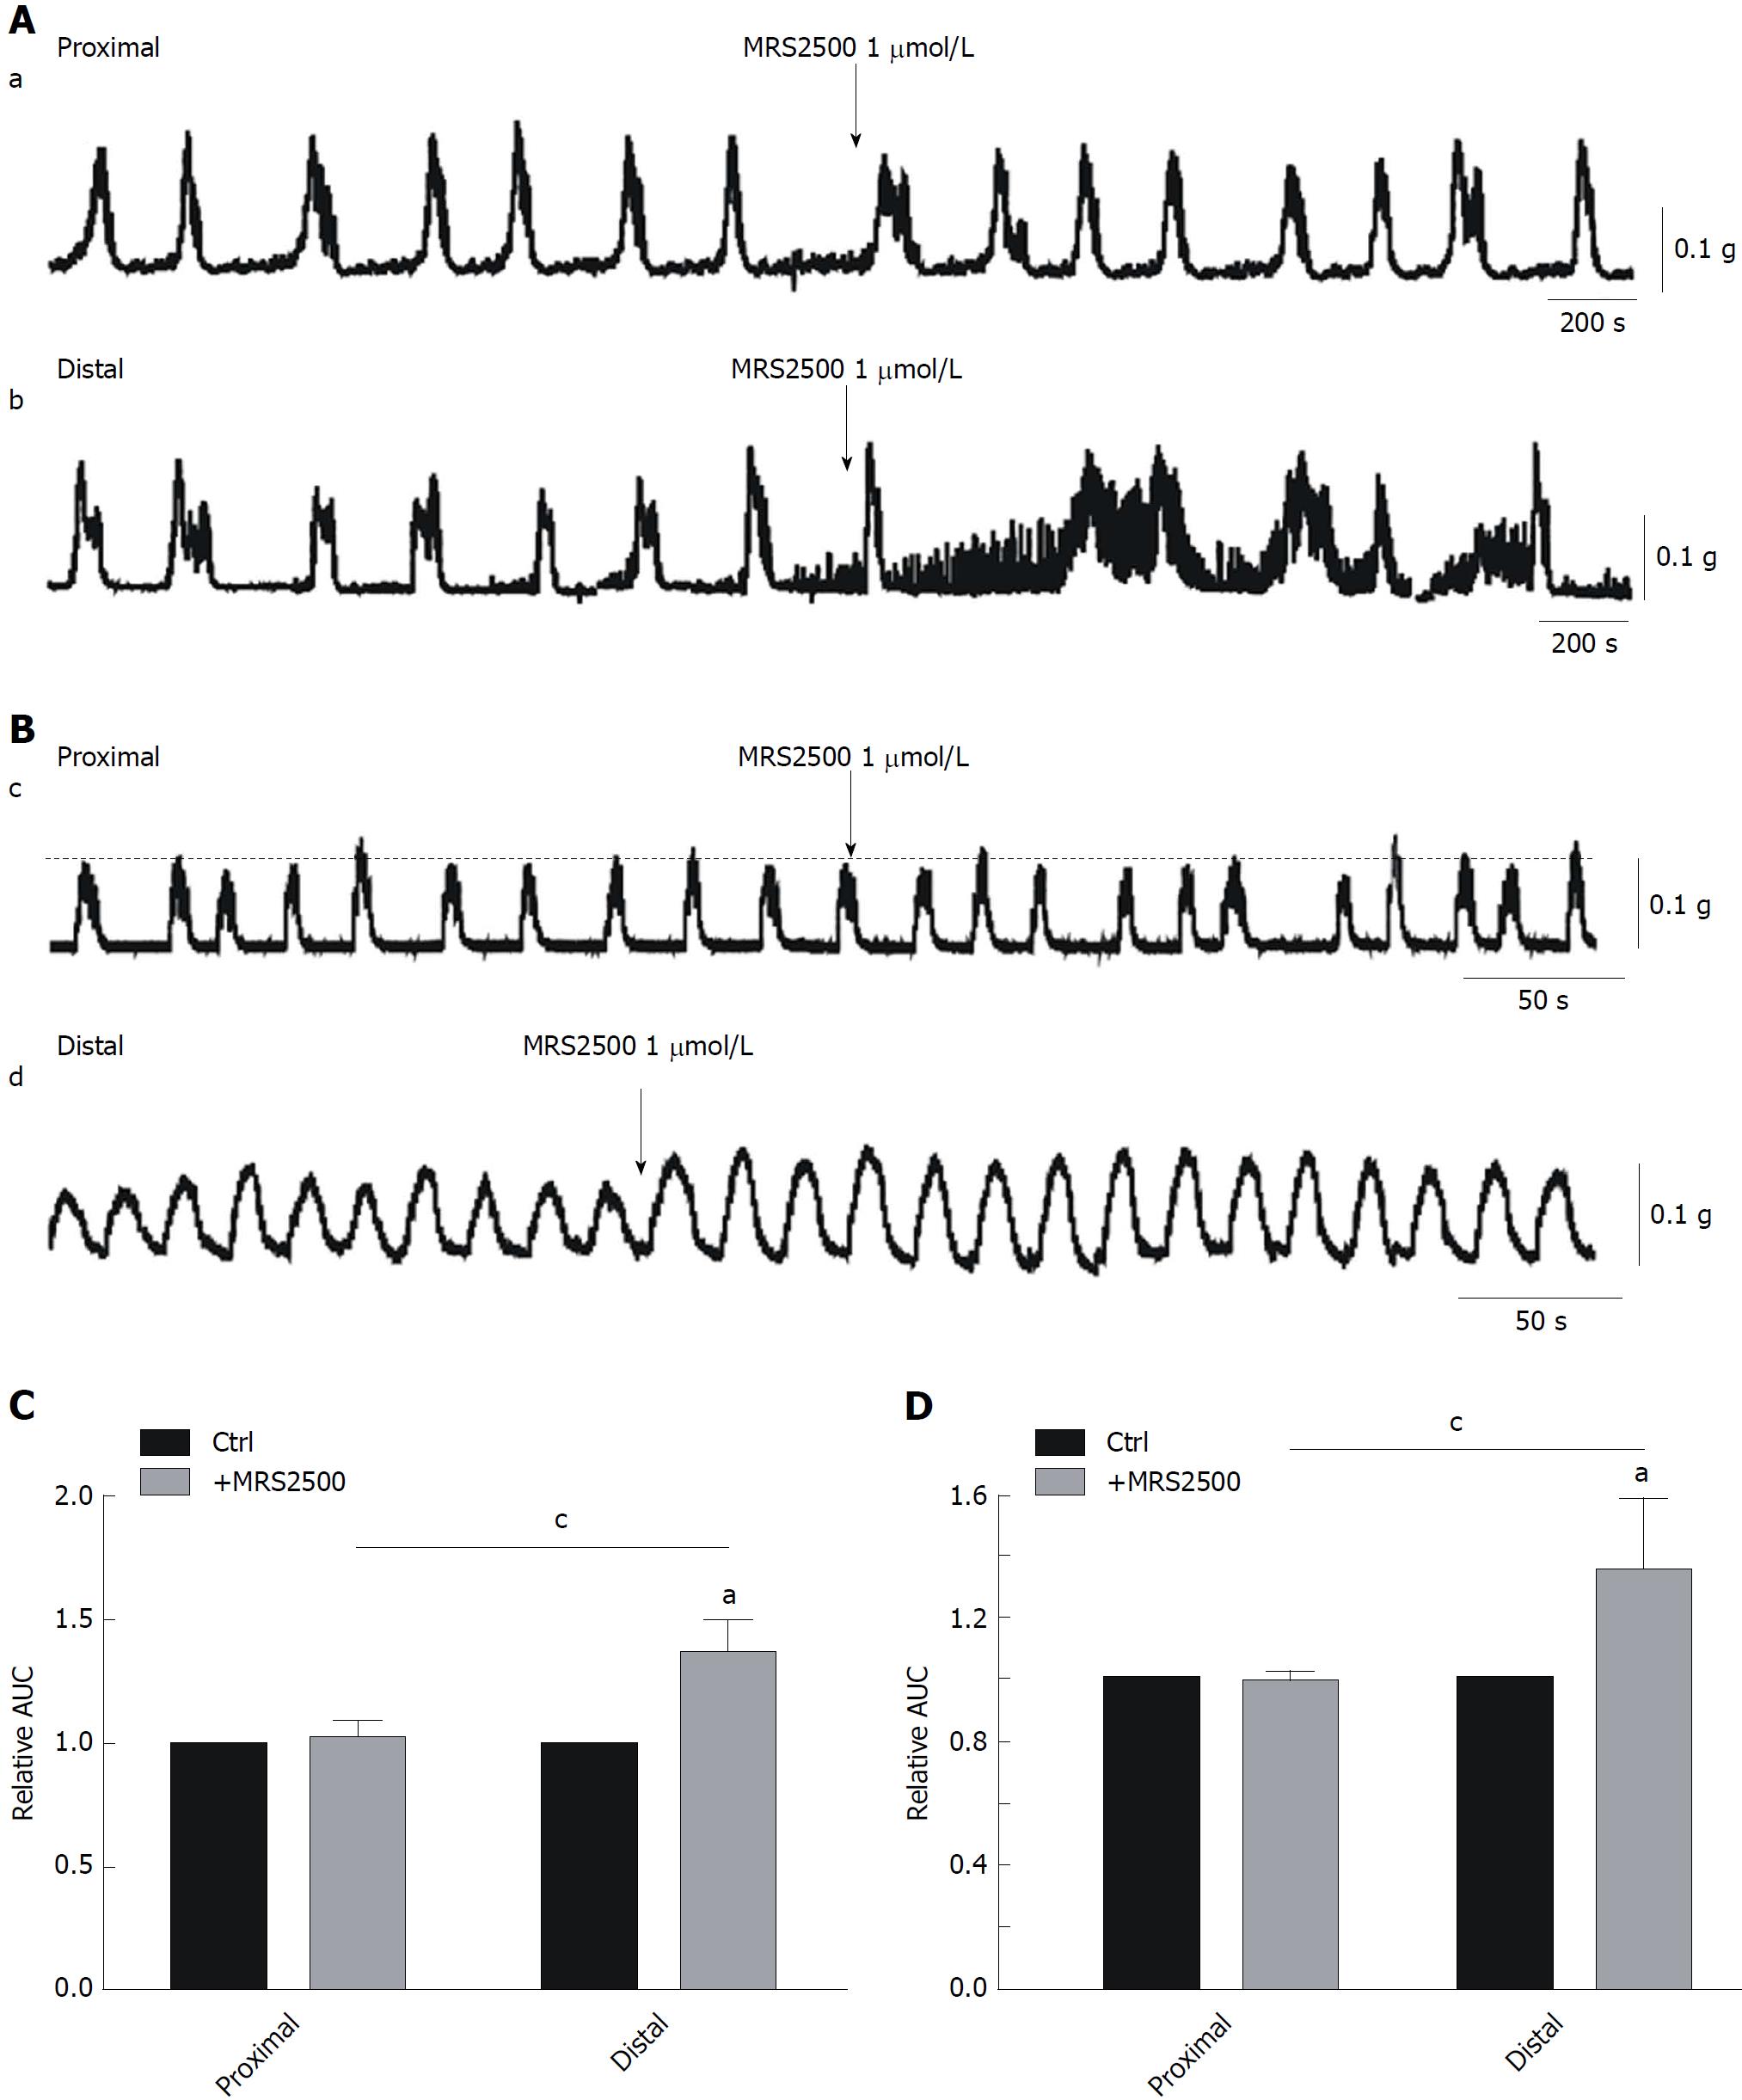
Figure 3 Effects of MRS2500 on smooth muscle contractions in the colon.
A and C: Effects of MRS2500 on colonic migrating motor complexes (CMMCs) in the proximal and distal colon and summary of the area under the curve (AUC) at 300 s. The data are normalized to the control value (before the application of MRS2500) (n = 8; aP < 0.05 vs control; cP < 0.05 vs proximal colon). B and D: Representative traces illustrating the effects of the P2Y1 antagonist MRS2500 on the contractions of colonic smooth muscles in the proximal and distal colon of mice and summary of the contractile responses to MRS2500 as indicated by the AUC at 200 s. The data are normalized to the control value (before the application of MRS2500) (n = 8; aP < 0.05 vs control; cP < 0.05 vs proximal colon). AUC: Area under the curve.
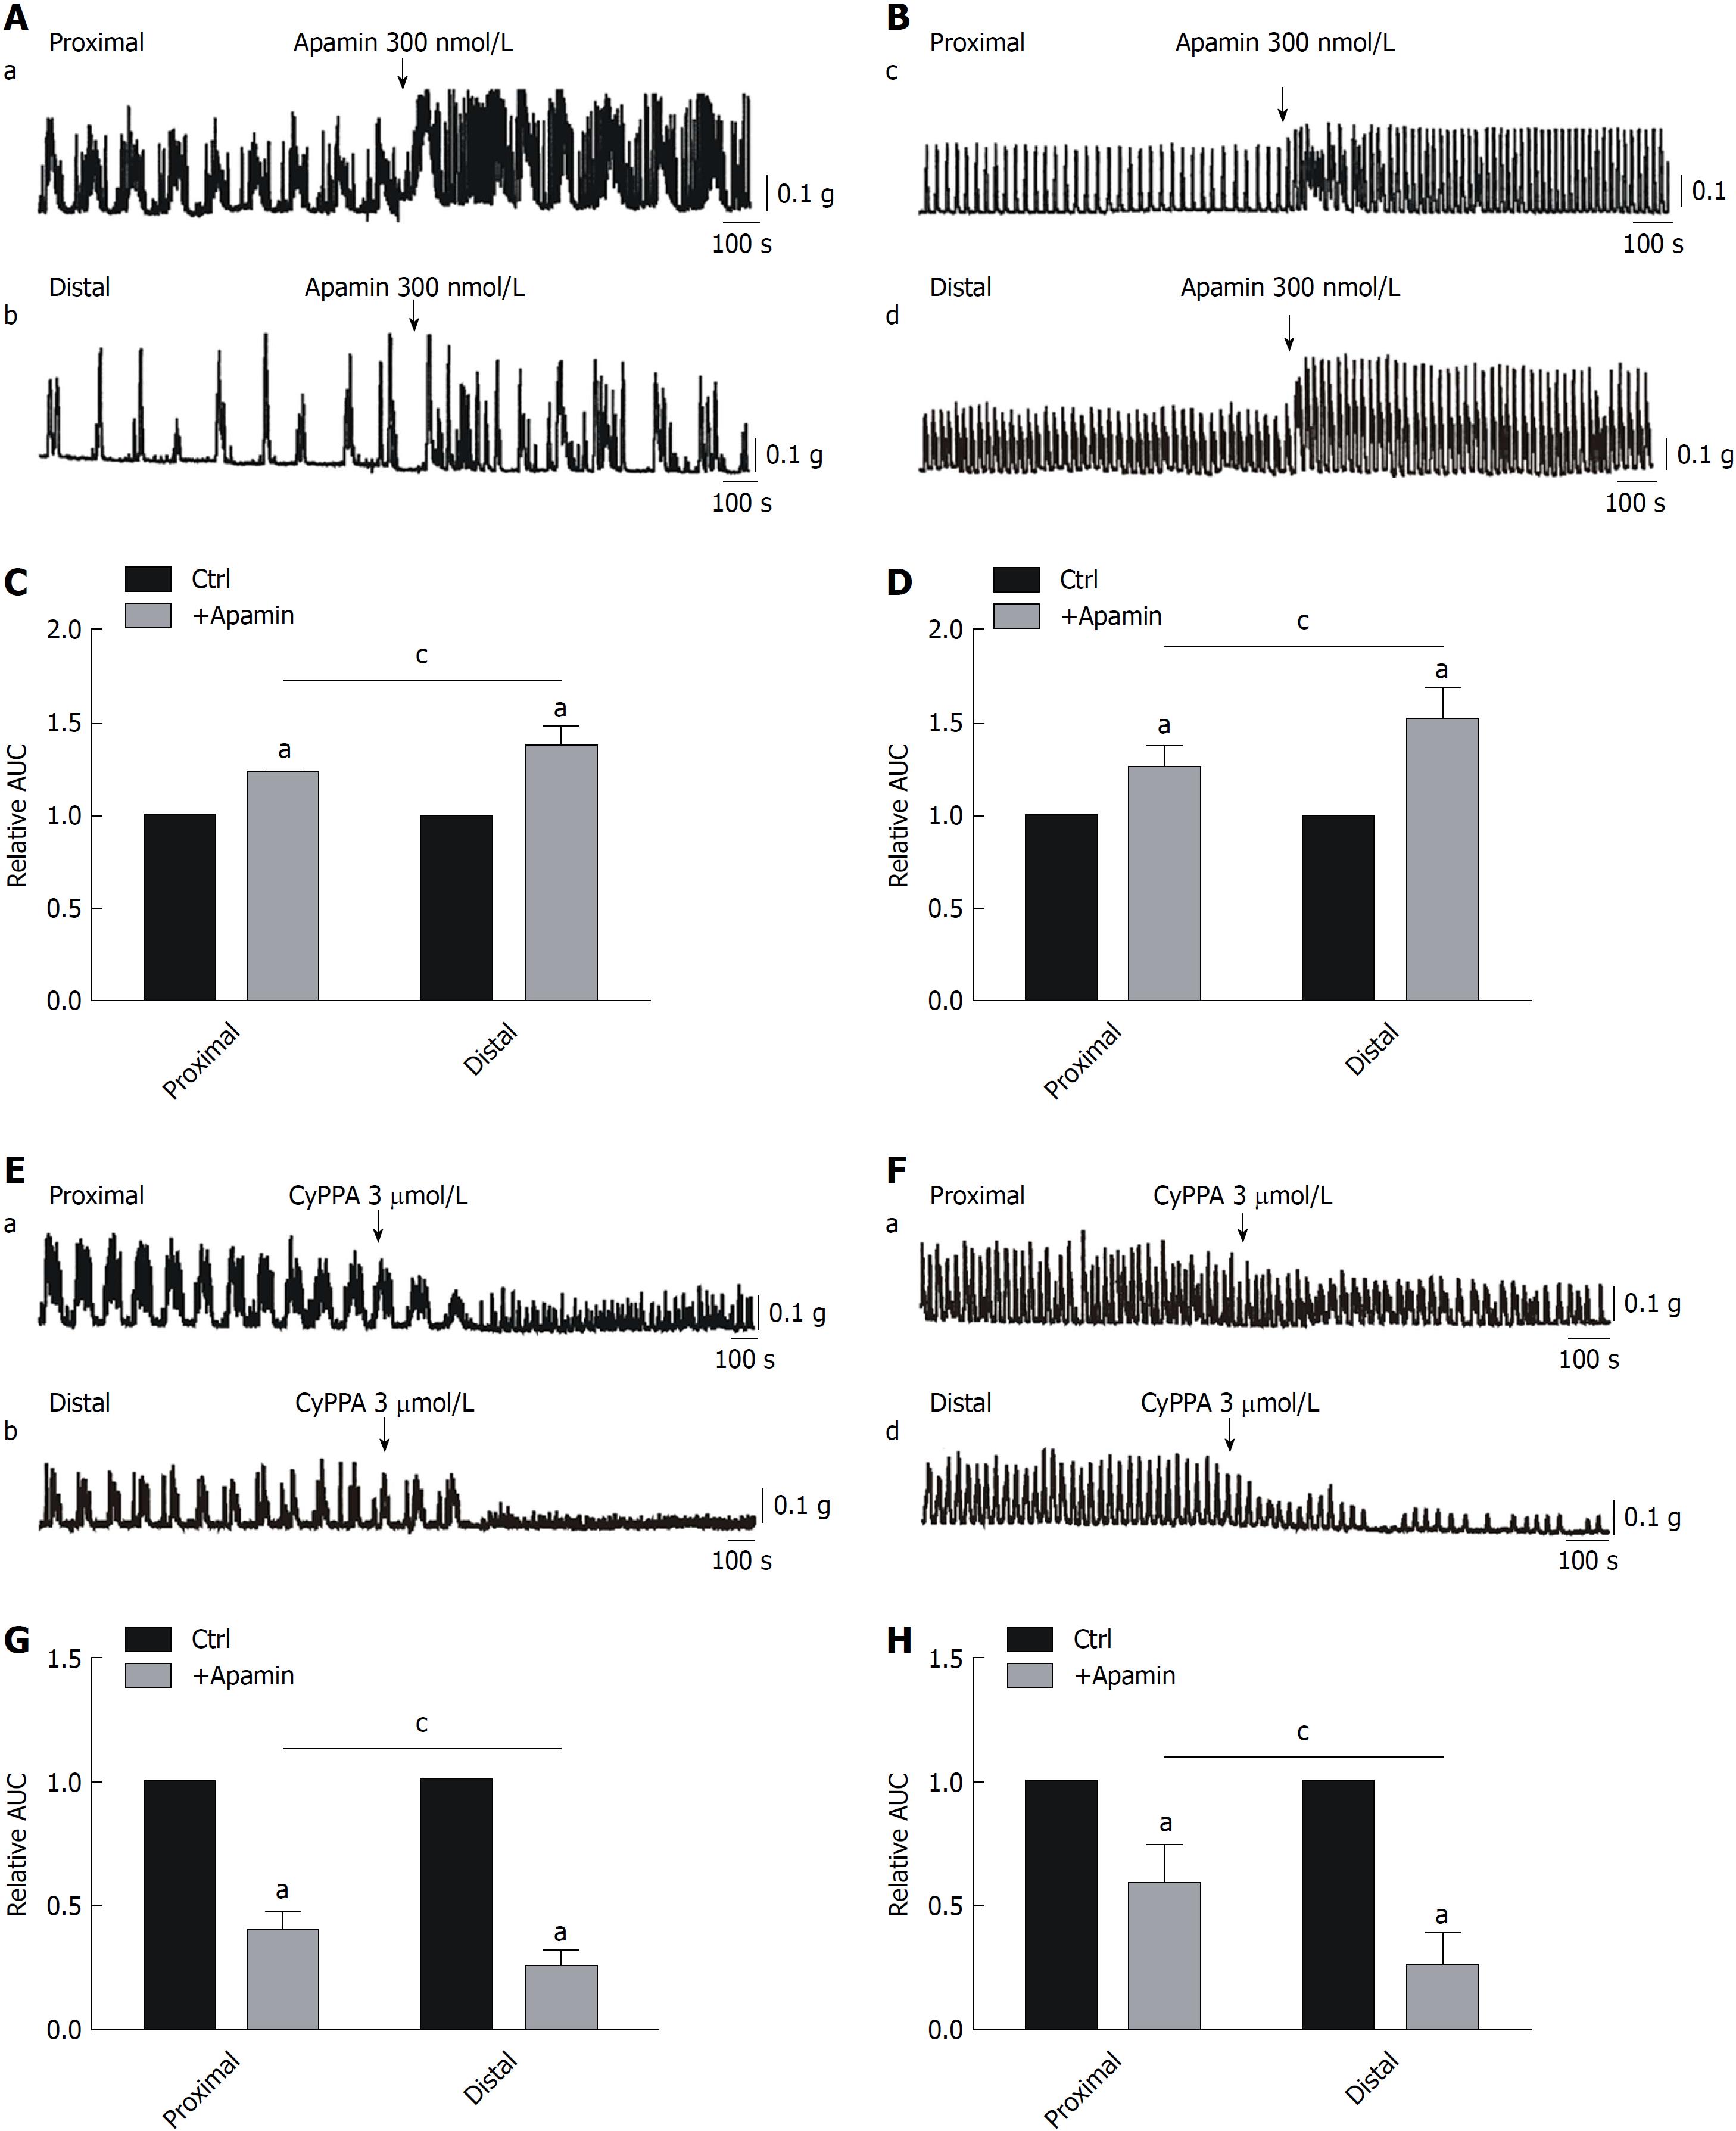
Figure 4 Effects of small conductance calcium-activated potassium channel 3 channel antagonist and agonist treatment on smooth muscle contractions in the murine colon.
A and C: Responses of colonic migrating motor complexes (CMMCs) to small conductance calcium-activated potassium channel 3 (SK3) channel antagonist treatment in the proximal and distal colon and summary of the CMMC responses to apamin as indicated by the area under the curve (AUC) at 300 s. The data are normalized to the control value (before the application of apamin) (n = 7; aP < 0.05 vs control; cP < 0.05 vs proximal colon). B and D: Enhanced effects of apamin (300 nmol/L) on spontaneous contractions in the proximal and distal colon and summary of the data showing contractile responses to apamin as indicated by the AUC at 200 s. The data are normalized to control (before the application of apamin) (n = 7; aP < 0.05 vs control; cP < 0.05 vs proximal colon). E and G: Responses of CMMCs to SK3 channel agonist treatment in the proximal and distal colon and summary of the CMMC responses to CyPPA as indicated by the AUC at 300 s. The data are normalized to the control value (before the application of CyPPA) (n = 7; aP < 0.05 vs control; cP < 0.05 vs proximal colon). F and H: Inhibitory effects of CyPPA on spontaneous contractions in the proximal and distal colon and summary of the data showing contractile responses to CyPPA as indicated by the AUC at 200 s. The data are normalized to the control value (before the application of CyPPA) (n = 7; aP < 0.05 vs control; cP < 0.05 vs proximal colon). AUC: Area under the curve.
Figure 5 Effects of anoctamin-1 and small conductance calcium-activated potassium channel 3 channel antagonist treatment on membrane potentials in the murine colon.
A: Summary of the resting membrane potentials of colonic smooth muscle cells from the proximal and distal colon of mice (n = 12; aP < 0.05). B: Responses of membrane potentials to anoctamin-1 (ANO1) antagonist treatment (NPPB, 3 μmol/L, arrow). C: Responses of membrane potentials to SK3 antagonist treatment (apamin, 300 nmol/L, arrow). D and E: Summary of data showing the average effects of NPPB and apamin on membrane potentials in colonic smooth muscle cells from both ends of the colon (NPPB n = 6; apamin n = 5; aP < 0.05). RMP: Resting membrane potentials.
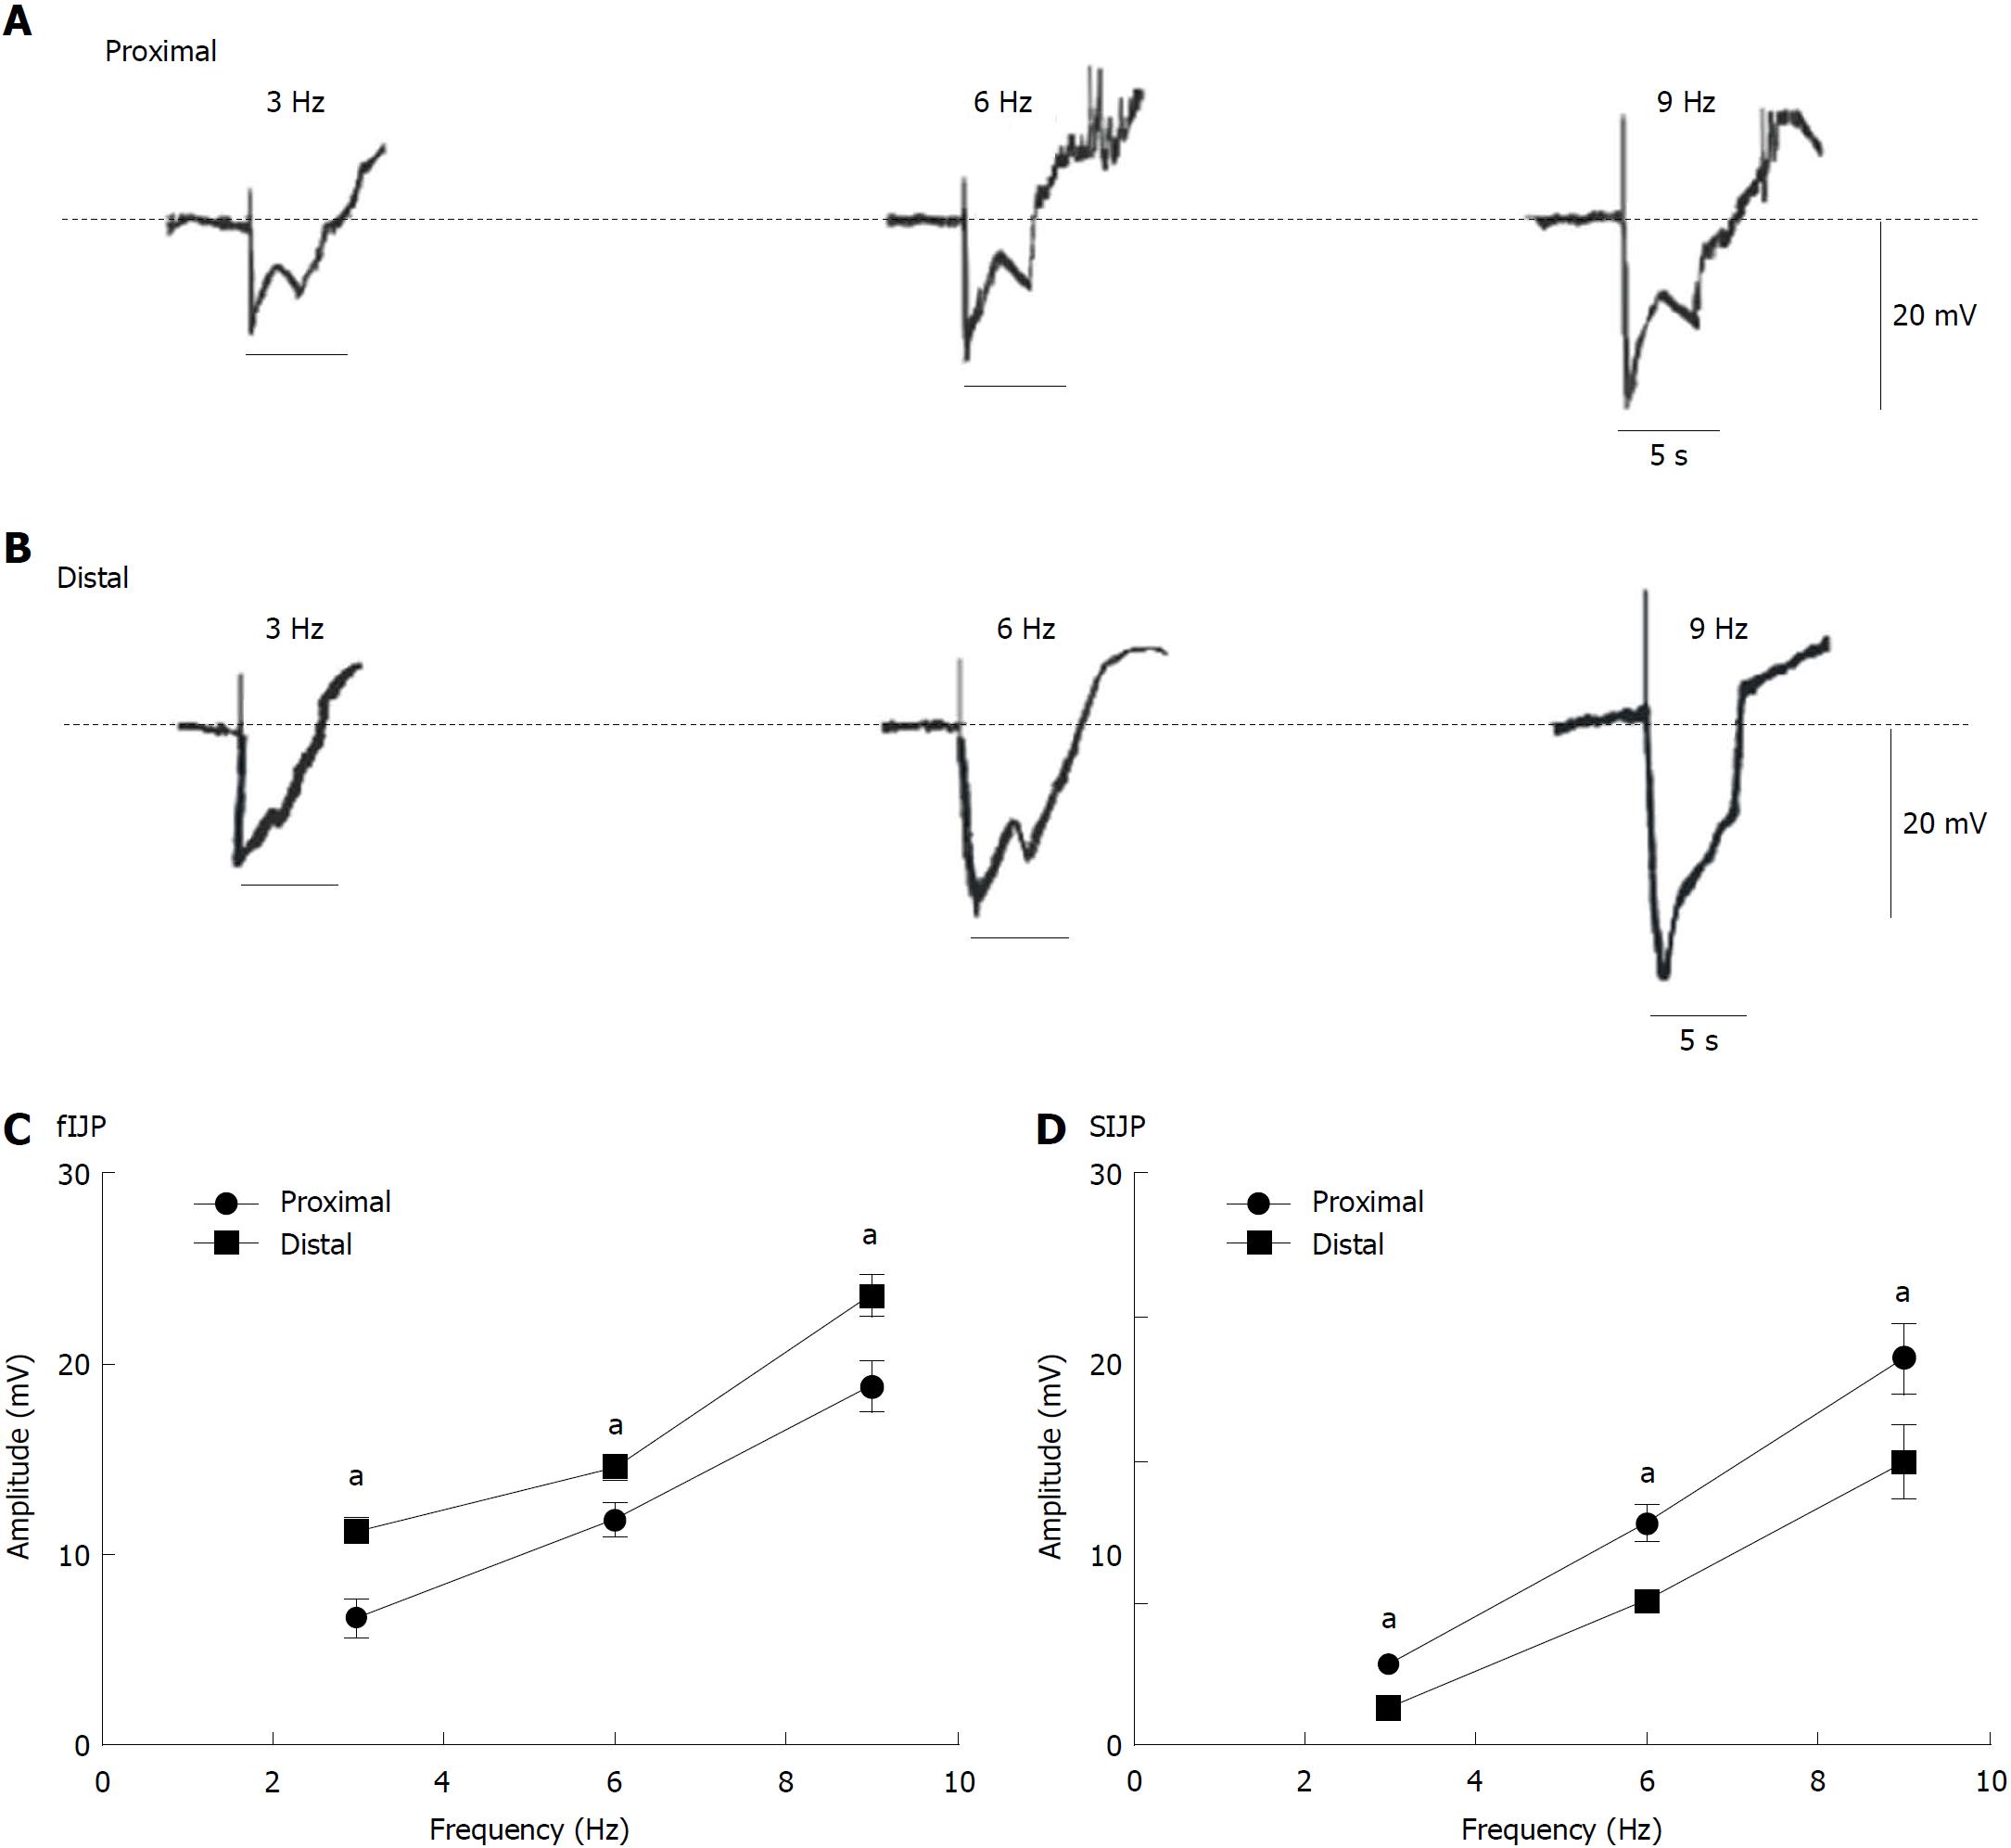
Figure 6 Membrane potentials evoked by electrical field stimulation in normal colonic proximal and distal muscles.
A: Electrical field stimulation (EFS) from the proximal colon at different frequencies (50 V; 3, 6, and 9 Hz for 5 s; black bars in each panel) elicited biphasic hyperpolarization comprising a peak component followed by sustained hyperpolarization. B: EFS from the proximal colon at different frequencies (50 V; 3, 6, and 9 Hz for 5 s; black bars in each panel). C and D: Summary of data showing the average amplitude of fast inhibitory junction potentials and slow inhibitory junction potentials at both ends of the colon (n = 8; aP < 0.05). fIJP: Fast inhibitory junction potential; sIJP: Slow inhibitory junction potential.
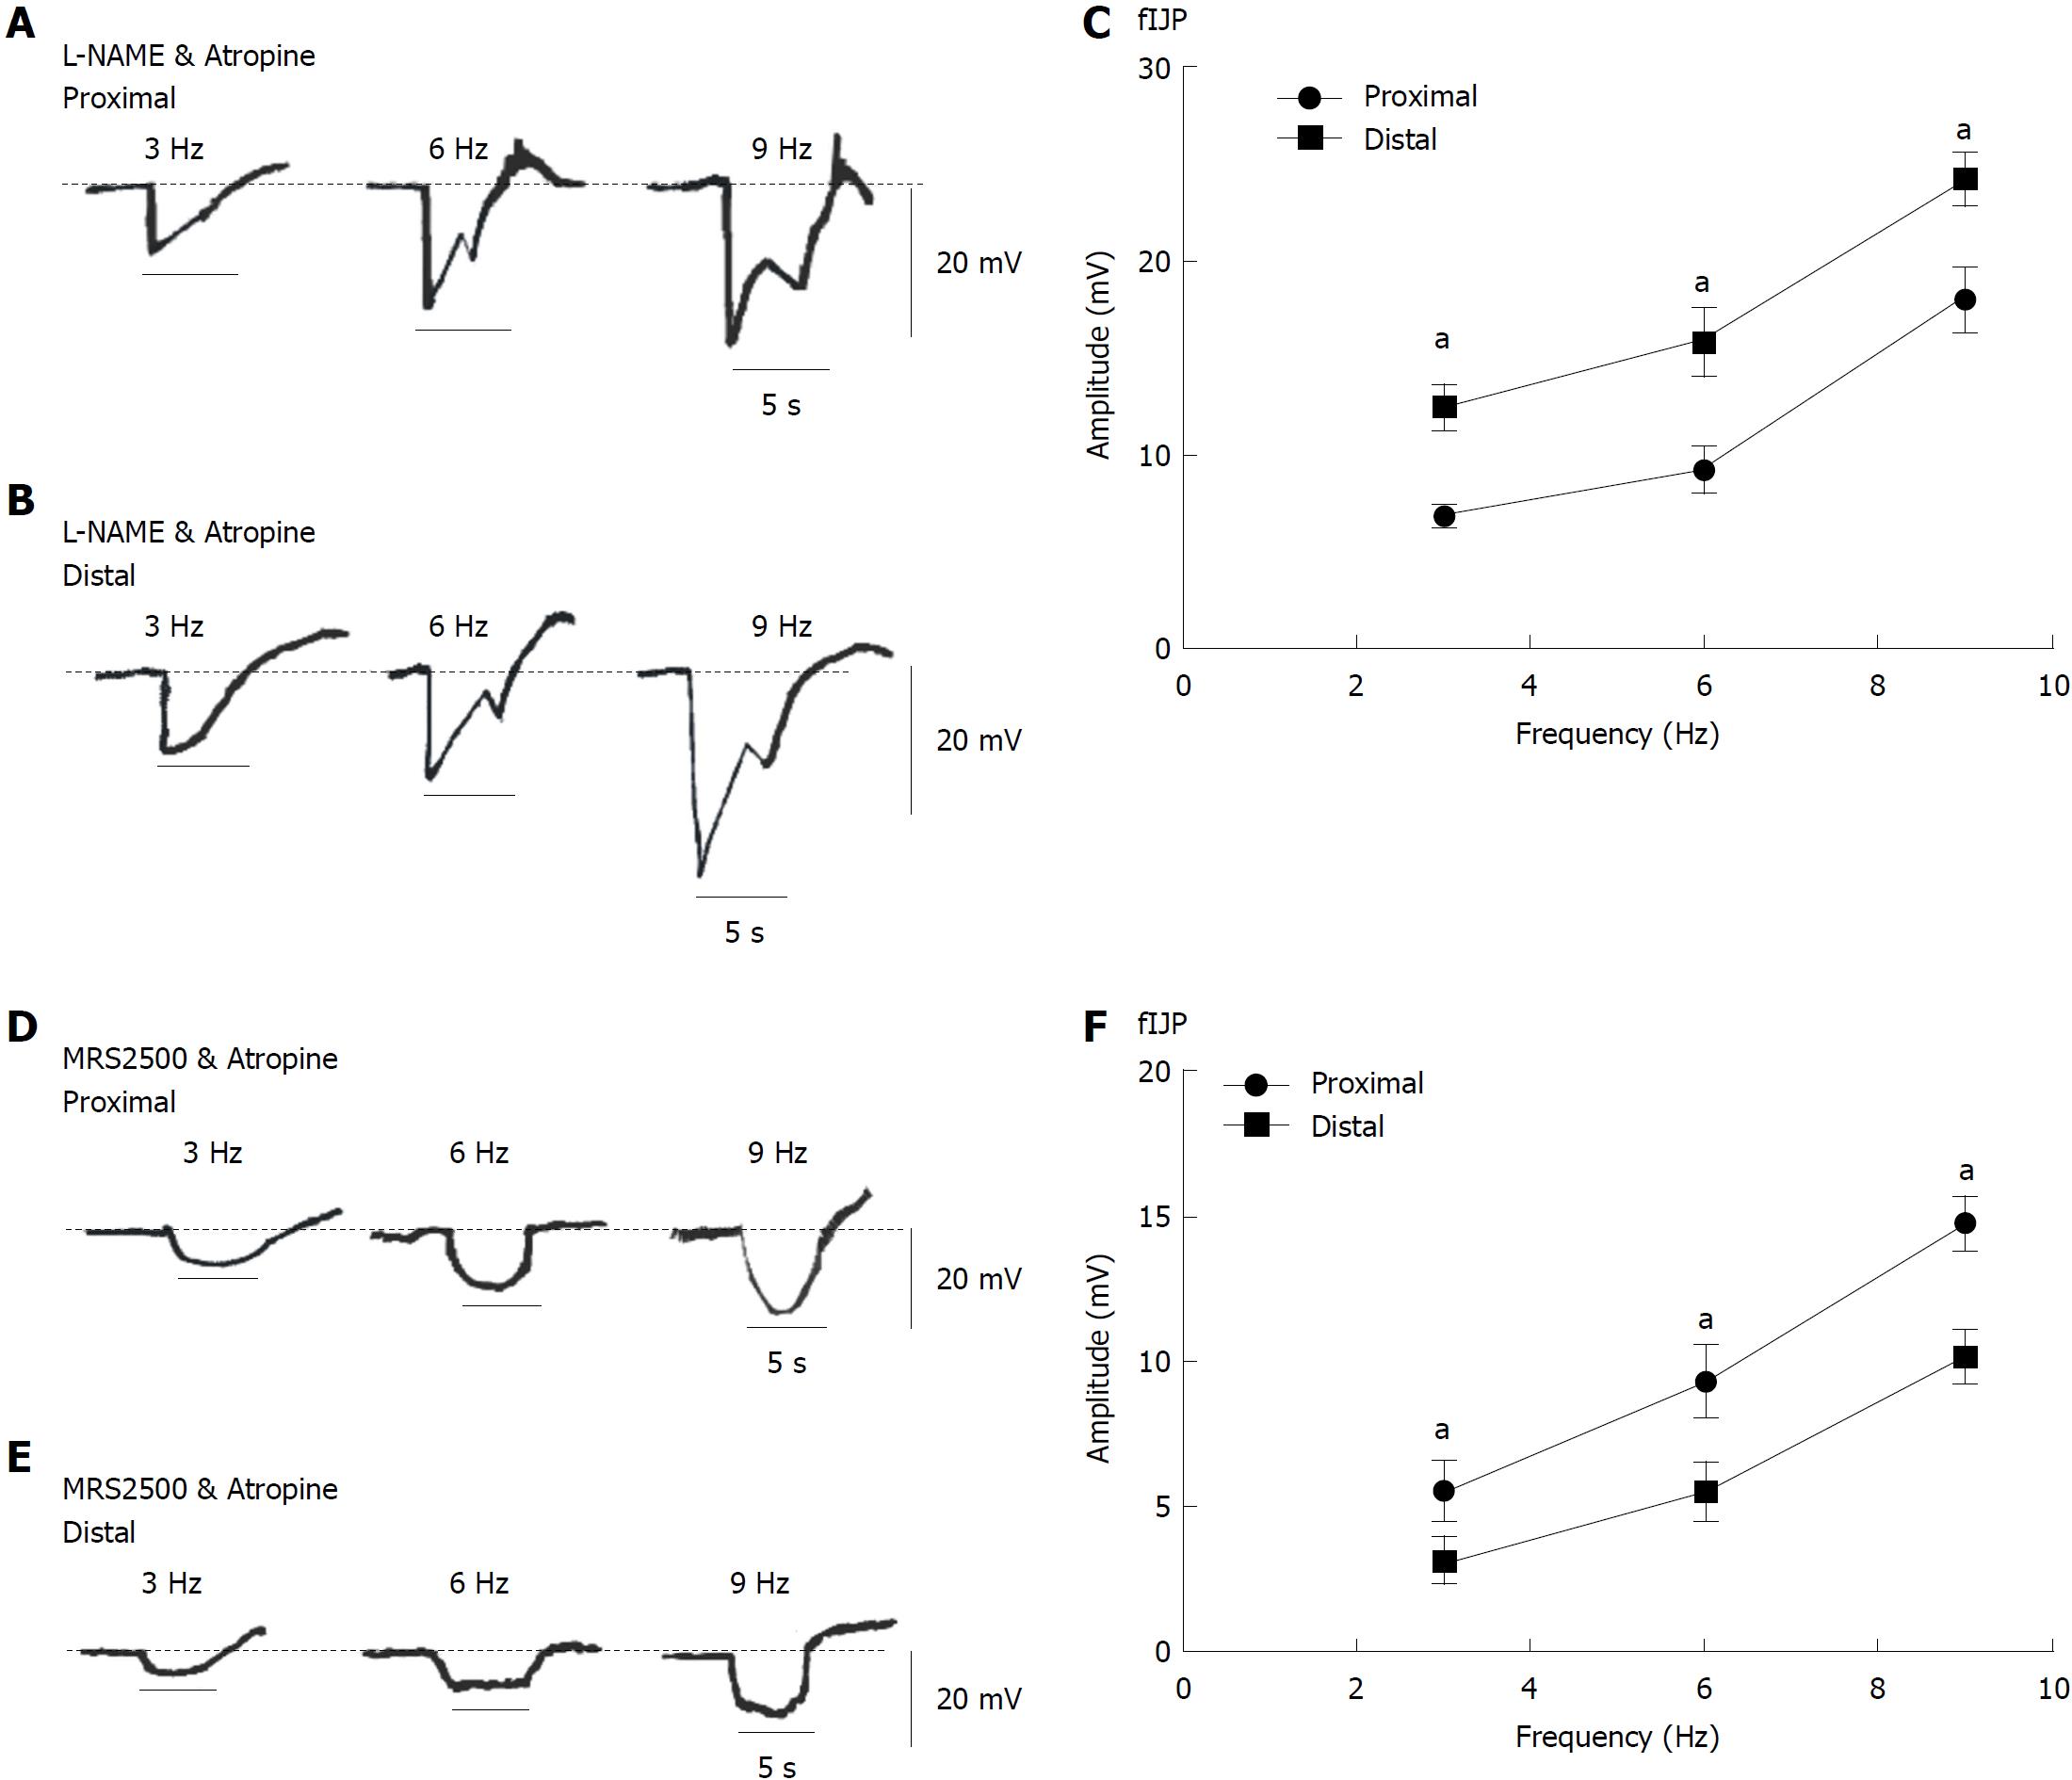
Figure 7 Fast inhibitory junction potential and slow inhibitory junction potential elicited by electrical field stimulation in smooth muscles of the proximal and distal colon.
A and B: Atropine and L-NAME treatment blocked excitatory junction potentials (EJPs) and decreased slow inhibitory junction potentials (sIJPs) but had no effect on fast IJPs (fIJPs) in colonic muscles from both ends. D and E: Atropine and MRS2500 treatment blocked EJPs and decreased fIJPs but had no effect on sIJPs in colonic muscles from both ends. C and F: Summary of data showing the average amplitude of fIJPs and sIJPs (in the presence of atropine and L-NAME, n = 8; in the presence of atropine and MRS2500, n = 7; aP < 0.05). fIJP: Fast inhibitory junction potential; sIJP: Slow inhibitory junction potential.
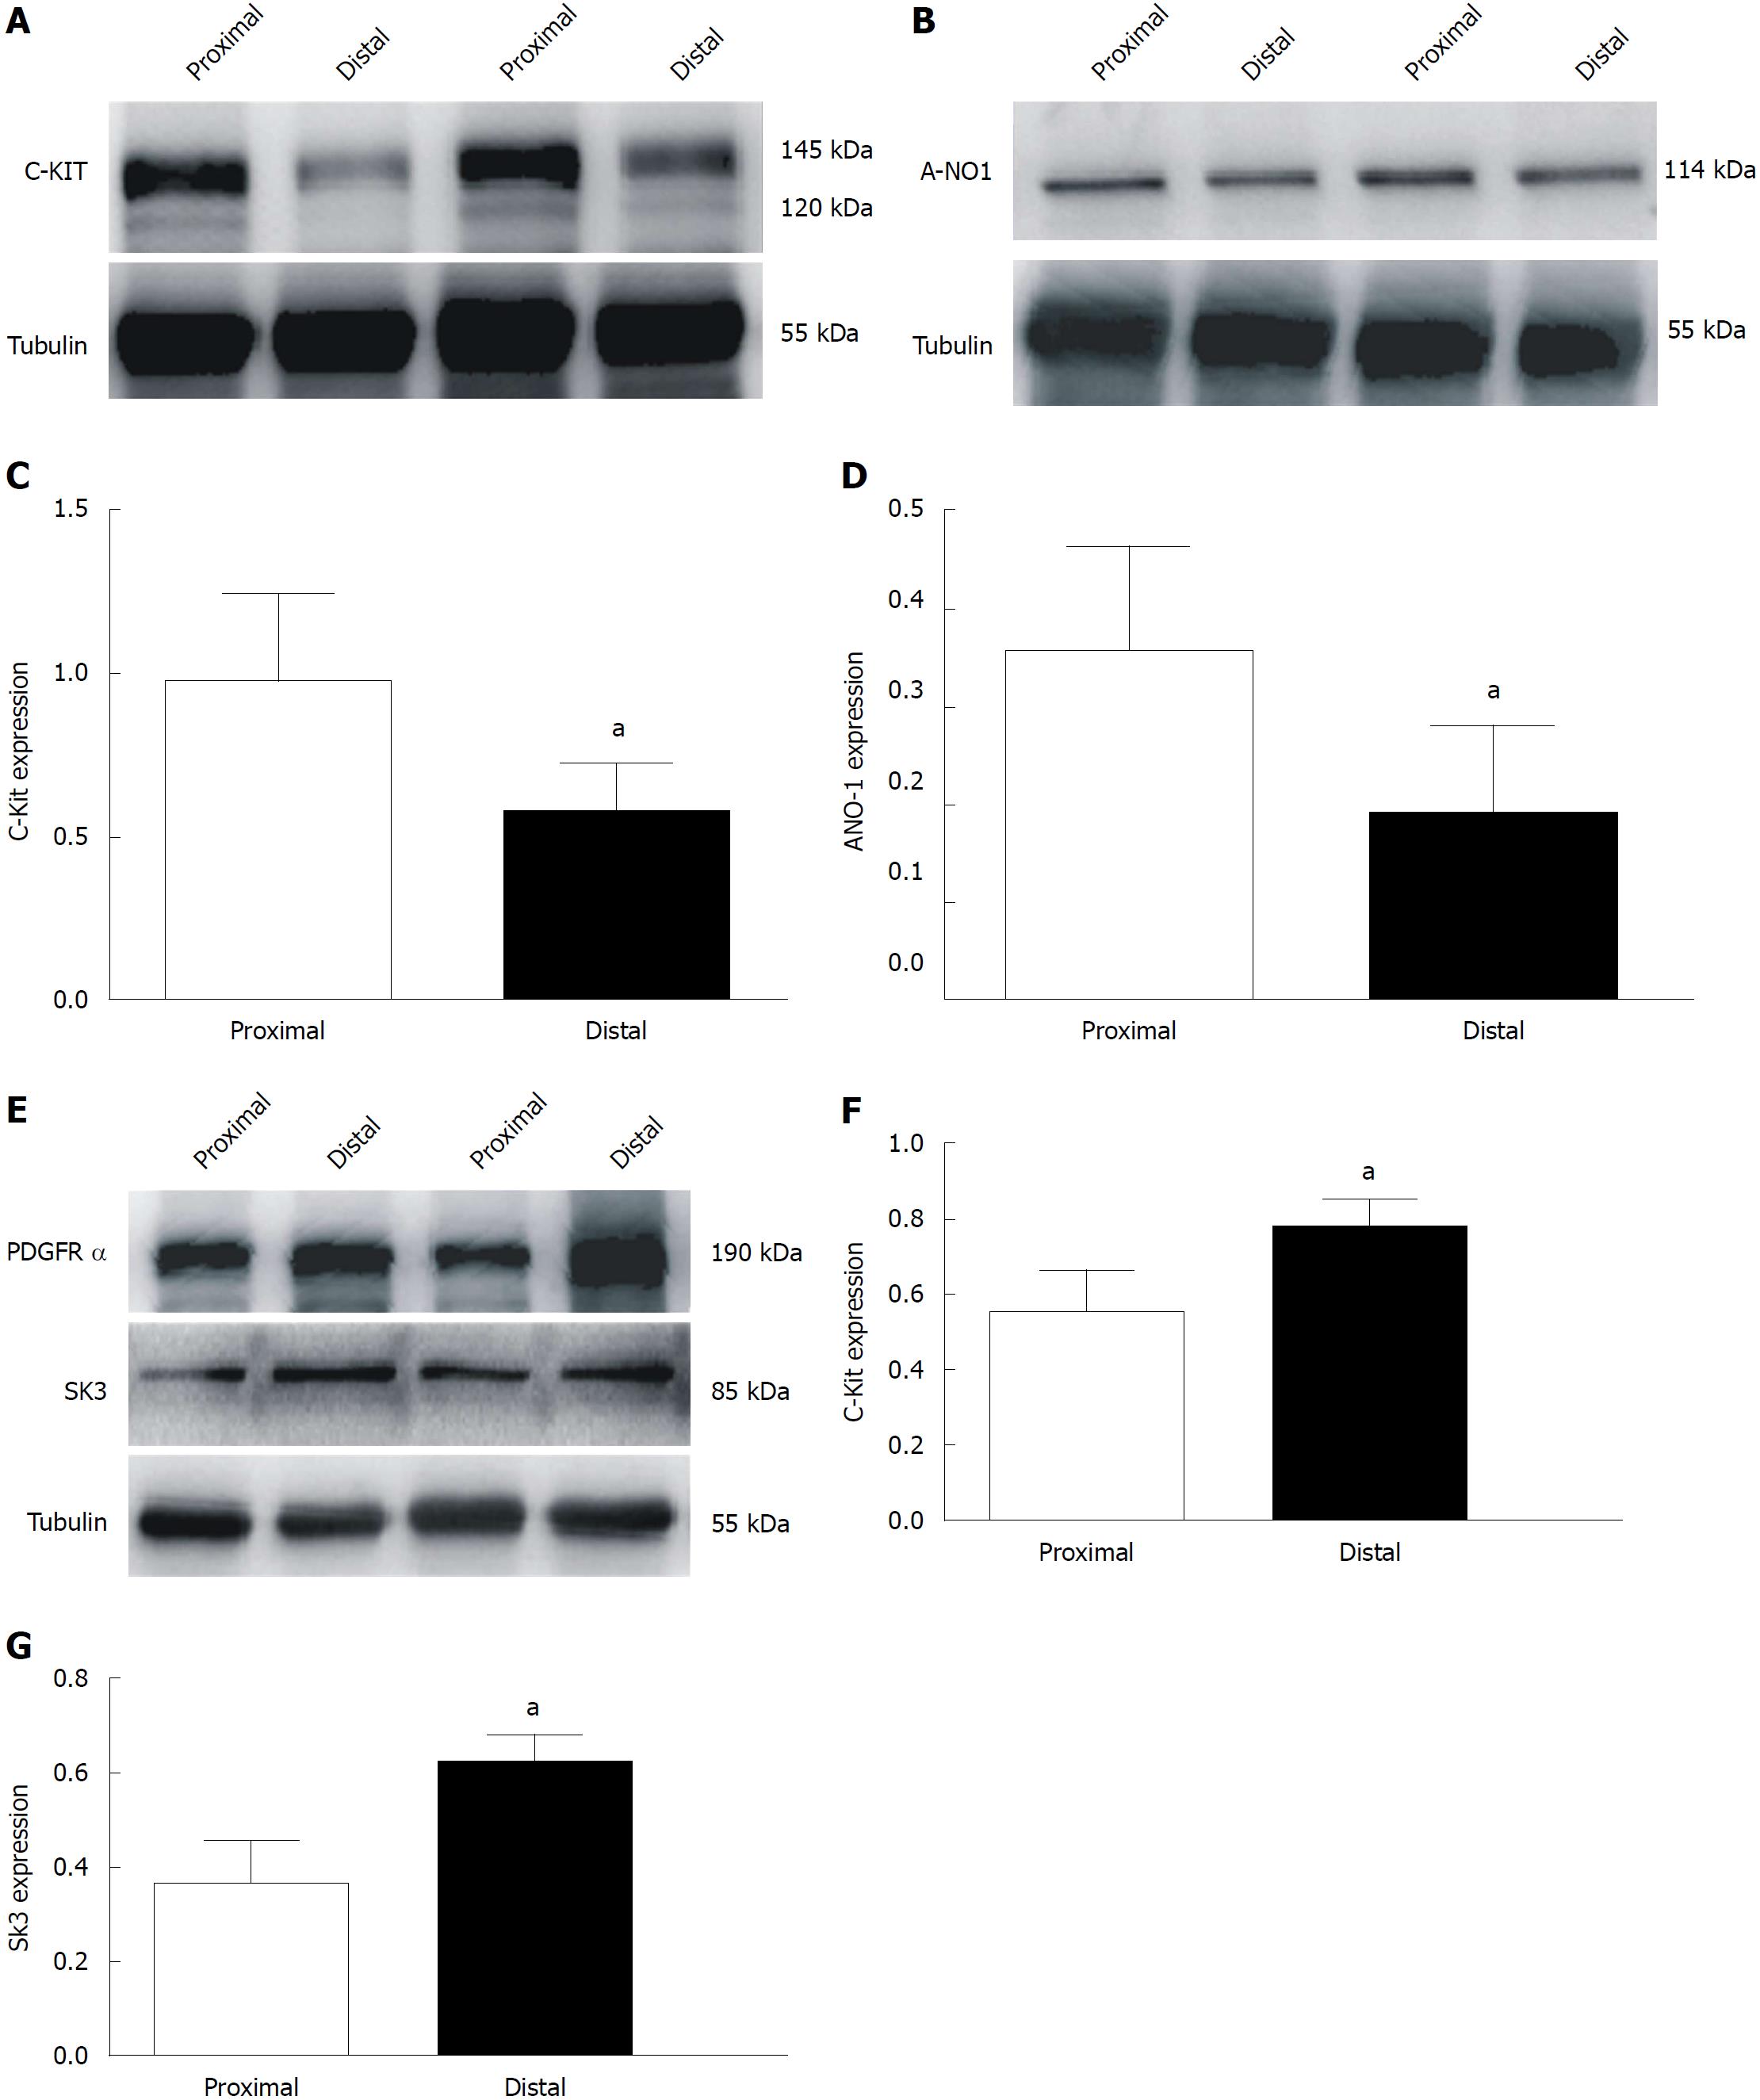
Figure 8 Expression levels of c-Kit/anoctamin-1 and platelet-derived growth factor receptor-α/small conductance calcium-activated potassium channel 3 in proximal and distal smooth muscles of the colon.
A and B: Western blot analysis of interstitial cells of Cajal (ICCs) and anoctamin-1 (ANO1) in both ends of the colon. C and D: Summary of data analyzed using densitometric quantification (ICC, ANO1 n = 8, aP < 0.05). E: Western blot analysis of platelet-derived growth factor receptor-α and small conductance calcium-activated potassium channel 3 in both ends of the colon. F and G: Summary of data analyzed using densitometric quantification (n = 8, aP < 0.05). ANO1: Anoctamin-1; SK3: Small conductance calcium-activated potassium channel 3.
- Citation: Lu C, Huang X, Lu HL, Liu SH, Zang JY, Li YJ, Chen J, Xu WX. Different distributions of interstitial cells of Cajal and platelet-derived growth factor receptor-α positive cells in colonic smooth muscle cell/interstitial cell of Cajal/platelet-derived growth factor receptor-α positive cell syncytium in mice. World J Gastroenterol 2018; 24(44): 4989-5004
- URL: https://www.wjgnet.com/1007-9327/full/v24/i44/4989.htm
- DOI: https://dx.doi.org/10.3748/wjg.v24.i44.4989


