Copyright
©The Author(s) 2018.
World J Gastroenterol. Jan 28, 2018; 24(4): 461-474
Published online Jan 28, 2018. doi: 10.3748/wjg.v24.i4.461
Published online Jan 28, 2018. doi: 10.3748/wjg.v24.i4.461
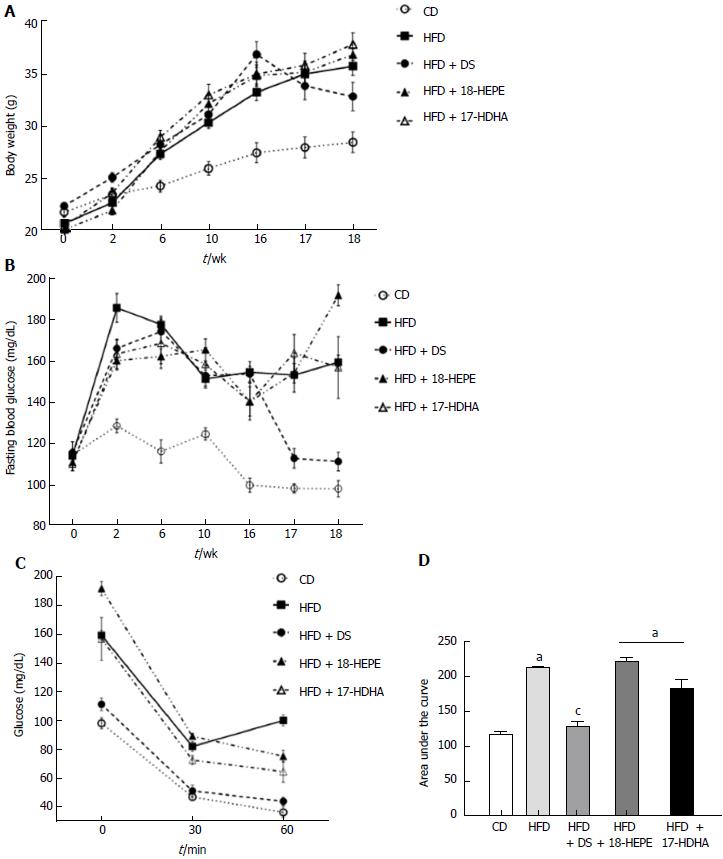
Figure 1 Weight, blood glucose and insulin tolerance test in an obesity/ nonalcoholic fatty liver disease model in C57BL/6 mice.
Weight (A), fasting glucose (B), Insulin tolerance test (C) and area under the curve from ITT data (D). All data are mean ± SEM. Groups: CD (n = 6), HFD (n = 6), HFD + DS (n = 6), HFD + 18-HEPE (n = 6), HFD + 17-HDHA (n = 6). aP < 0.05 vs CD, cP < 0.05 vs HFD by Mann-Whitney U test. HFD: High-fat, fructose-enriched diet.
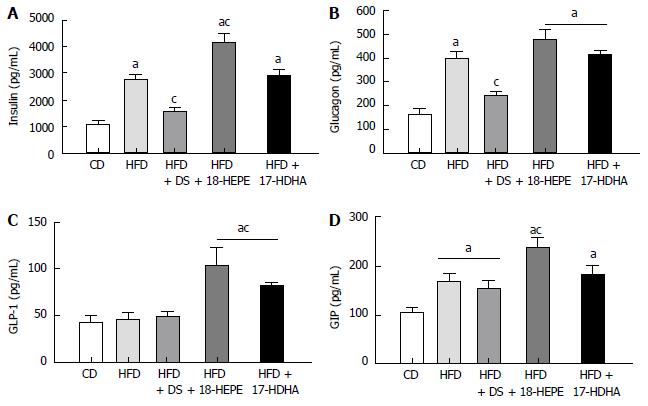
Figure 2 Hormones of glucose homeostasis.
Serum insulin (A), glucagon (B) GLP-1 (C), GIP (D). All data are mean ± SEM. Groups: CD (n = 6), HFD (n = 6), HFD + DS (n = 6), HFD + 18-HEPE (n = 6), HFD + 17-HDHA (n = 6). aP < 0.05 vs CD, cP < 0.05 vs HFD by Mann-Whitney U test. CD: Chow diet; HFD: High-fat, fructose-enriched diet, GIP: Glucose-dependent insulinotropic polypeptide.
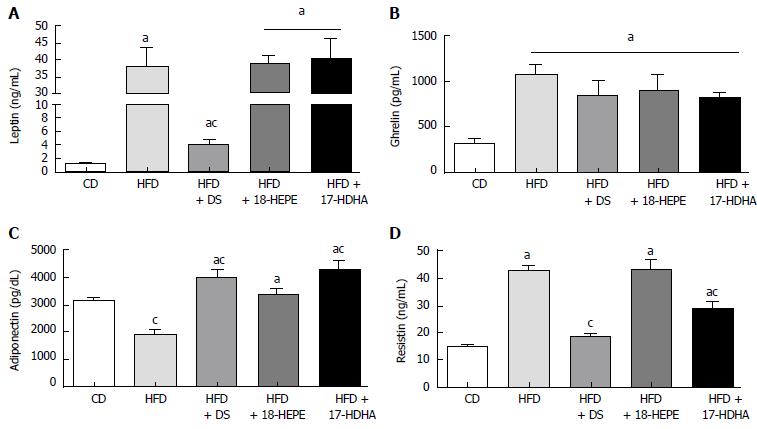
Figure 3 Energy balance hormones and adipokines.
Serum leptin (A), ghrelin (B), adiponectin (C) and resistin (D) All data are mean ± SEM. Groups: CD (n = 6), HFD (n = 6), HFD + DS (n = 6), HFD + 18-HEPE (n = 6), HFD + 17-HDHA (n = 6). aP < 0.05 vs CD, cP < 0.05 vs HFD by Mann-Whitney U test. HFD: High-fat, fructose-enriched diet.
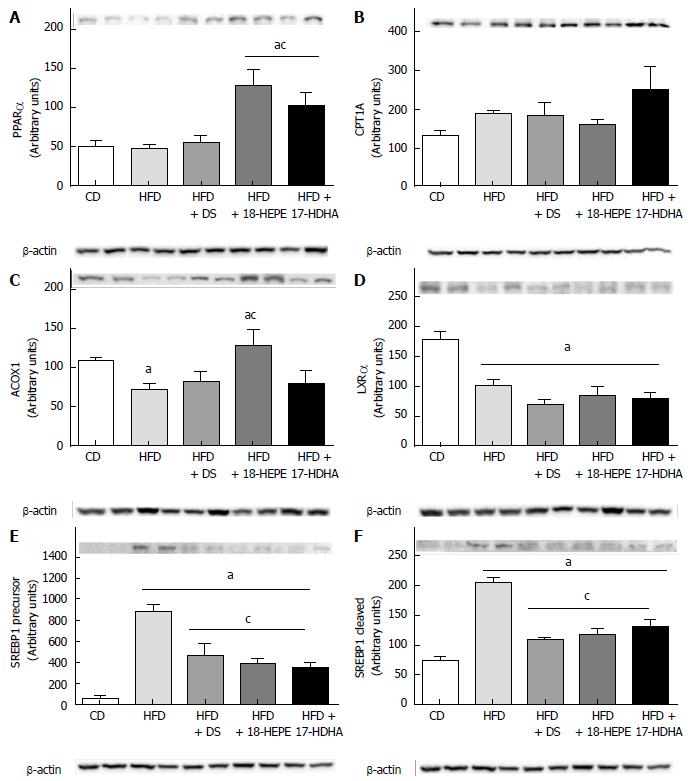
Figure 4 Hepatic proteins involved in lipid oxidation and synthesis.
PPARα (A), CPT1A (B), ACOX1 (C), LXRα (D), SREBP1 in both precursor (E) and cleaved form (F). Every two bands from left to right are representative of each group. All data are mean ± SEM. Groups: CD (n = 6), HFD (n = 6), HFD + DS (n = 6), HFD + 18-HEPE (n = 6), HFD + 17-HDHA (n = 6). aP < 0.05 vs CD, cP < 0.05 vs HFD by Mann-Whitney U test. HFD: High-fat, fructose-enriched diet.
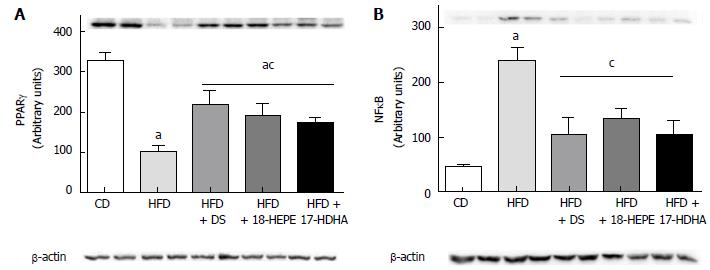
Figure 5 Hepatic proteins involved in inflammatory process.
PPARγ (A) and NF-κB (B). Every two bands from left to right are representative of each group. All data are mean ± SEM. Groups: CD (n = 6), HFD (n =6), HFD + CD (n = 6), HFD + 18H (n = 6), HFD + 17-H (n = 6). aP < 0.05 vs CD, cP < 0.05 vs HFD by Mann-Whitney U test. HFD: High-fat, fructose-enriched diet.
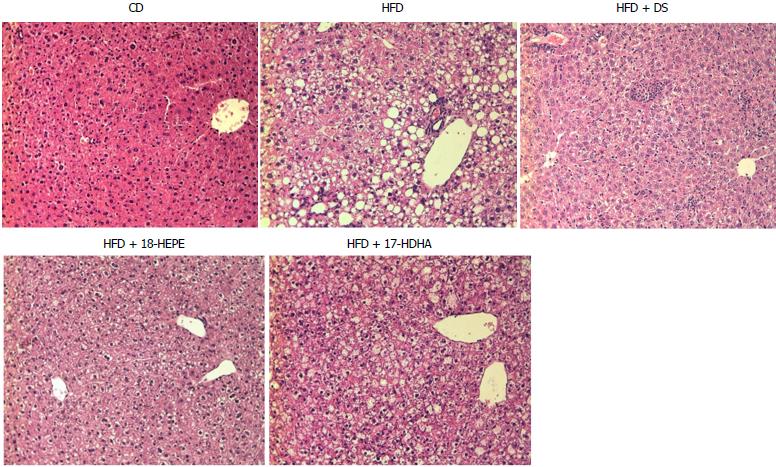
Figure 6 Liver tissue morphology.
Representative photomicrographs (Magnification × 20) Hematoxylin-eosin stain. HFD + DS showed a drastic decrease of number in fat vesicles and ballooning degeneration, but minimal change in inflammatory cells. Both groups HFD + 18-HEPE and HFD + 17-HDHA showed noticeable changes in steatosis and hepatocyte ballooning compared to HFD group. Plus, both groups displayed scarce presence of inflammatory cells.
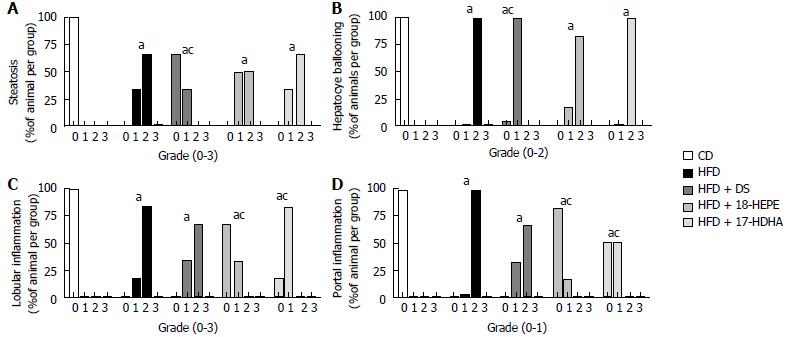
Figure 7 NAS score.
(A) Steatosis, (B) hepatocyte ballooning, (C) lobular and (D) portal inflammation. Bars represent the percentage of animals in the group at the given score. According to NAS, steatosis was graded 0-3, hepatocyte ballooning 0-2, lobular inflammation 0-3, and portal inflammation (0-2). Groups: CD (n = 6), HFD (n = 6), HFD + DS (n = 6), HFD + 18-HEPE (n = 6), HFD+17-HDHA (n = 6). aP < 0.05 vs CD, cP < 0.05 vs HFD by Fisher’s exact test.
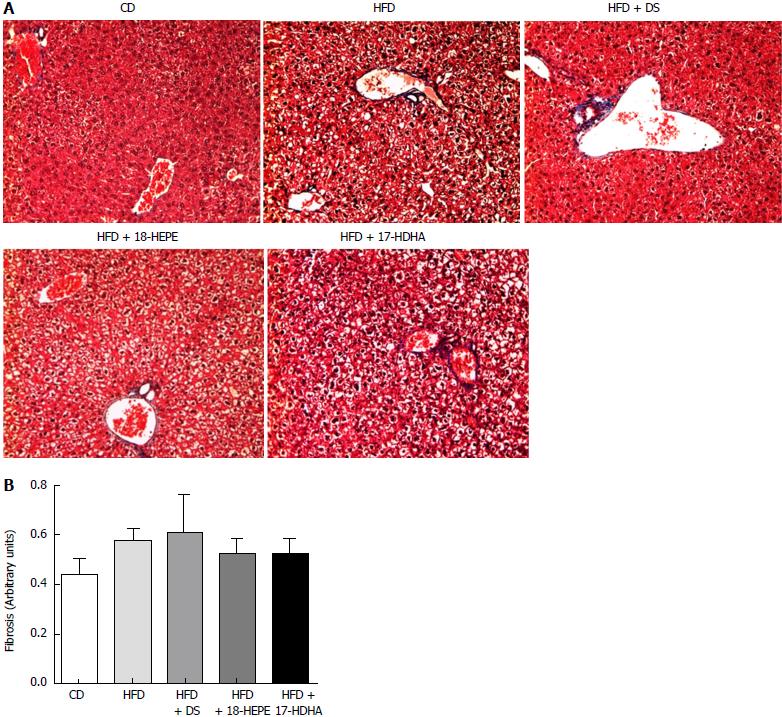
Figure 8 Extracellular matrix in liver tissue.
A: Representative photomicrographs (Magnification × 20) Masson’s trichrome stain; B: Morphological analysis represented as percentage of extracellular matrix in image. All data are mean ± SEM. Groups: CD (n = 6), HFD (n = 6), HFD + DS ( = 6), HFD + 18-HEPE (n = 6), HFD + 17-HDHA (n = 6). aP < 0.05 vs CD, cP < 0.05 vs HFD by Mann-Whitney U test.
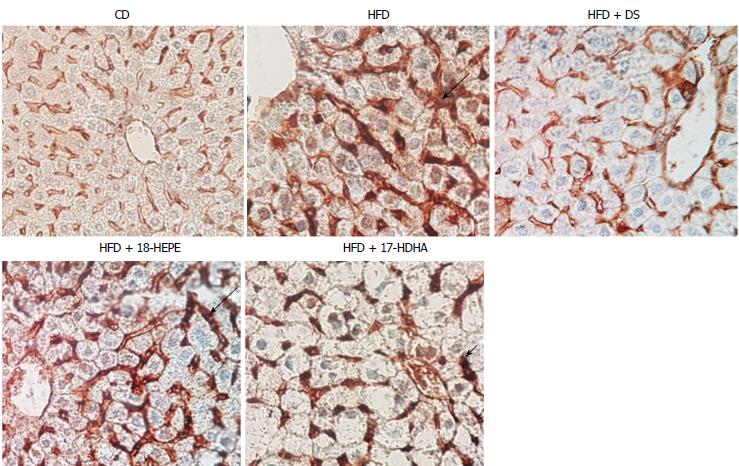
Figure 9 Expression of mouse smooth muscle actin in liver tissue.
Representative photomicrographs (Magnification × 40) Immunohistochemistry for α-smooth muscle actin (SMA). Arrows show area in which the expression is marked. SMA expression was determined to analyze early development of fibrosis. HFD group showed an augmented expression of SMA along the perisinusoidal space in compared to CD group. Noteworthy, HFD + DS and HFD + 17-HDHA showed a pronounced reduction, whereas HFD + 18-HEPE groups displayed only a modest decrease.
- Citation: Rodriguez-Echevarria R, Macias-Barragan J, Parra-Vargas M, Davila-Rodriguez JR, Amezcua-Galvez E, Armendariz-Borunda J. Diet switch and omega-3 hydroxy-fatty acids display differential hepatoprotective effects in an obesity/nonalcoholic fatty liver disease model in mice. World J Gastroenterol 2018; 24(4): 461-474
- URL: https://www.wjgnet.com/1007-9327/full/v24/i4/461.htm
- DOI: https://dx.doi.org/10.3748/wjg.v24.i4.461


