Copyright
©The Author(s) 2018.
World J Gastroenterol. Aug 28, 2018; 24(32): 3650-3662
Published online Aug 28, 2018. doi: 10.3748/wjg.v24.i32.3650
Published online Aug 28, 2018. doi: 10.3748/wjg.v24.i32.3650
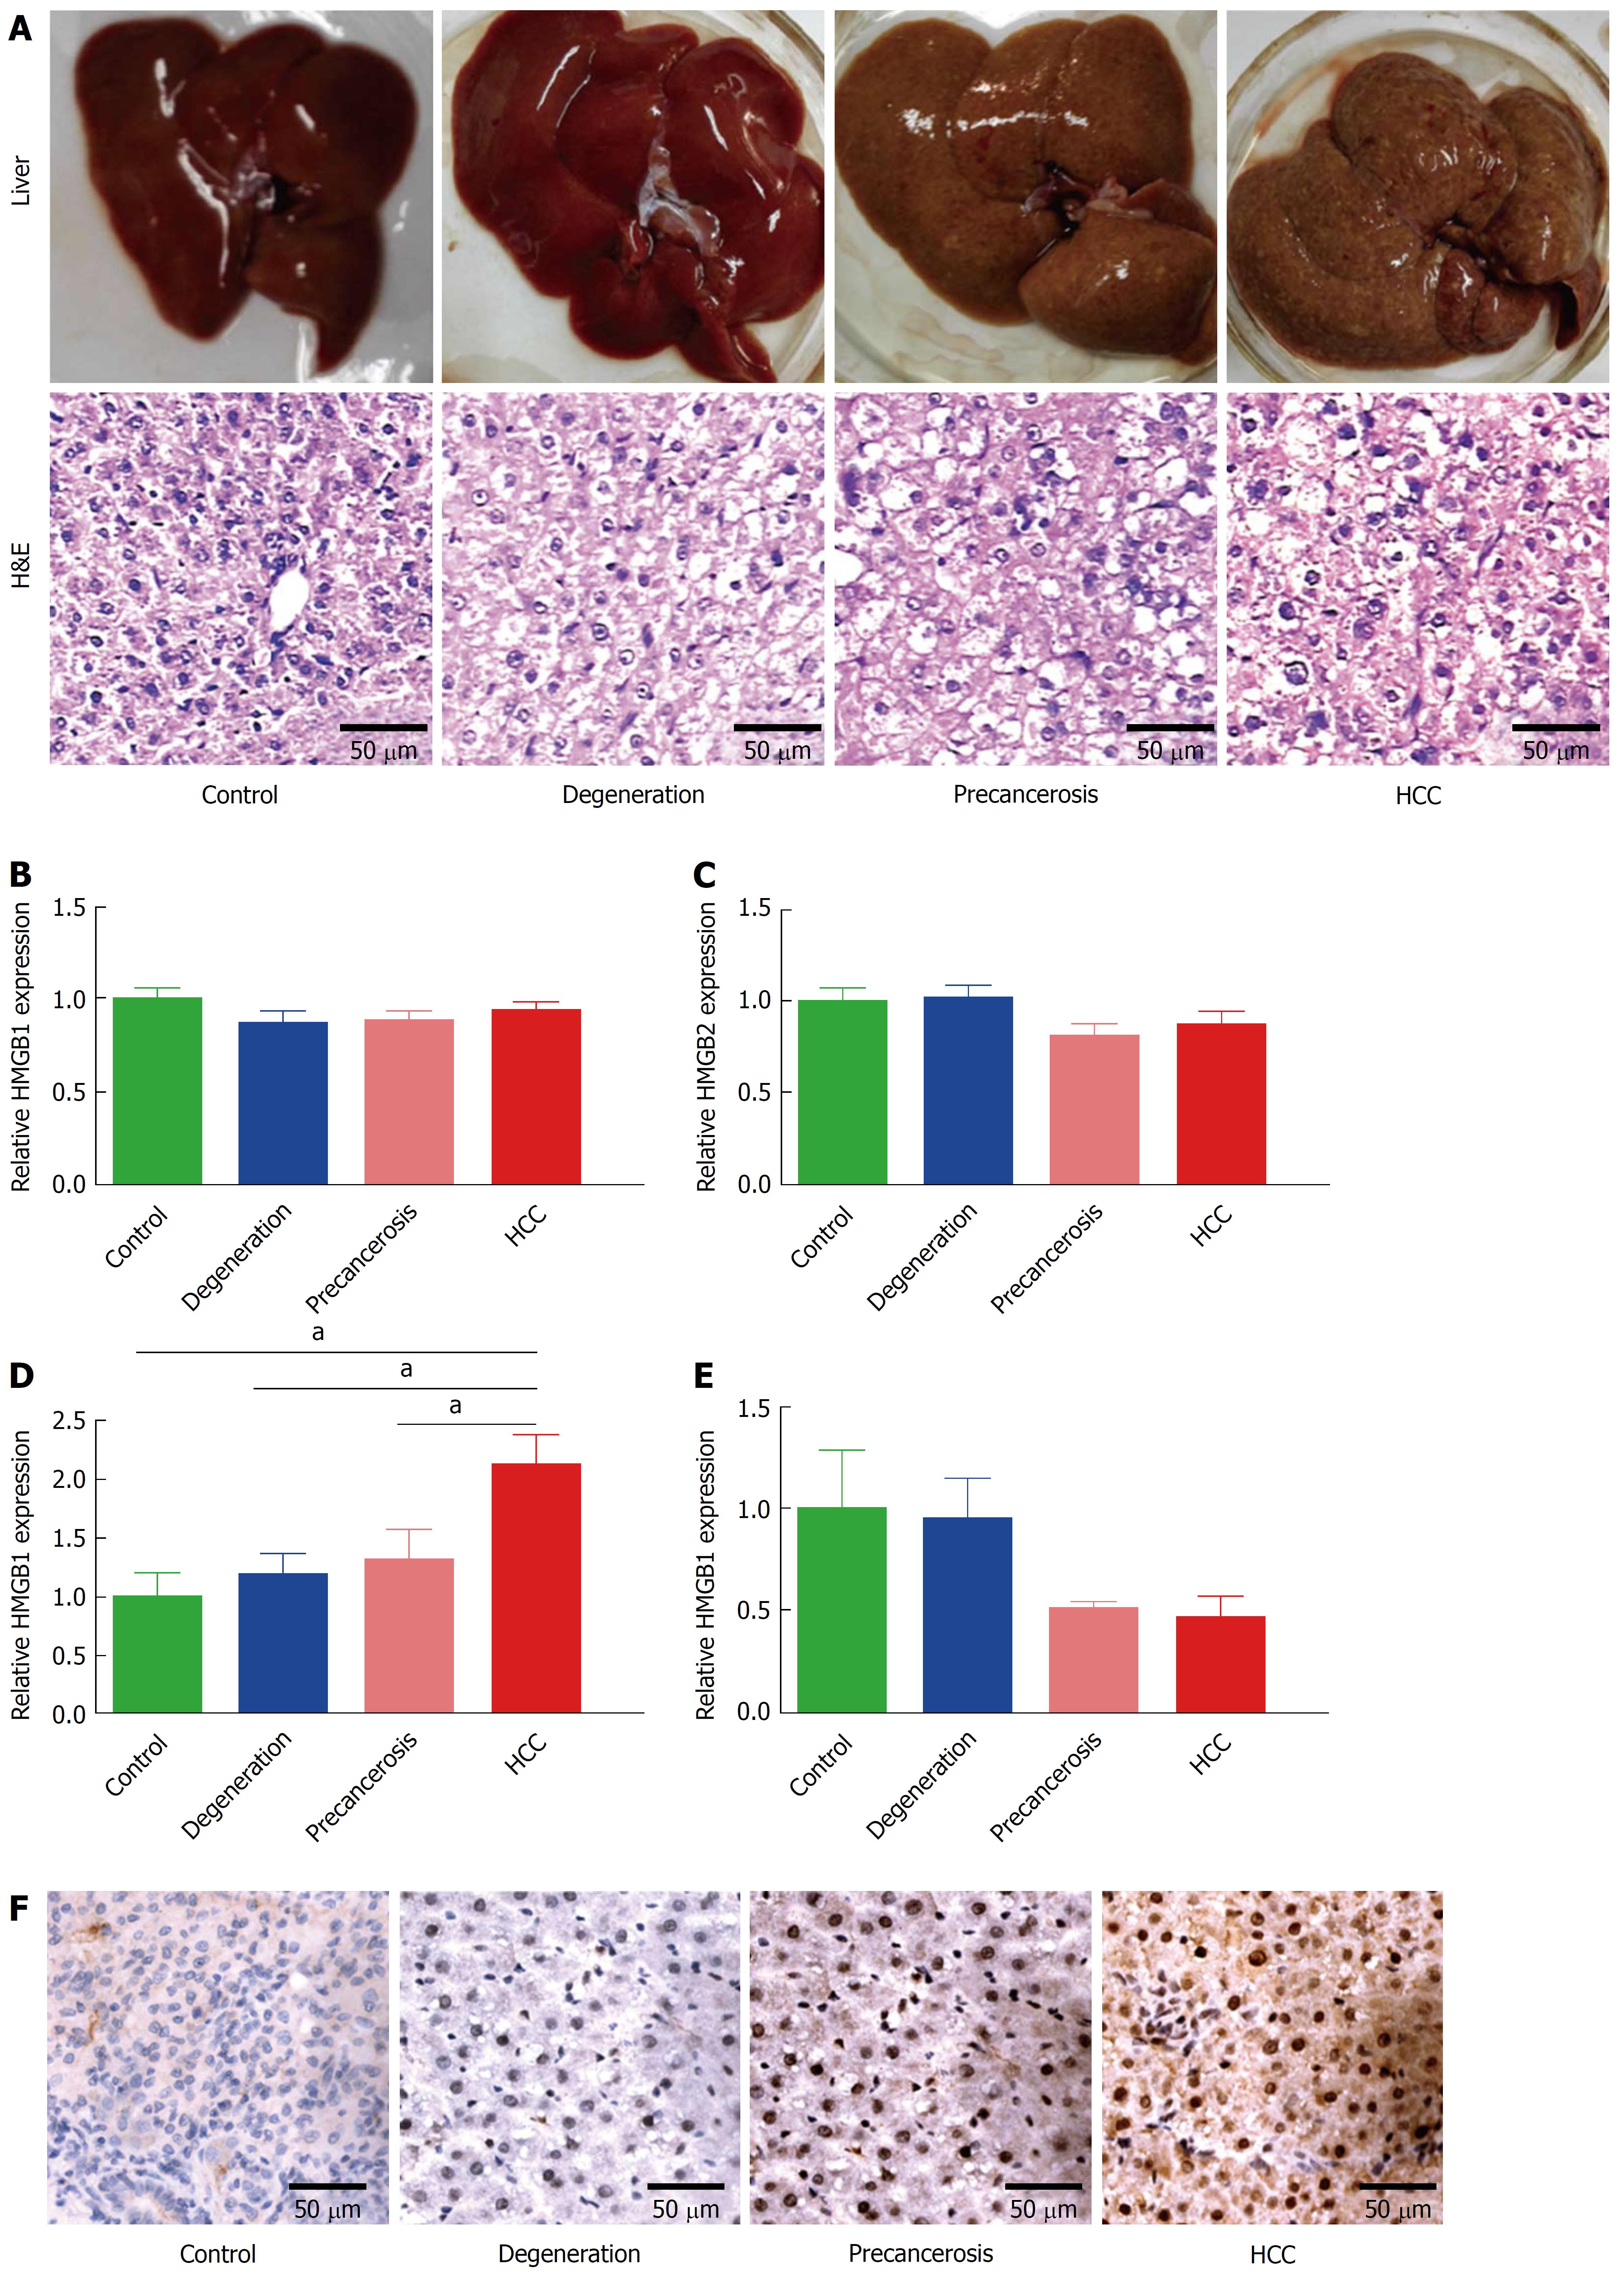
Figure 1 Dynamic upregulation of HMGB3 in rat hepatocarcinogenesis.
Rat hepatocarcinogenesis models were successfully made by consistent 2-AAF intake. A: The dynamic alterations of liver morphology (upper panel) and H&E staining (lower panel) of liver tissues in rat hepatocarcinogenesis. The livers of the rat model, according to the results of rat liver H&E staining, were divided into normal, degeneration, precancerous, and HCC group. B-E: the dynamic alterations of the HMGB family at the mRNA level in models were detected by RT-qPCR. B: HMGB1 mRNA. C: HMGB2 mRNA. D: HMGB3 mRNA. E: HMGB4 mRNA. Each band was presented as a relative value normalized to normal controls (n = 6). F: the immunohistochemical staining of rat HMGB3 expression in different groups. aP < 0.05. 2-AAF: 2-acetylaminofluorene; H&E: Hematoxylin and eosin; HMGB: High mobility group-box; RT-qPCR: Reverse transcription-quantitative polymerase chain reaction.
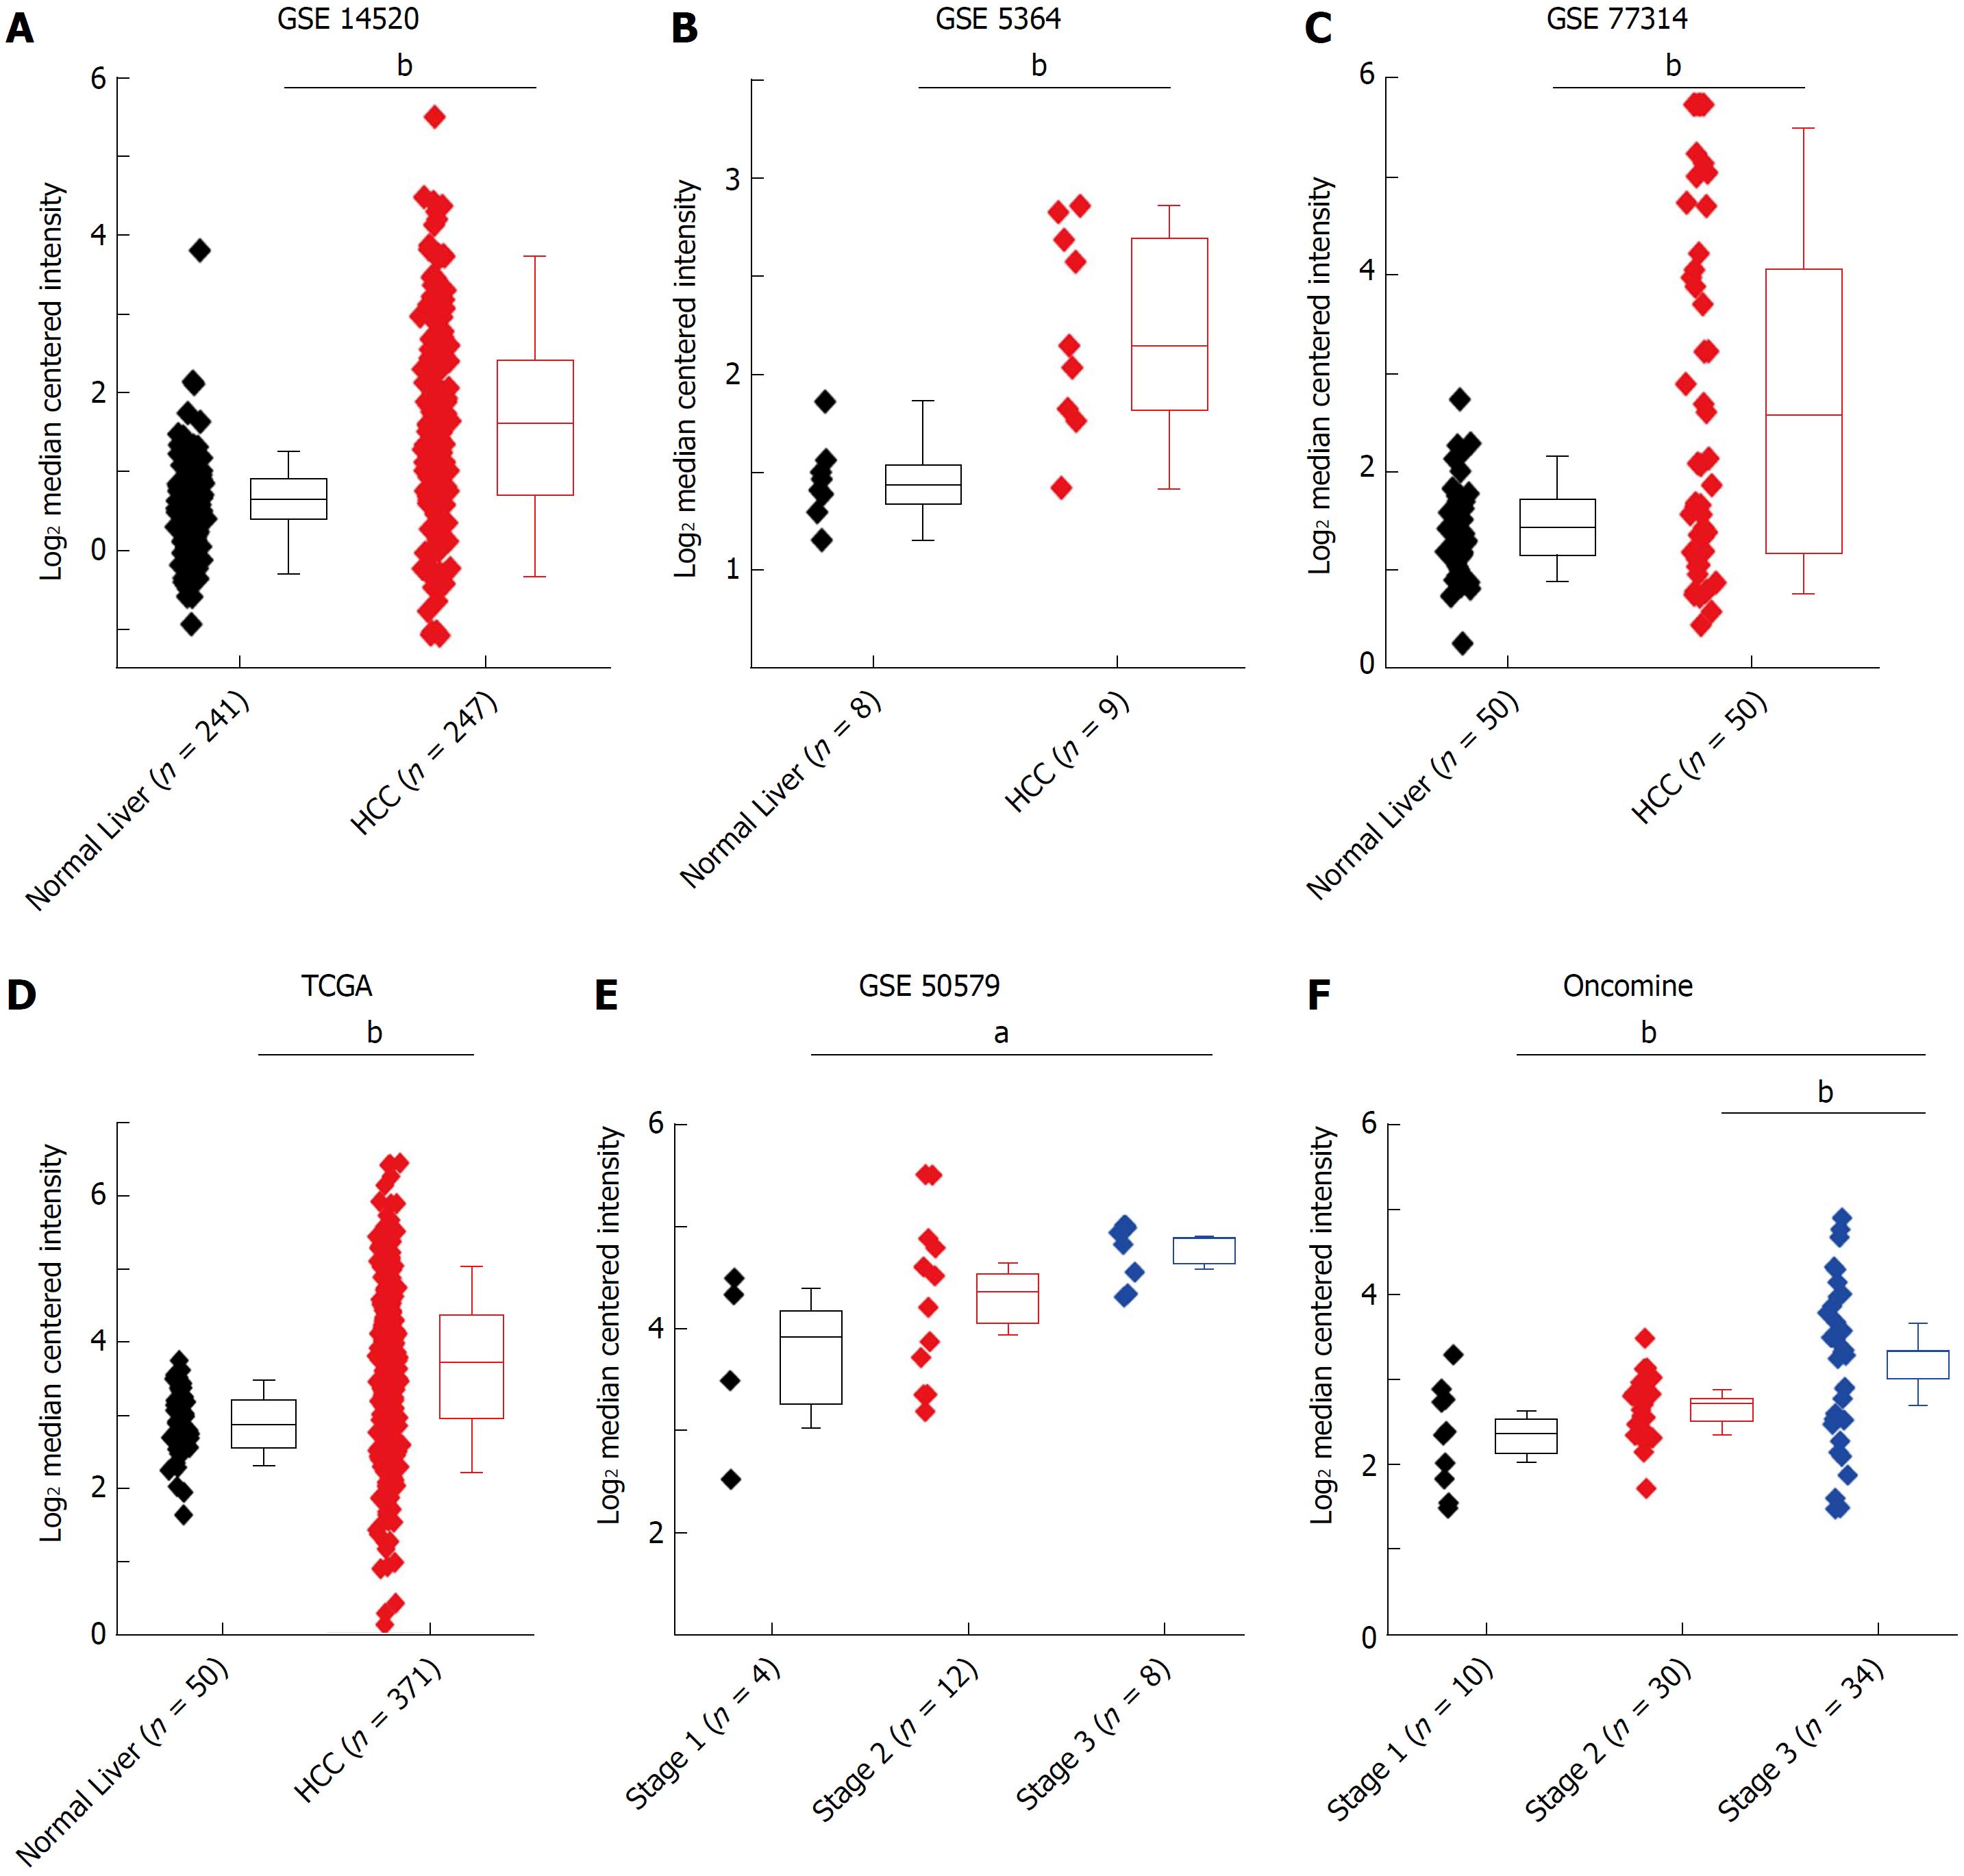
Figure 2 HMGB3 mRNA expression related to hepatocellular carcinoma by bioinformatic databases.
Comparative analysis of human normal livers (n = 359) and HCC (n = 765) tissues from bioinformatics databases suggested that the upregulation of hepatic HMGB3 mRNA might be involved in HCC progression. The data of HMGB3 mRNA in HCC or normal liver were extracted from A: GSE-14520, B: GSE-5364, C: GSE-77314, D: the HMGB3 mRNA in TCGA database, E: GSE-50579, and F: the HMGB3 mRNA in Oncomine database. Values were presented as Log2 median centered intensity. aP < 0.05; bP < 0.01.GSE and GEO Series; TCGA: The Cancer Genome Atlas; HCC: Hepatocellular carcinoma.
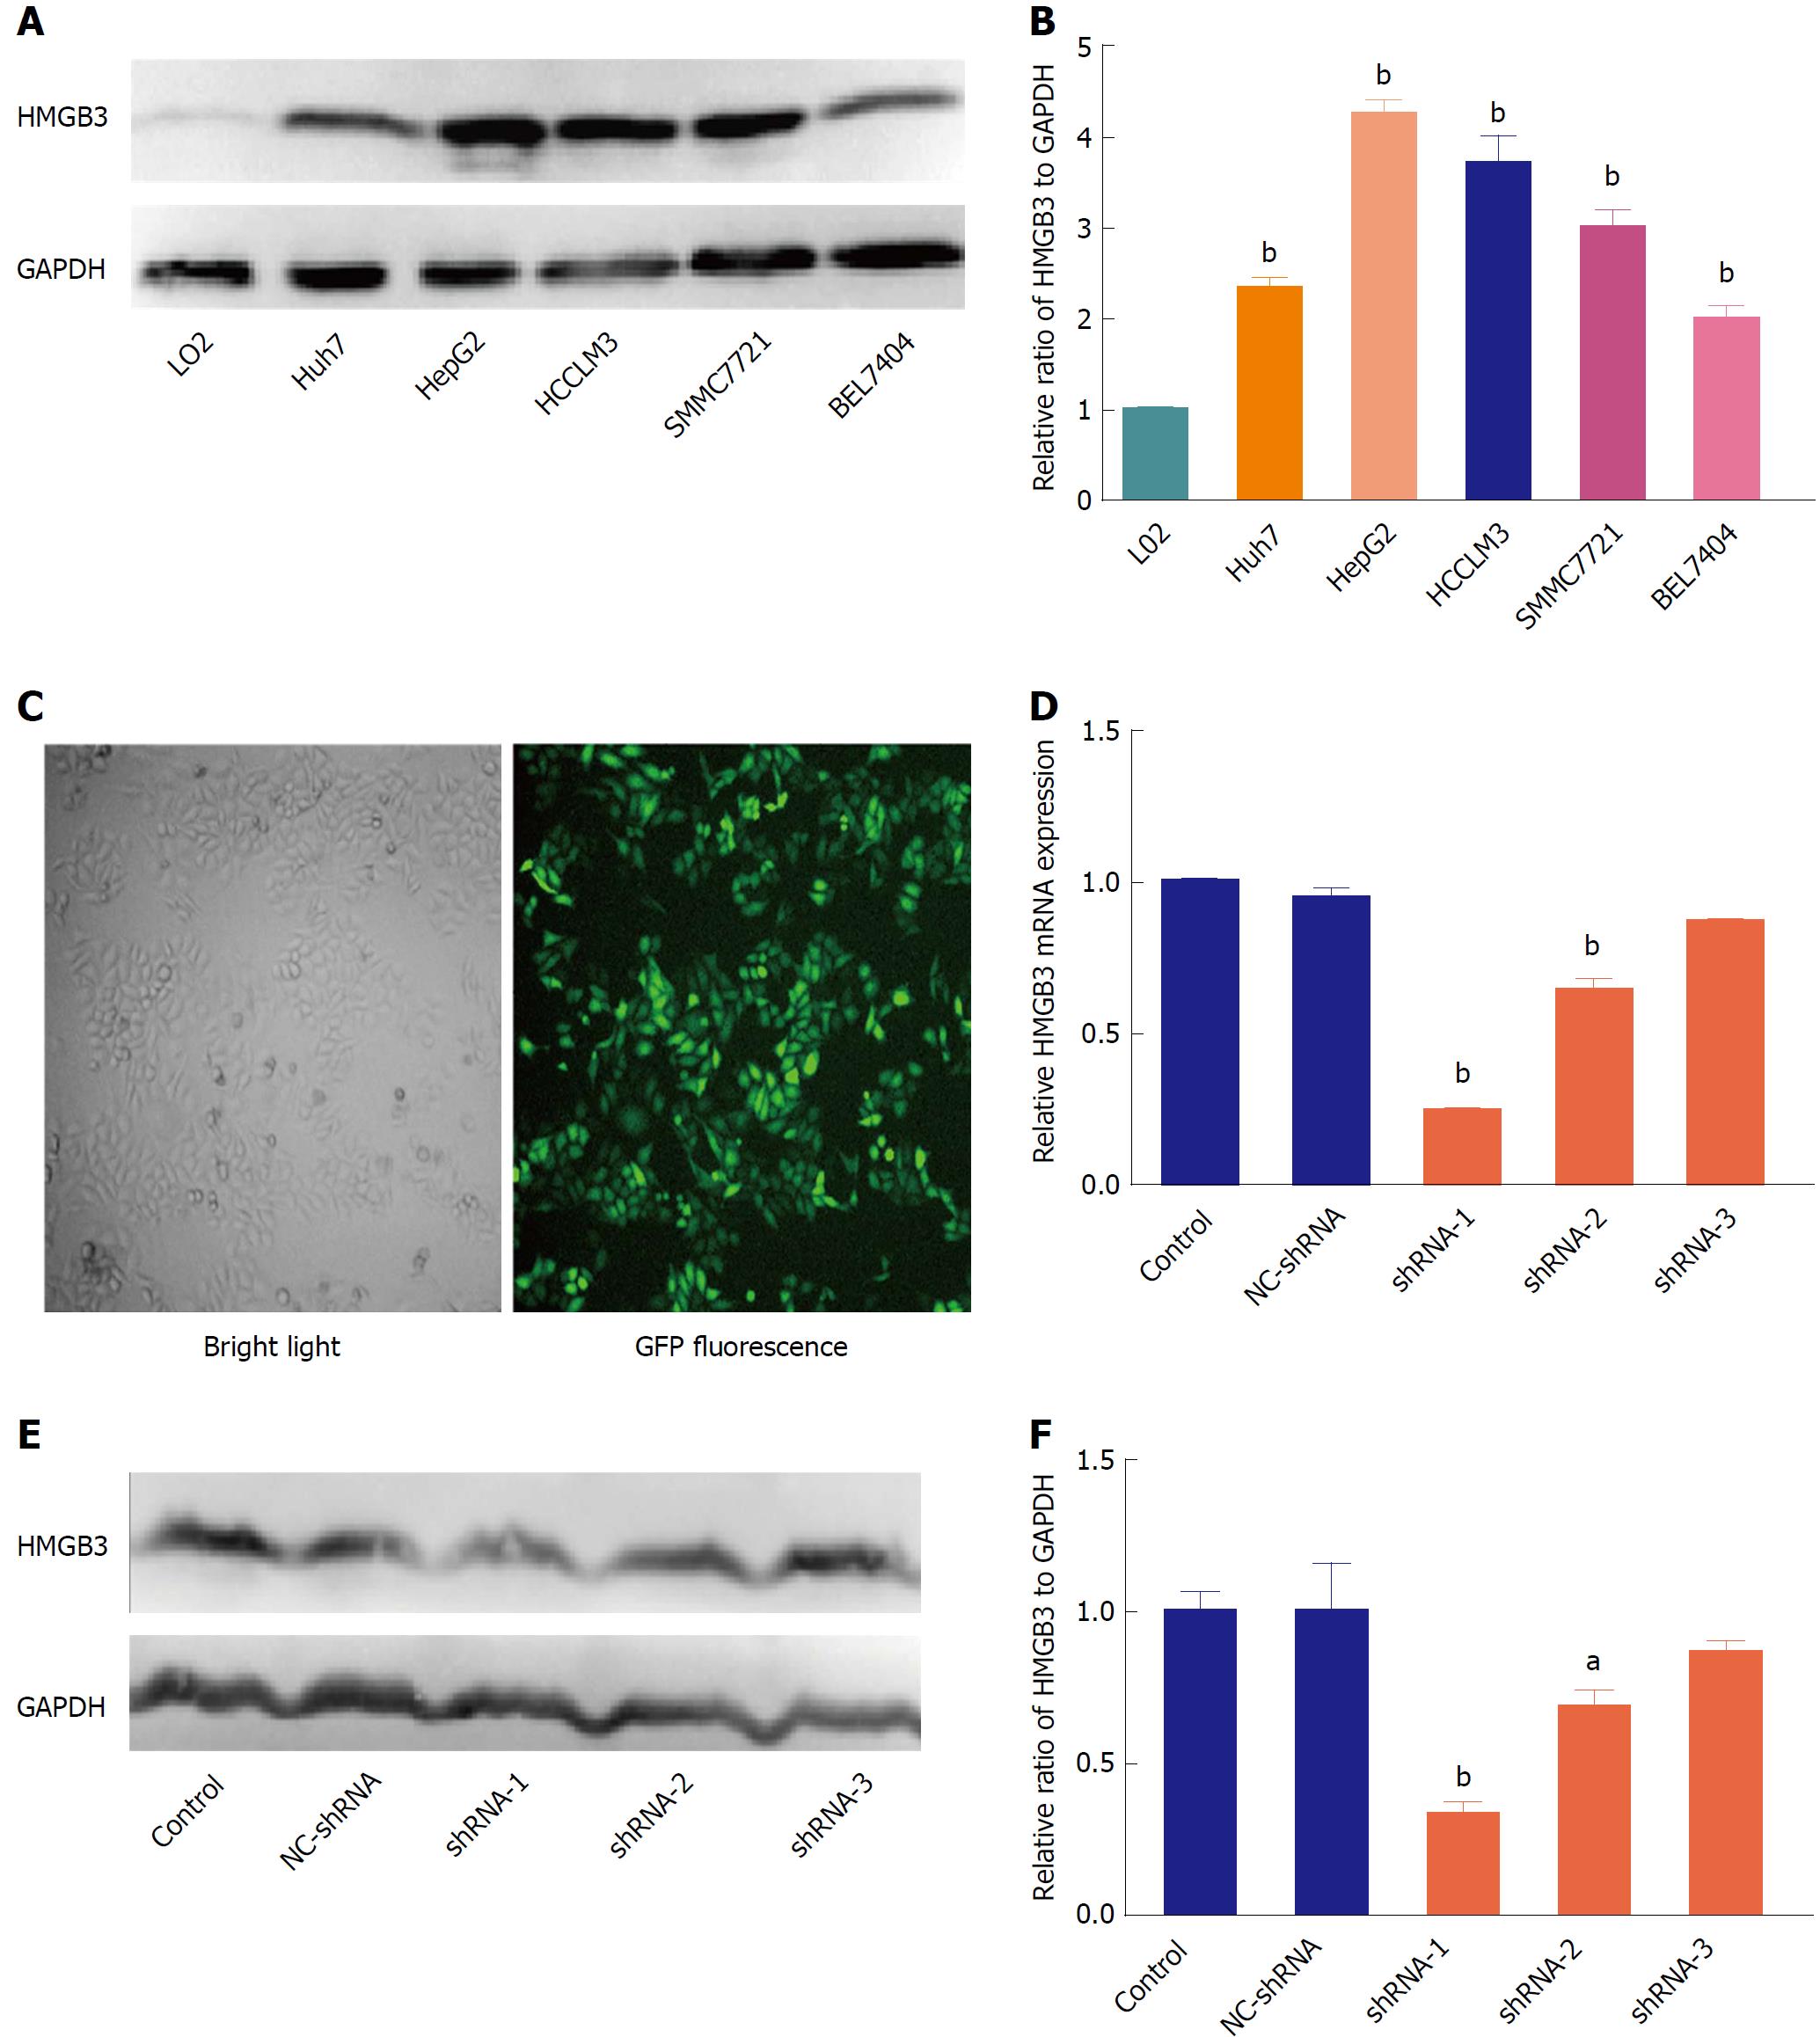
Figure 3 Silencing HMGB3 in hepatocellular carcinoma cell lines.
A: The protein expression of HMGB3 was detected in different HCC cell lines (Huh7, HepG2, HCCLM3, SMMC7721, and BEL7404), and normal hepatocytes L02 using western blotting. GAPDH was used as an internal reference. B: Each bar represents the corresponding intensity in A normalized to GAPDH. C: Representative morphology of HepG2 cells transfected with GFP-labeling shRNA in bright light and fluorescence. D: RT-qPCR was performed to detect HMGB3 mRNA levels in HepG2 cells transfected with different shRNAs and control. Relative value of HMGB3 was calculated according to the 2−ΔΔCt method. E: Western blotting was conducted to analyze the HMGB3 protein expression in cells of the shRNA-transfected group and control group. F: Each bar represents the corresponding intensity in E normalized to GAPDH. aP < 0.05; bP < 0.01.
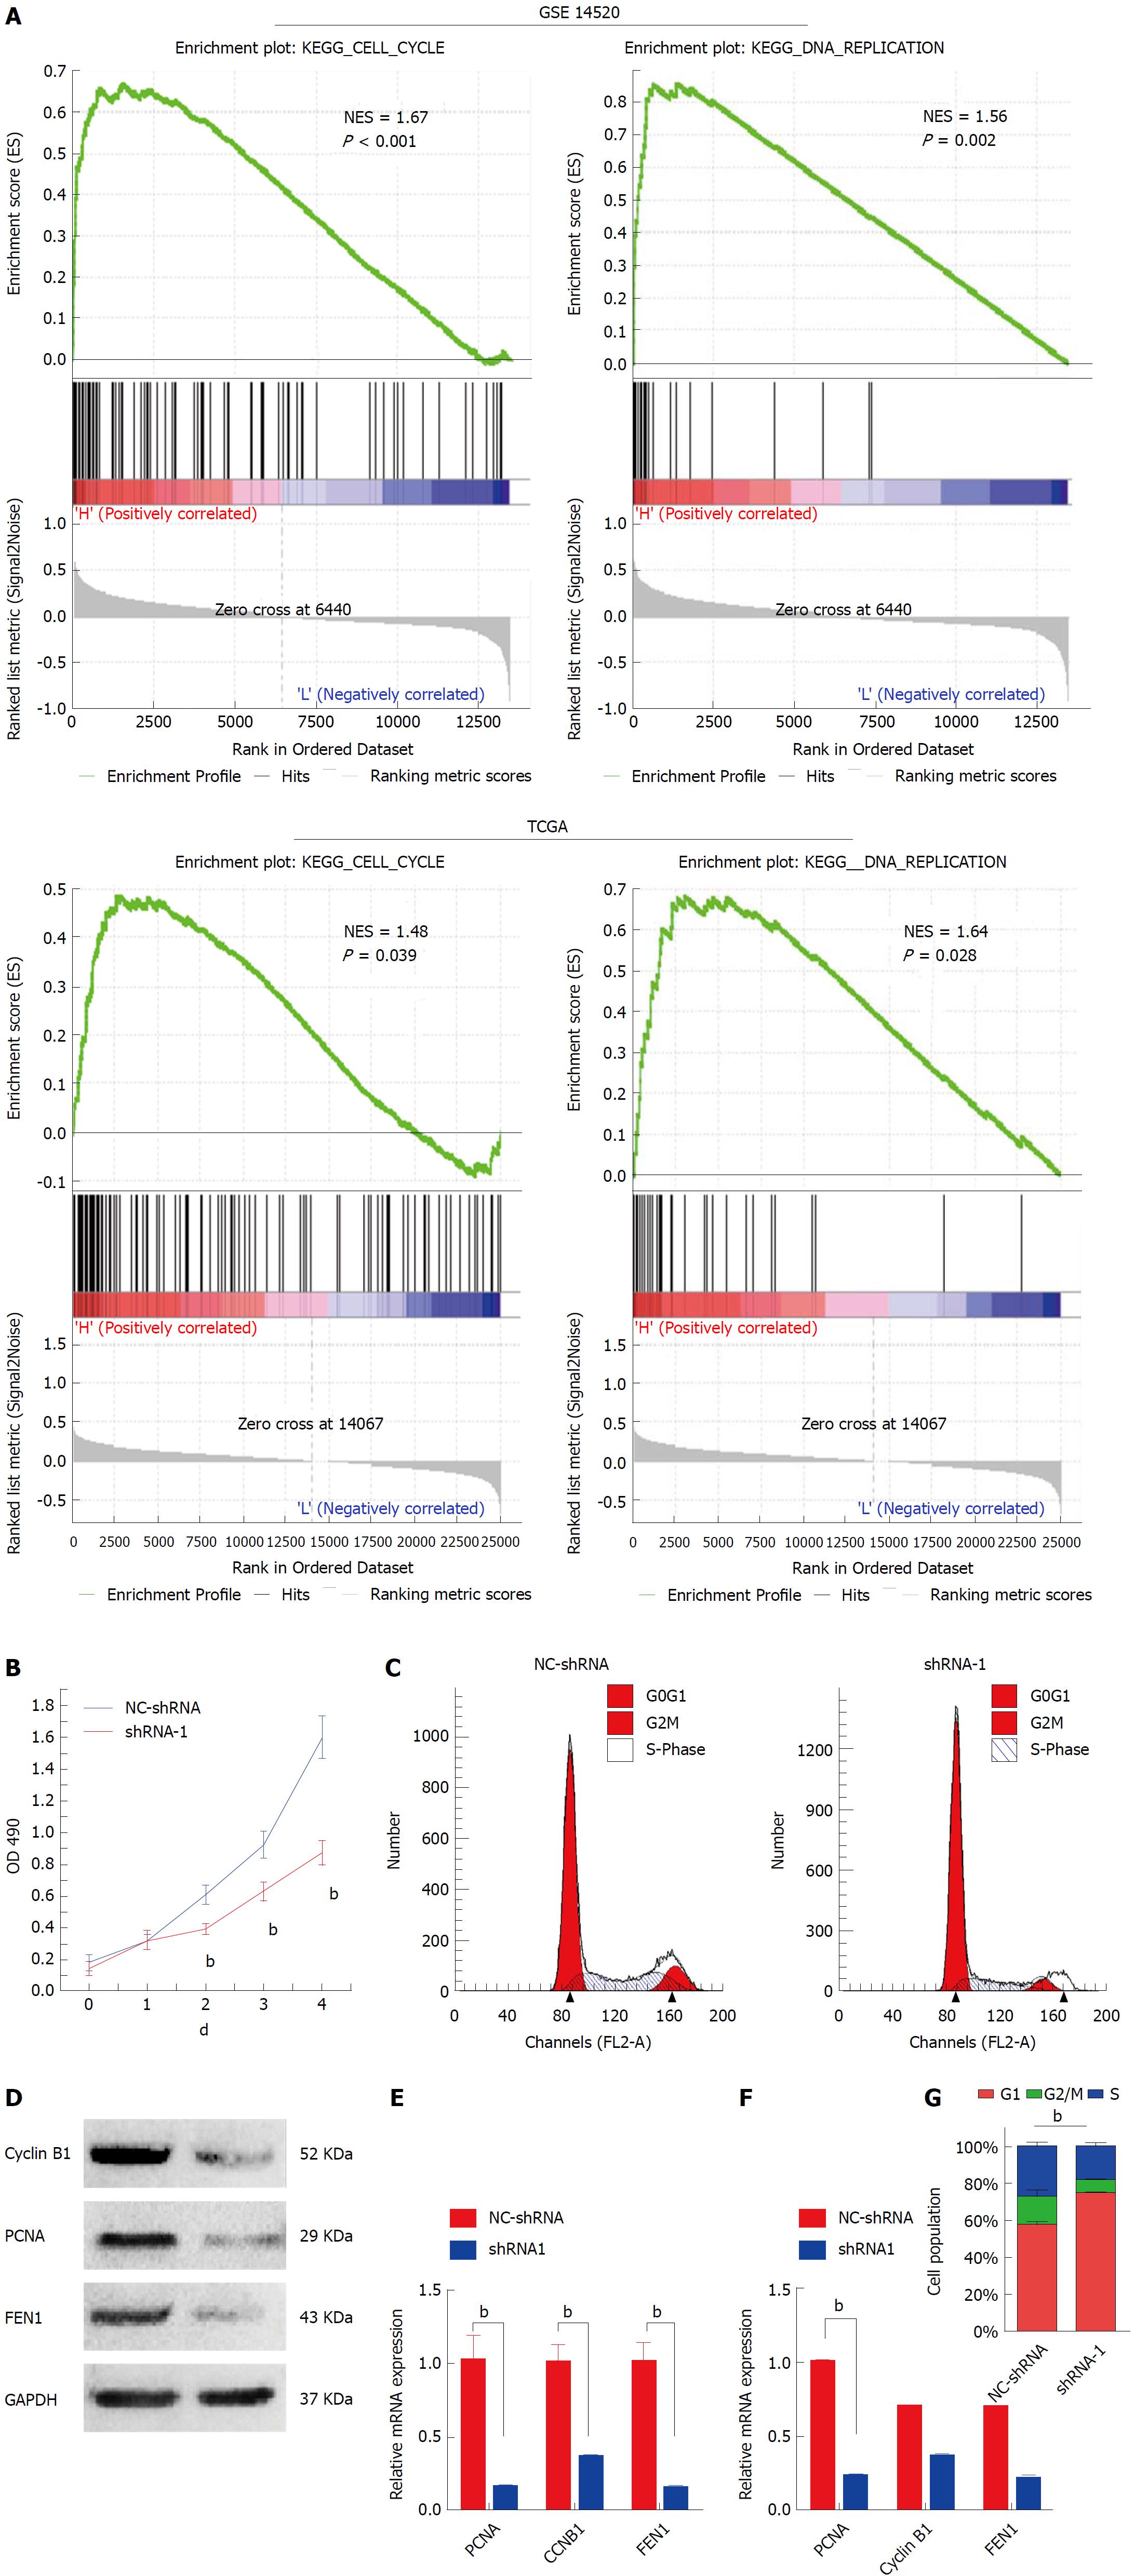
Figure 4 Knockdown HMGB3 inhibited cell cycle and proliferation of hepatocellular carcinoma cells.
A: Gene set enrichment analysis (GSEA) was conducted to sort the pathways according to HMGB3 expression in GSE14520 and TCGA. Cell cycle and DNA replication pathways were found to be significantly correlated with HMGB3 expression. B: Proliferation of HepG2 cells transfected with shRNA-1 and NC-shRNA was detected using the MTT method. C: Cell cycle of HepG2 cells was analyzed after transfection with shRNA using flow cytometry. D: According to the GSEA analysis, three genes (CCNB1, PCNA, and FEN1) involved in cell cycle and DNA replication were detected after shRNA transfection using RT-qPCR. E: Western blotting was conducted to observe the protein expression of cyclin B1, PCNA, and FEN1 in the NC-shRNA and shRNA-1 group. F: Each bar represents the corresponding intensity in E normalized to GAPDH. G: Percentage columns represent the distribution of the cell cycle in corresponding groups. bP < 0.01.
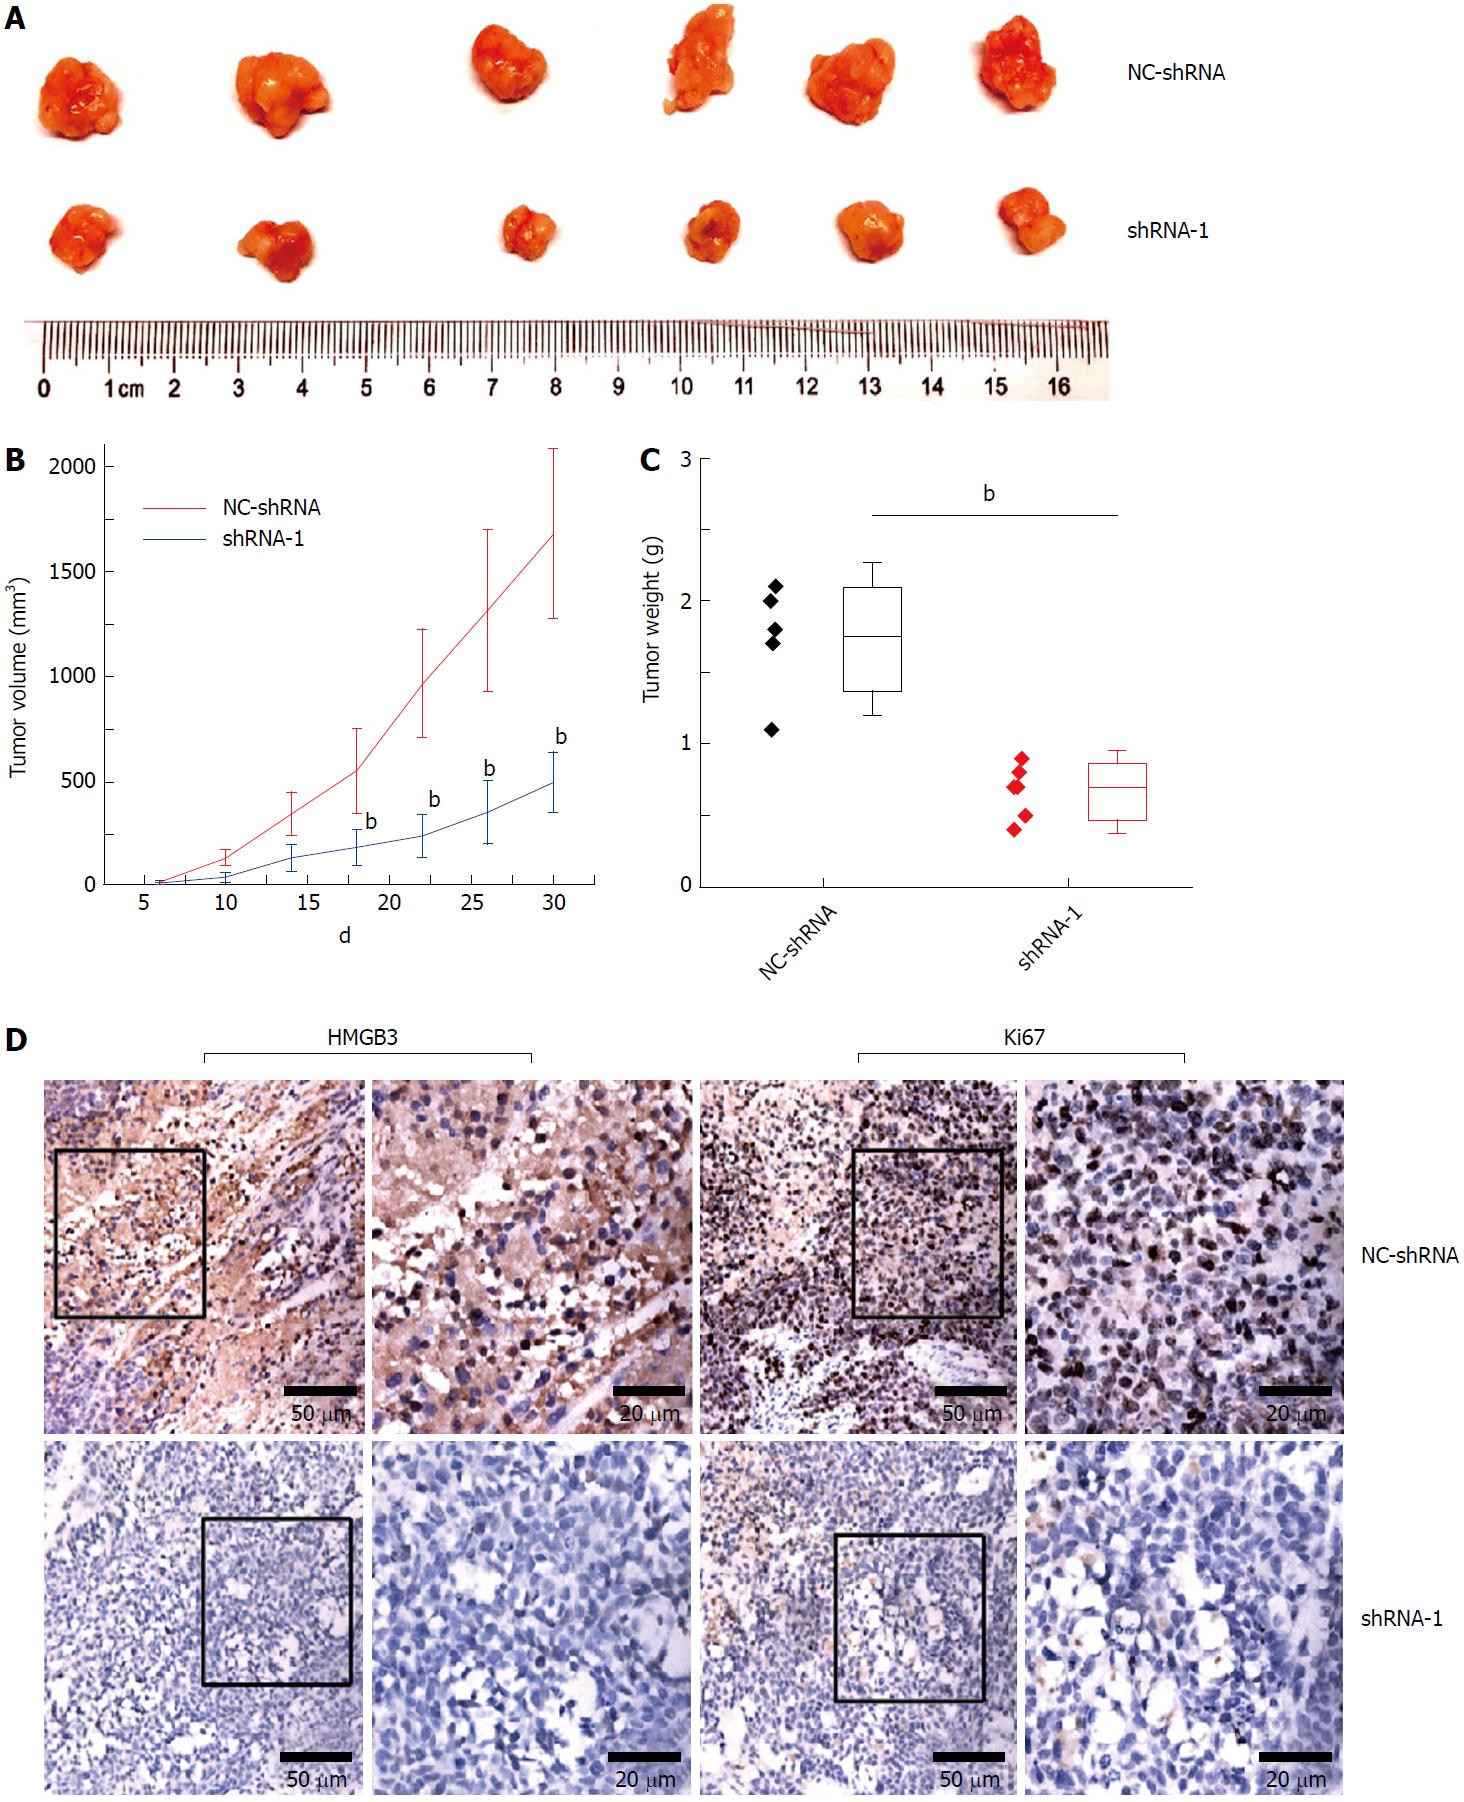
Figure 5 Silencing HMGB3 suppressed growth of xenograft tumor.
HepG2 cells transfected with NC-shRNA and shRNA-1 were subcutaneously injected into mice. A: The morphology of the xenograft tumor in the NC-shRNA or shRNA-1 group at 30th d. B: The growth curves of tumors derived from HepG2 cells in the NC-shRNA or shRNA-1 group. C: The weight of xenograft tumors in the NC-shRNA or shRNA-1 group. D: The immunochemical staining of HMGB3 and Ki67 in xenograft tumor tissues in the NC-shRNA or shRNA-1 group. bP < 0.01.
- Citation: Zheng WJ, Yao M, Fang M, Wang L, Dong ZZ, Yao DF. Abnormal expression of HMGB-3 is significantly associated with malignant transformation of hepatocytes. World J Gastroenterol 2018; 24(32): 3650-3662
- URL: https://www.wjgnet.com/1007-9327/full/v24/i32/3650.htm
- DOI: https://dx.doi.org/10.3748/wjg.v24.i32.3650


